
Abstract
We aimed to find clinically relevant gene activities ruled by the signal transducer and activator of transcription 3 (
Introduction
Cancer is one of the major killing diseases worldwide. Among them, breast cancer (BC) has quickly become the most commonly diagnosed malignancy of women in Taiwan during the past decade. 1 Such a global disease has its own heterogeneity clinically and molecularly. Up to now, ER(–) breast cancer population still needs as many efficient therapies as ER(+) one has. The poor prognostic features for both triple negatives (TN) and ERBB2+ have been considered as the top two killing subtypes in breast cancer. 2 A recent review on TN tumors 3 pointed out that TN is a heterogeneous group of multiple molecular subtypes of breast cancer.
To resolve the complexity of disease like cancer using systems approaches, which have integrated transcriptomic data into molecular network, they show promise in their ability to classify tumor subtypes, predict clinical progression, and inform treatment options.4,5 We proposed to search for the transcription factors critical to a subset of ER(–) breast tumor development with the aid from the new statistical approach 6 on analyzing genome-wide gene expression data of 91 infiltrating ductal carcinoma (IDCs).
Many transcription factors have been predicted to be determinants of clinical indices in 91 IDCs. Their clinical niches are under investigation. In this study, we are interested in unraveling the role(s) for the most recognized signal transduction pathways in both mammary gland and breast cancer development involving the
Here, we proposed the diagnostic and/or prognostic roles of
Materials and Methods
Features of surgical specimens in 103 breast cancer gene expression profiles
We obtained 91 specimens of primary infiltrating ductal carcinoma of breast (IDC) consisting of five subgroups. They are triple negatives(48/91), ERBB2+(29/91), ER(–)PR(+)HER(–)(5/91), ER(–) PR(+)HER(+)(6/91) and ER(–)PR(+) but HER(?) (3/91). Five specimens for metaplastic carcinoma of breast (MCB) were included in this study. Seven non-tumor samples were surgically taken from breast tissue adjacent to some of 91 ER(–) IDC breast tumors as a control. Those samples were obtained from patients who underwent surgery at National Taiwan University Hospital (NTUH) between 1998 and 2007. Breast cancer samples containing relatively pure cancer as defined by greater than 50% tumor cells per high-power field examined in an adjacent section of tumor sample are for this study.
16
All patients had given informed consent according to the guidelines approved by the Institutional Review Board at NTUH. Total dataset for 103 gene expression profiles (103A) used in this study has been submitted to NCBI-GEO. Its accession number is GSE32641. Both TN and ERBB2+ are major subpopulations among four subtypes of ER(–) breast cancer cohort. In addition, the mRNA levels of both
Immunohistochemical (IHC) stain of paraffin-embedded breast cancer slides
A standard biotin-streptavidin-peroxidase procedure with automated IHC systems (Benchmark, Ventana Medical Systems, USA) was used. For visualization of immunostain, we applied diaminobenzidine as a chromogen (
A noninvasive vascularity detection in vivo and baseline characteristics of the studied patients
Mammography has been the mainstay of breast cancer screening worldwide. It can detect the microcalcification in breast lesions for stage 0 breast cancer patients. However, microcalcification in breast lesion is difficult to be detected by mammography for Asian women as compared to Caucasian women. Alternatively, a noninvasive Doppler ultrasound has been applied for breast cancer screening in Asian women population (e.g. Taiwanese women) who have the morphological view of breast tissue denser than those of Caucasian women.
18
Both vascular patterns and vascular density are quantitatively measured in tumor section using this technique in coupling with a computed image processing system, which automatically calculate the density of vascular signals (designated as “vascularity index”) within the tumor tissue of interest.
19
Vascularity index (VI) measures both microvasculature and macrovasculature at once. In particular, color Doppler ultrasound was reported to be able to depict larger vessels of approximately 100 μm or larger in diameter
Microarray data analyses
A gene profile per breast tumor specimen was analyzed using Human 1A (version 2) oligonucleotide microarray (half a genome size: 22k). 16 We used a new measure of association called coefficient of intrinsic dependence (CID) in combination with Galton Pearson's Correlation Coefficient (GPCC) to analyze the continuous variables (e.g. the gene expression profiles) genome-wide. We built a transcriptional regulatory network by performing the analysis of CID-TFUGPCC (Fig. 1). The brief flow of entire analyses involving the CID procedure explains how those get extended in this study (Fig. 2).

The core methodology of CID-TFUGPCC. A procedure for producing a transcriptional regulatory network of interest

The flow chart of steps involved in establishing the transcriptional regulatory network in relation to biochemical phenotypes, malignant phenotypes and clinical outcomes. A self-contained summary of the CID procedure is presented. A major scheme (linked by dark arrows) includes (1) ANOVA test on a TF of interest against seven clinical indices; (2) CID-TFUGpCC analyses on a selected population based on its significant features evaluated by ANOVA; (3) Venn Diagram analysis on the selected gene pools (networks) from the results of step (2); (4) Functional validation of a subnetwork of interest derived from step (3) by its gene expression patterns in different clinical indices, by its prediction in clinicopathological features and by its supporting literature documentation. A side scheme (linked by light arrows) is based on the same dataset but using a different TF to carry on steps (2)–(4).
The correlation between the mRNA level of a selected TF and the clinical index was analyzed by applying analysis of variance (ANOVA) to dichotomous and multichotomous indices, respectively. 22 We, therefore, selected the clinical significant subpopulations for network approach using the analysis of CID-TFUGPCC.
CID has the advantage of identifying indirect (or non-linear) regulatory association between a TF and its target gene. On the other hand, GPCC preferentially identifies direct (or linear) regulatory association between a TF and its target gene. Thus, it is necessary to combine both unique regulatory actions of a TF on its target gene to construct a TF mediated transcriptional regulatory network. The rationale of using both methods together has been described in Liu et al. (2009).
6
In this study, we use hierarchical clustering
23
to subgroup data before CID measurements that is to replace quantile clustering described previously.
6
It is the key clustering strategy in mimicking a pre-programmed transcriptional activity mediated by a selected TF to be clustered into a subgroup for CID analysis. We also take advantage of a unique feature of CID in measuring the association for a small N in each subgroup (N ≈10). After hierarchical clustering on the data in a given sample population, we set the final number of subgroups to be rounding number for 1/10th the total sample number (i.e. 8 subgroups for 77A) before CID measurement. The mRNA data partitioning for a perturbed transcription factor in a given population may be clustered based on the similar gene expression patterns. Only some unique situations may need other clustering strategies
24
before CID measurement. We evaluate significance (
We used Gene Spring GX7.3.1 (Agilent Technologies, USA) for generating Venn Diagrams. This analysis allows gene pools to be extracted from overlapped network and/or non-overlapped ones when two networks of interest are compared. In addition, for biochemical pathway profiling of a selected transcriptional regulatory network, we included gene pools in the signal transduction pathways from both KEGG and NCBI databases to be compared with those in the network. We also evaluated the common gene pools shared by network and clinicopathological parameter(s). Based on current version of gene annotation from NCBI database, we were able to do functional prediction on gene lists in subnetworks within the selected network. We demonstrated gene expression patterns of those subnetworks in heatmaps along with (1) their relevant clinical categories; (2) their prediction power for the new clinicopathological feature(s); and (3) their supporting literature documentation to further functionally validate network results.
The heatmaps showing gene expression patterns were displayed after unsupervised hierarchical clustering. Three steps are included as follows. First, the log2 ratio for each gene was first centered by subtracting the mean across all samples to discriminate the subclass of the dataset. Then, the selected gene expression profiles were fed into software for displaying gene list (Y axis) and patient arrays (X axis) based on unsupervised hierarchical clustering analysis on gene profiles of selected arrays. Lastly, to generate feature color bars underneath of the heatmap, we only locate each feature of interest based on the final heatmap display.
We evaluated the significance (
Computing P -values for results from univariate CID and GPCC analyses
The univariate CID result for a given TF was designated as CID-TF. Instead of all subgroups having an equal size (N ≈ 10),
2
we divided the cohort by hierarchical clustering
23
(described in method as above) to mimic biological systems in which similar expression pattern in a subgroup may reflect the similar biological event shared by the members within a subgroup. The subgroup was designated as
To access the significance of univariate CID values generated via
Results and Discussion
STAT3 is critical to ER(–) breast tumor development
CID-STAT3UGPCC pulls a gene pool containing potential target genes of
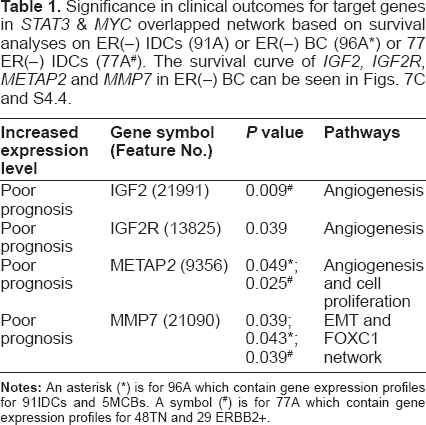
Significance in clinical outcomes for target genes in
The pathological information (Clinicopathological parameters) for ERBB2+, triple negatives (TN) and metaplastic carcinoma of breast (MCB).

Up regulated cancer related genes in the overlapped network of clinically significant (CS)

Major clinical implications of STAT3 in 77 breast cancer gene expression profiles
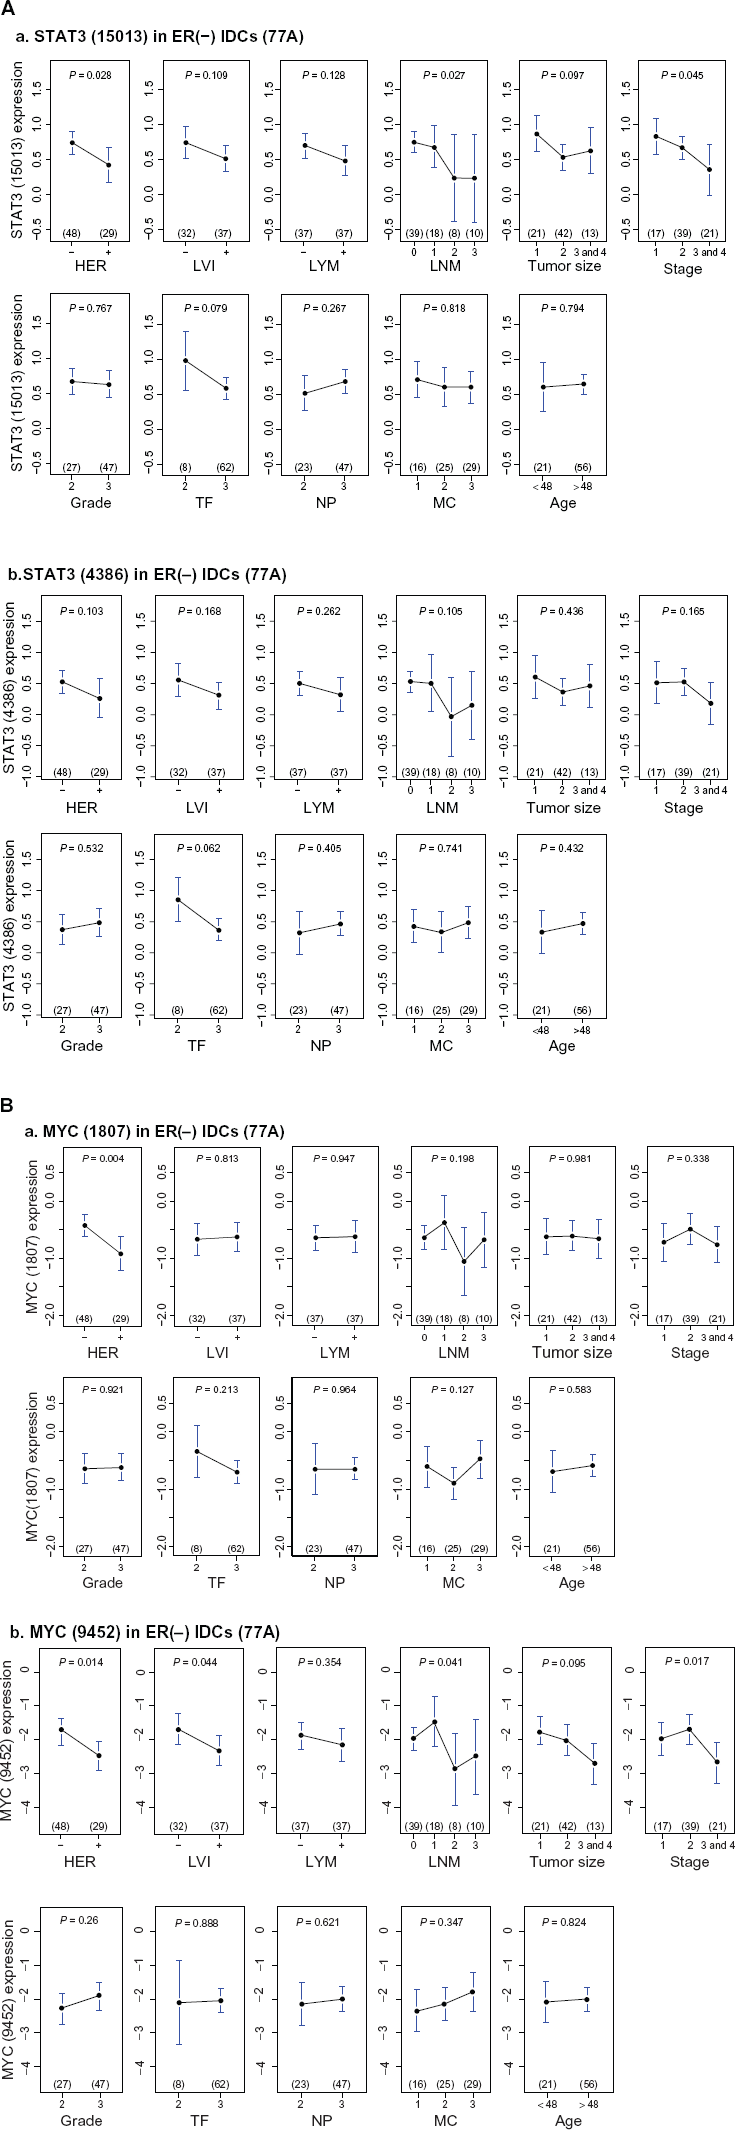
Upper panel, univariate analyses of

Examples of ERBB2 status determined by results of both CISH (left side picture) and IHC (right side picture) in (
Hunting for malignant phenotypes indicated in STAT3 network in relation to multiple steps of tumorigenesis
We reasoned that
Firstly, we tested TN enriched
In addition, we observed genes involved in epithelial mesenchymal transition (EMT) and Warburg effect to be in an overlapped network of

Functional analyses on

Heatmaps for subnetworks of

Further evaluation on two novel gene sets predicted to be involved in tumor angiogenesis and mitotic count promotion, respectively. Two heatmaps are displayed for subnetworks of
Four functional subnetworks to be present in biochemical and/or malignant phenotypes enriched in TN
In this study, only five metaplastic carcinoma of breast (MCBs) were available to be compared with two subtypes of ER(–) IDCs by their heatmaps although a large number samples will be needed for future validation. Five MCBs
16
are triple negatives (Table 2) and were included to test if
A metabolic transcriptome involving STAT3 network
Warburg effect in ER(–) IDCs was mainly due to
Phenotype like mesenchymal stem cells in tumor pathogenesis involving action of STAT3 network
Both
Other published data showed that
Increased tumor survival mechanism via sustained angiogenesis involving STAT3
We hypothesized a pathway for sustained angiogenesis, which is proved to be significant in the overlapped network of
The activation of PDGFRB signal transduction pathway has been documented
43
during lymphangiogenesis involving activity of
In the meantime, we observed from the heatmaps (Figs. 7A and S3.6) that the non-tumor part showed relatively low expressions of genes in PDGFRB signaling pathway, suggesting that it may slightly participate in
Based on the hypothesis shown in Figure 7B, we suspected that blocking the activities of
Tumor proliferative activities regulated by network of STAT3 and/or that of other TF(s)
Dynamic changes in expressions of a few candidate biomarkers are mediated by
Validation of major functional MYC & STAT3 subnetworks in TN and ERBB2+
The
We were able to validate those statistically predicted transcriptome within
Dynamical changes of network activities mediated by STAT3 and MYC enriched in TN
In reality, the transcriptional regulatory network approach is beyond the scale of individual TF alone but involving more interactions among TFs. We did identify four oncogenic activities—Warburg effect, EMT, cell proliferation and angiogenesis based on their gene profiles predicted to be driven by a few combined co-regulatory events among five major TFs—
This approach is promising because one of subnetwork activities—sustained angiogenesis was validated by angiosonograms (Figs. 7A–D). The annotated gene functions within the predicted subnetwork were linked to functional signal pathway profiling (Fig. 4F). Gene expression patterns within
Conclusion
Major findings based on network approach are: (1) The subtype enriched gene activities revealed due to both
Novel findings based on
Disclosures
Author(s) have provided signed confirmations to the publisher of their compliance with all applicable legal and ethical obligations in respect to declaration of conflicts of interest, funding, authorship and contributorship, and compliance with ethical requirements in respect to treatment of human and animal test subjects. If this article contains identifiable human subject(s) author(s) were required to supply signed patient consent prior to publication. Author(s) have confirmed that the published article is unique and not under consideration nor published by any other publication and that they have consent to reproduce any copyrighted material. The peer reviewers declared no conflicts of interest.
Footnotes
Abbreviations
Acknowledgements
The financial support of this work was mainly from grants (NSC95-2314-B-002-255-MY3 and NSC98-2314-B-002-093-MY2) (to Dr. Fon-Jou Hsieh). Both Dr. Shih-Ming Jung and Dr. Huang-Chun Lien did the scoring for both ERα and PR proteins in tumor sections of breast cancer specimens. We owe many thanks to the great assistance from the office of medical record (Cancer Registry, Medical Information Management Office, NTUH) for accessing medical records of those patients who agreed on providing their specimens for microarray study. We appreciate Miss. Fu-Chin Chen at NTUH providing the great assistance in gathering breast sonographic images for this study.
Supplementary Data
A combined PDF file has included the following contents except supplementary file 3 displayed below:
Table of content—a PDF file contains a brief description for supplementary files.
Supplementary file 1—a PDF file contains Tables S1.1–S1.7.
Supplementary file 2—a PDF file contains Tables S2.1–S2.9.
Supplementary file 4—a PDF file contains Table S4.1 and Figures S4.1–S4.4.
The following data (i.e. supplementary file 3) further interprets part of results in supplementary file 2. Here, we would like to illustrate that the same signal transduction pathway in different subtypes of breast cancer as well as non-tumor part has differential gene expression patterns due to a perturbed network driven by