
Abstract
Colorectal cancer (CRC) is one of the most common and lethal cancers. Although numerous studies have evaluated potential biomarkers for early diagnosis, current biomarkers have failed to reach an acceptable level of accuracy for distant metastasis. In this paper, we performed a gene set meta-analysis of in vitro microarray studies and combined the results from this study with previously published proteomic data to validate and suggest prognostic candidates for CRC metastasis. Two microarray data sets included found 21 significant genes. Of these significant genes, ALDOA, IL8 (CXCL8), and PARP4 had strong potential as prognostic candidates. LAMB2, MCM7, CXCL23A, SERPINA3, ABCA3, ALDH3A2, and POLR2I also have potential. Other candidates were more controversial, possibly because of the biologic heterogeneity of tumor cells, which is a major obstacle to predicting metastasis. In conclusion, we demonstrated a meta-analysis approach and successfully suggested ten biomarker candidates for future investigation.
Introduction
Colorectal cancer (CRC) is the third most common cancer worldwide and the fourth leading cause of cancer-related mortality and affects both genders equally. 1 It is also of interest to note the geographic differences in the incidence and survival rates among different regions around the world. 2 Currently, CRC is believed to be a disease that mainly occurs in developed countries. However, a sudden increase in the incidence of CRC with industrialization is becoming a major concern in developing countries.3,4
Although the prognosis of CRC patients depends on many factors, such as patient anthropometric and biochemical characteristics, therapeutic options, and personal care, early diagnosis is a key factor for reducing the overall mortality.5,6 For instance, when CRC patients are diagnosed early and treated appropriately, more than 90% of patients survive longer than 5 years. In contrast, the survival rate dramatically decreases to 10% of patients with distant metastases before diagnosis. 5 Taking into consideration the need for novel biomarkers, numerous studies have been conducted to evaluate potential gene and protein biomarkers. However, current biomarkers in clinical use have failed to reach an acceptable sensitivity and specificity for appropriate disease diagnosis. 7 For other candidates, additional evidence from large, well-designed studies is needed before they can be used in clinical practice. 8 Moreover, a pressing need for finding, validating, and combining biomarkers for prognosis is undeniable. 9 From this perspective, microarray gene-based profiling technology has shown strong potential because of its capacity to provide substantial data in a short time, which eventually enhances the possibilities for discovering new candidate biomarkers. 10
It is worth noting that individual gene expression analysis does not provide adequate information for translating biological processes. 11 On the other hand, Gene set enrichment analysis (GSEA) is a powerful method that focuses on the gene groups, which share common functions, instead of focusing on the correlation between the gene expression and a given phenotype. 12 However, the uncertain robustness in identifying gene expression profiles among the comparative groups and limitations of the GSEA method should be carefully considered. 13 Important methods for improving the data quality include increasing the sample size, using a better statistical analysis algorithm, integrating multi-omics platforms, performing dependent validation studies, and combining the results of several studies with similar experimental designs.14,15
In this study, we conducted a meta-analysis of available microarray data sets on human colorectal cell lines using a generally applicable gene set enrichment (GAGE) approach to detect gene candidates for metastatic cancer. GAGE was chosen because it expands the applicability of gene set analysis in several aspects and overcomes the limitations of GSEA.16,17 Ten, we validated the consistency of the gene expression results and combined the findings of this study with the previously published results from a proteogenomic analysis on three different cell lines. 18 The results of this study demonstrate the importance of combining and crosschecking the results from different studies because a single study or platform alone does not provide adequate reliability. 19 Finally, we suggested a list of potential biomarker candidates for future investigation.
Methods
Microarray analysis
Data collection
Figure 1 shows the workflow of the data collection. In short, we retrieved microarray data from the Gene Expression Omnibus (GEO, www.ncbi.nlm.nih.gov/geo/) using “colorectal cancer” and “colon cancer” as search terms. From a total of 18,235 results, we used the DataSets option, which included 61 available data sets on CRC. Next, only data sets including human cell lines were considered based on the following criteria: (1) the study was conducted on human colorectal cell lines and (2) the study compared differentially expressed gene data in at least two cell lines that represent different aggressive properties. As a result, three data sets, namely, GSE1323, 20 GSE14733, 21 and GSE15102, 22 met the criteria. However, the GSE15102 data set contains only one sample for each comparative group, which is not suitable for data analysis. Eventually, two data sets (GSE1323 and GSE14773) were chosen for the next evaluation.

Data collection flowchart. Of 61 data sets, two data sets were included for further investigation.
Data preprocessing
The data sets from GSE1323 and GSE14773 were created based on the Affymetrix Human Genome U133A Array and Affymetrix Human Genome U133 Plus 2.0 Array, respectively. First, we applied a robust multi-array average algorithm using the affy package for background adjustment, normalization, and summarization of the data sets. 23
Because GSE14773 contains two comparisons of different cell lines, the ComBat method was used to remove the batch effect and combine the data a single data set. 24 Initially, the GSE14773 samples were clustered into two main branches for the cell lines (Fig. 2A). After applying the ComBat method to adjust the batch effect, the samples were regrouped according to their aggressive properties (Fig. 2B). Finally, according to the data sets provided by Fanayan et al. 18 , we extracted 2,476, 2,455, and 1,866 associated proteins/genes from LIM1215, LIM1899, and LIM2405, respectively. LIM1899 and LIM2405 represent the more aggressive cancer cell lines compared to LIM1215.

Adjusting for batch effects. Batch effects from different GSE14773 groups before (
Gene Set Analysis
Prior to data analysis, we converted gene labels to Entrez IDs by Database for Annotation, Visualization, and Integrated Discovery (DAVID).
25
The GAGE Bioconductor package was then used to perform gene set analysis.
17
Validation and selection of candidates
For validation, the leave-one-out cross-validation (LOOCV) method was used to obtain the accuracy of significant gene sets by using prediction analysis for microarrays (PAM), as previously described.
14
PAM uses “the nearest shrunken centroid clas-sification” method to predict the category of a sample with respect to its gene expression profile.26,27 We conducted the LOOCV for each data set. Iteratively, each sample in the data set was removed, and the remaining samples were utilized to develop a prediction model with PAM.
26
The model was then applied to predict the categorization of the removed sample. After selecting significant gene sets, we performed a global test using the globaltest R package for all individual genes of each gene set.
28
Each individual gene with a
The gene candidates were initially classified into the following three groups: (1) good candidates include all genes with compatibility between the expressed direction and PSC, (2) candidates include all genes with PSC = 0, and (3) controversial candidates include all genes with the opposite trend between the expressed direction and PSC. It is useful to emphasize that the controversial results might be due to the biologic heterogeneity of the tumor cell lines because this study combined different cell lines in the statistical analysis. 29
Results
Data characteristics
In this paper, we included two different microarray experiments, GSE1323 and GSE14773. GSE1323 contains the gene expression information for two cancer cell lines, SW480 and SW620. In detail, SW480 and SW620 represent primary tumor and lymph node metastasis, respectively. By using this model, changes in the gene expression in late progression could be properly analyzed. 20 Additionally, GSE14773 contains gene expression comparisons between HT29 colonospheres versus HT29 “parental controls” and SW480 SNAIL versus SW480 vector. CRC HT29 colonospheres strongly expressed CD44 and CD166, which exhibit more aggressive malignant properties. 30 In addition, CRC SW480 with SNAIL overexpression has epithelial–mesenchymal transition properties, which enhance invasion and chemoresistance. 31 Using meta-analysis to evaluate the gene expression changes in the aforementioned models may reveal potential gene candidates for cancer metastasis. Finally, two data sets (GSE1323 and GSE14773-combined) were included for GAGE.
Gene set analysis and validation
After using gene set analysis with the cutoff of

Venn diagram of the common gene sets between two data sets.

Candidate genes
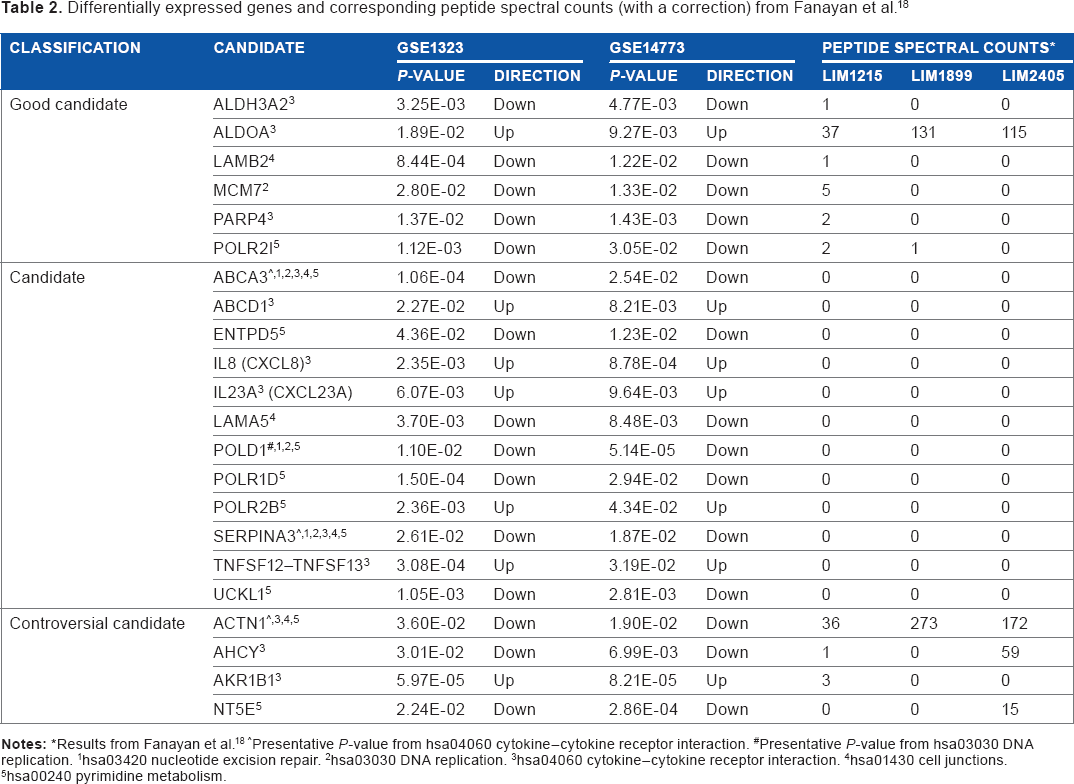
The significant genes from the microarray data sets and proteomic data set were combined to select potential candidates (Table 2). In addition to performing statistical analysis, we considered individual candidates along the line of action mechanisms for the corresponding gene sets in cancer cells.
Differentially expressed genes and corresponding peptide spectral counts (with a correction) from Fanayan et al. 18
results from Fanayan et al. 18
Presentative
Presentative
hsa03420 nucleotide excision repair.
hsa03030 DNA replication.
hsa04060 cytokine–cytokine receptor interaction.
hsa01430 cell junctions.
hsa00240 pyrimidine metabolism.
The nucleotide excision repair (NER) pathway plays an essential role in eliminating DNA lesions caused by carcinogens.
32
The mechanisms of action of NER are well established.
33
In a previous study, Berndt et al.
34
suggested that the genetic variations in this pathway might be associated with a higher risk of CRC. The gene expression of ABCA3, POLD1, and SERPINA3, all of which belong to NER pathway, satisfied
Initially, there were six genes, ALDH3A2, ALDOA, LAMB2, MCM7, PARP4, and POLR2I, belonging to the “good candidate” group. ALDOA was the only gene showing the “up” expressed direction. In addition, the PSCs of ALDOA were 3.5-fold and 3.1-fold higher in LIM1899 and LIM2405, respectively, than in LIM1215. ALDOA seems to be a reasonably good candidate based on the consistency in the expressed direction between two microarray data sets and the high protein expression level in LIM cell lines. In contrast, ALDH3A2, LAMB2, MCM7, PARP4, and POLR2I exhibited the “down” expressed direction. With the exception of POLR2I, the corresponding proteins in those genes were only expressed in the LIM1215 cell line.
Five genes were upregulated (ABCD1, IL8, IL23, POLR2B, and TNFSF12–TNFSF13) and seven genes were downregulated (ABCA3, ENTPD5, LAMA5, POLD1, POLR1D, SERPINA3, and UCKL1) in the “candidate” group. No corresponding proteins could be detected in the LIM cell lines. Among the significant genes, ABCA3 and SERPINA3 were downregulated in all five gene sets, while POLD1 was downregulated in three significant gene sets (hsa03420 nucleotide excision repair, hsa03030 DNA replication, and hsa00240 pyrimidine metabolism).
In the controversial candidate group, AKR1B1 was the only upregulated gene. In contrast, ACTN1, AHCY, and NT5E were downregulated. Although ACTN1 was downregulated in more aggressive cell lines in the microarray data, there was reversed protein expression, and the PSC values of more aggressive cancer cell lines (LIM1899 and LIM2405) were 7.6-fold and 4.7-fold higher than for the LIM1215 cell line, respectively. In case of AHCY and NT5E downregulated direction, their corresponding proteins, however, expressed just in LIM2405 cell line. The corresponding AKR1B1 protein could only be found in LIM1215, although it belonged to the upregulated group.
Discussion
Meta-analysis is an approach based on combining available data sets to increase the statistical power and produce an estimation of the effect in a pooled analysis.
41
According to Hung et al.
42
, the annual publication of meta-analyses has significantly increased since the 1990s. Although this approach was mainly applied in epidemiology and clinical medicine, several microarray-based gene expression meta-analysis studies have also been conducted.
14
In this paper, we integrated two
ALDH3A2, ALDOA, LAMB2, MCM7, PARP4, and POLR2I had strong potential as prognostic candidates in our statistical analysis. However, except for ALDH3A2 and POLR2I, the roles of other genes and their corresponding proteins in cancer metastasis were well recorded in the literature, with or without direct evidence in CRC. The ALDOA expression level was significantly upregulated in various highly metastatic cancers, including CRC.43,44 Down-regulation of LAMB2, an extracellular matrix glycoprotein, has been reported to correlate with the advanced stages of ovarian and prostate cancer.
45
MCM7 was downregulated in our study, which is inconsistent with previous reports on different cancer types. Liu et al.
46
and Zhong et al.
47
showed that high expression of MCM7 was associated with shorter survival of non-small-cell lung carcinoma and esophageal squamous cell carcinoma, respectively. We applied PROgene, a web application of gene expression-based survival analysis for multiple cancers, to evaluate the current evidence between MCM7 gene expression and survival.
48
The results were insignificant in 10 included data sets; the only significant result was poor overall survival in patients with MCM7 downregulation in the GSE16125 analysis (hazard ratio = 0.29,
Among the 12 members belonging to the candidate group (all PSCs = 0) in our analysis, some candidates have direct or indirect evidence of their behavior in previous studies. For example, IL8 (CXCL8) is an excellent prognostic candidate. In a recent meta-analysis evaluating the clinicopathologic features and diagnostic accuracy of IL8 in CRC, the authors suggested its potential in detecting and predicting the prognosis of CRC. 52 Several indirect pieces of evidence showed that high IL23 (CXCL23A, another CXC chemokine) expression might be a predictor of invasiveness in esophageal squamous cell carcinoma and cutaneous melanomas.53,54 Nevertheless, a preliminary study by Adamo et al. 55 showed no correlation between the IL23 concentration and CRC severity. Belonging to the serine protease inhibitor protein superfamily, SERPINA3 is a protease inhibitor involved in various inflammatory reactions and malignant tumors. 56 In a previous study, the SERPINA3 concentration was found to be significantly lower in CRC tissues than in normal tissues. 57 However, the authors found no significant difference in the SERPINA3 concentration among different CRC stages. Our gene expression data, on the other hand, showed a significant downregulation of gene expression in more aggressive cell lines. Interestingly, the SERPINA3 expression could not be detected in a proteomic evaluation of LIM1215, LIM1889, and LIM2405 cell lines. The opposite results demonstrate the need to further investigate SERPINA3 behavior, because it may be a potential diagnostic and prognostic candidate. ATP-binding cassette (ABC) transporters are involved in many important biological processes in humans. 58 Among our candidates, the ABCA3 gene was downregulated in more aggressive CRC cell lines. Decreased expression of ABCA3 might correlate with drug-resistant cell lines, as suggested for the A2780 ovarian cancer cell line. 59 However, the expression behaviors of ABCA3 require more validation.
Then again, there is lack of evidence for other candidates such as ACTN1, AHCY, AKR1B1, and NT5E, or the available evidence of these candidates showed reverse gene expression patterns compared to our meta-analysis. For example, NT5E was reported to be involved in CRC tumor invasion and metastasis, 60 and its corresponding protein showed increased expression in LIM2405 (more aggressive cell lines). However, microarray-based gene expression in our meta-analysis showed that NT5E gene expression was downregulated in the more aggressive cell lines. The disagreement may arise from the complicated biological processes of cancer, which are not fully understood. The current status requires further investigations regarding their potential as prognostic candidates.
Conclusion
Our study used a meta-analysis approach to better understand the gene expression behaviors of CRC cell lines with differing levels of aggressiveness. The gene set analysis, which considered the biological significance of gene expression, may provide a novel approach for identifying potential prognostic candidates for further validation.
Author Contributions
Conceived and designed the experiments: WJL, NPL, NTH, SJL, JHP, SWK. Analyzed the data: WJL, NPL. Wrote the first draft of the manuscript: NPL, WJL. Contributed to the writing of the manuscript: WJL, NPL, NTH, SJL, JHP, SWK. Agree with manuscript results and conclusions: WJL, NPL, NTH, SJL, JHP, SWK. Jointly developed the structure and arguments for the paper: WJL, NPL, NTH, SJL, JHP, SWK. Made critical revisions and approved final version: WJL, NPL, NTH, SJL, JHP, SWK. All authors reviewed and approved the final manuscript.