
Abstract
MicroRNAs (miRs) are small single-stranded noncoding RNA that function in RNA silencing and post-transcriptional regulation of gene expression. An increasing number of studies have shown that miRs play an important role in tumorigenesis, and understanding the regulatory mechanism of miRs in this gene regulatory network will help elucidate the complex biological processes at play during malignancy. Despite advances, determination of miR–target interactions (MTIs) and identification of functional modules composed of miRs and their specific targets remain a challenge. A large amount of data generated by high-throughput methods from various sources are available to investigate MTIs. The development of data-driven tools to harness these multi-dimensional data has resulted in significant progress over the past decade. In parallel, large-scale cancer genomic projects are allowing new insights into the commonalities and disparities of miR–target regulation across cancers. In the first half of this review, we explore methods for identification of pairwise MTIs, and in the second half, we explore computational tools for discovery of miR-regulatory modules in a cancer-specific and pan-cancer context. We highlight strengths and limitations of each of these tools as a practical guide for the computational biologists.
Introduction
MicroRNAs (miRs) are small, single-stranded, noncoding RNAs (~20–22 nucleotides) that regulate target gene expression by binding to complementary sites (seed sequences) in the messenger RNA (mRNA) target gene. 1 This interaction, mediated by the miR-induced silencing complex (miR-RISC), reduces the stability and translational rate of the mRNA target.2,3 These miRs are predicted to target one-third of all genes in the genome, where each miR is expected to target hundreds of transcripts.4,5 As the number of published miR sequences continues to increase with small RNA deep sequencing experiments, 6 the biological implications of miRs as modulators of post-transcriptional regulation expand. As of April 2016, there are 1,881 miR sequences in the human genome annotated in mirBase (http://www.mirbase.org), the primary miR sequence repository. However, the functions of only a subset of these miRs have been experimentally determined. To date, >300 cancer-related miRs and 829 target genes from >25 cancer tissues have been collected in OncomiRDB, a manually curated database of cancer-related miRs with direct experimental evidence. 7 As miRs mainly regulate function through their targets, elucidating the miR–target interactions (MTIs) is vital for functional characterization of miRs. Therefore, much progress has been made over the past decade to develop high-throughput experimental and computational methods for MTI identification.
Relevance of miR Biology to Cancer Studies
Recent studies have found that miR oncogenes (oncomiRs) and miR tumor suppressors tend to regulate tumor suppressors and oncogenes, respectively.8–11 Tumors that depend on over-expression of oncomiRs are said to demonstrate “oncomiR addiction,” 12 for example, mice overexpressing miR-21 were found to contract pre-B malignant lymphoid-like phenotype tumors, and inactivation of this oncomiR resulted in complete tumor regression. 13 Dysregulation of miR– gene networks has been shown to play an important role in tumor initiation and progression. 14 The dysregulation of miR expression in cancer can be attributed to (i) DNA point mutations, (ii) epigenetic mechanisms (eg, DNA methylation), (iii) alterations of chromosomes (eg, deletions or amplifications of miR genes), and (iv) changes in the machinery responsible for miR processing. 14
While global expression of miRs is usually repressed in cancer, 15 a pan-cancer co-regulated “superfamily” of upregulated oncomiRs co-targeting critical tumor suppressors has been identified. 11 Several miRs have been shown to inhibit metastasis through negative regulation of the epithelial–mesenchymal transition (EMT) and stemness pathways. 16 Yang et al. 17 found that miR-506 functioned as a potent EMT inhibitor in an orthotopic mouse model of ovarian cancer. Delivery of miR-506 via lipid-based nanoparticles to the tumor resulted in reduced tumor growth. Therapeutic inhibition of oncomiRs using antisense oligomers (called antimiRs) has also been shown to reduce tumor growth. 12 These recent studies have established the role for miRs as “druggable targets” with vast potential for anti-cancer therapies.
In addition to novel targets for cancer therapy, miR expression profiles have the potential to play an important role in the diagnosis and management of patients with cancer. Numerous studies in multiple cancer types found miR expression profiles that serve as diagnostic and prognostic biomarkers. MiRs detected in various bodily fluids have been found to originate from cancer cells secreting exosomal vesicles (exosomes). 18 High-quality miR samples have been extracted from a variety of sources, including plasma/serum, urine, and formalin-fixed, paraffin-embedded (FFPE) tissues. 19 MiR expression profiles from FFPEs have been shown to determine the tissue of origin from metastatic tumors.20,21 Remarkably, miRs remain largely intact in bodily fluids and FFPE tissues in contrast to most mRNAs.22,23 The resistance of miRs to degradation from RNases and severe conditions has been attributed to their small size, encapsulation by lipid vesicles (eg, exosomes or apoptotic bodies), and association with RNA binding proteins.24,25 Russo et al. 26 created a manually curated database of extracellular circulating miRs called miRandola (http://atlas.dmi.unict.it/mirandola/browse.php) containing 581 miRs from 21 types of samples. This website allows users to efficiently review the literature on circulating miRs that have been studied as biomarkers in cancer and various other diseases. For example, a recent study by Razzak et al. 27 found that expression profiling of three miRs (miR-21, miR-210, and miR-372) in sputum from patients with early stage non-small cell lung cancer (NSCLC) and cancer-free controls detected NSCLC with 67% sensitivity and 90% specificity. Upregulation of miR-21 in the biopsies of NSCLC lung tumors has also been associated with poor prognosis.28,29 Using a matched analysis of miR and gene expression from cancer tissue samples, a number of studies have identified cancer subtype-specific miR-regulatory networks that serve as network biomarkers for colorectal and breast cancers.30–33
Framework for Elucidating MiR-Regulatory Modules from Multi-Dimensional Omics Data
The rapidly increasing availability of transcriptome-wide matched miR and gene expression data via microarray and more recently RNA-sequencing technologies has greatly expanded our understanding of miR–gene regulation and interactions. The interactions between miRs and their target genes form networks, which much like gene–gene interaction (GGI) networks, are understood to consist of modules in which co-expressed miRs have a greater tendency to be functionally associated with miRs within the same module than to those outside the module.34–36 Groups of miRs coordinately regulate sets of targets forming miR-regulatory modules (MRMs), which function to control different biological processes.37,38 Recent studies have found that the modular organization and co-expression of miRs are dysregulated in cancer.35,39 However, the targets of most miRs remain unknown and the complex regulatory mechanisms of MRM are an open area of research.
Integration of multiple types of molecular data in a simultaneous analysis, termed multi- or meta-dimensional analysis, 40 is fundamental for discovery of MRMs. Multi-dimensional analysis is broadly classified into three categories40,41: (i) concatenation based (or early integration), (ii) model based (or late or decision integration), and (iii) transformation based (or intermediate integration); the schema is depicted in Figure 1. Concatenation-based (or early) integration combines multiple pre-processed molecular data matrices into one larger data matrix before constructing a model. Early integration requires an appropriate method to combine the different data types into one model. This task is often challenging, given that different data types often have differing properties and scales. 42 Taskesen et al. 43 found that gene expression and DNA-methylation profiles combined in an early integration strategy improved prediction of leukemia subtypes versus analysis of datasets individually. In model-based integration, the models are generated from each of the different data types and fused into a final model. For example, Kim et al. 44 developed an integrative method that combined variables from models derived from each genomic data type to generate a final model to predict survival in ovarian cancer.

Simultaneous integration of multiple data types: classification of approaches into three categories. (
Transformation-based (or intermediate or partial) integration combines multiple data types after transforming each type into an intermediate form, such as a graph or matrix, before generating a model. 40 The advantage of transformation-based integration over early integration is that when each type of data is transformed into an appropriate intermediate form, the data type-specific properties of each dataset are preserved without information loss. 45 The transformation-based integration strategy is most frequently applied for identification of MTIs and MRM.42,46 Typically, miR–gene correlation matrix and sequence-based target prediction scores are integrated by transformation into binary matrices or bipartite graphs (discussed in the “Methods for inferring MRMs in a single cancer-type via network approaches” and “Methods for inferring pan-cancer MTIs and MRMs via joint analysis of sample data” sections).42,47,48 An alternative integration strategy developed by Zhang et al. 49 used a joint matrix factorization technique to project multiple data types onto a common coordinate system to detect profiles that are highly (anti-) correlated (discussed in the “Methods for inferring MRMs in a single cancer-type via network approaches” section).
Integration of miR and gene expression data with sequence-based target prediction has been shown to improve prediction of MTIs.50–52 Integration of other high-throughput molecular layers, including methylomic and proteomic data, can also improve MRM discovery.49,53,54 Over the past decade, there has been a tremendous increase in the amount of publically available genomic, transcriptomic, methylomic, proteomic, and clinical data for many types of cancer. 55 This has provided a major opportunity for researchers to study genetic and molecular abnormalities across human cancer types to discover pan-cancer commonalities as well as cancer (sub)type-specific features. The Cancer Genome Atlas (TCGA) project, 56 a large systematic cancer genomics project, provides clinical, transcriptomic, and genomic data for >33 cancer types and subtypes. Initiated in 2006, TCGA has currently characterized tissues from matched tumor and healthy tissues from 11,000 patients, making it an invaluable resource for multi-dimensional omics projects. The rapidly increasing abundance of multi-dimensional omics data has been met with novel computational methods, providing significant advances in our understanding of genomic and epigenetic drivers of cancer. More specifically, the TCGA project has allowed researchers to develop new approaches to identify both cancer (sub)type-specific and pan-cancer MRM. However, discovery of MRM presents a number of challenges and potential pitfalls to the computational biologists. In the following sections, we highlight research progress that has addressed these challenges to identify MTIs and MRMs in cancer datasets.
Recent reviews of integration of multiple omic data40,45,57 and integrative analysis of cancer data58–60 are available and are outside the scope of this review article. While transcription factors (TFs) and miRs can jointly regulate target expression in MRM in the form of feed-forward and feedback loops, 61 the involvement of TFs in MRM networks is also beyond the scope of this review. In the next section, we provide a brief overview of sequence-based target prediction algorithms and recent high-throughput experimental target identification methods.
Mir–Target Interactions
Overview of Sequence-Based Target Prediction and Recent High-Throughput Experimental Methods
Sequence-Based miR–Target Prediction.
A number of bioinformatics algorithms for predicting miR recognition sites within transcripts have been developed using knowledge from experimentally validated target sites. Early experimental studies found that a primary determinant of target specificity was perfect complementarity (canonical site) at the 5′ end of the miR “seed region” at positions 2–7.1,2,62 Therefore, these algorithms initially were primarily focused on sequence complementarity between the seed region of miR and the 3′ untranslated region (UTR) of the putative target.62,63 However, given the large number of randomly occurring six nucleotide sequences in a 3′ UTR of a gene, perfect seed match itself is a poor predictor of miR regulation.64–66
Several studies have proposed that target sites in which the pairing between miR seed and mRNA does not completely match (termed non-canonical sites) also confer regulatory effect.67,68 A recent study by Agarwal et al. 69 found that while miRs bind to non-canonical sites, there was no detectable repression based on mRNA stability or translation using multiple cell types. This finding has supported the focus on canonical binding sites by sequence-based target prediction programs. Other algorithms consider additional data, including mRNA secondary structure and target accessibility70,71; however, this also results in a large number of predictions with many false positives (FPs). 2 Many algorithms, including TargetScan 69 and TargetRank, 62 use evolutionary conservation of the target site to select predicted targets based on conservation to reduce FP predictions. However, approximately 20% of functional target sites are not conserved between mammals, and conservation is further decreased in a step-wise manner in larger taxonomic groups, 72 indicating that sensitivity of target prediction decreases with higher conservation thresholds. 65
The growing number of experimental MTI data has prompted more recent use of machine learning (ML) algorithms to train classifiers directly on the experimental data. For example, miRSVR exploits mRNA expression data from miR transfection experiments to train an ML algorithm to predict MTIs. 64 The miRSVR scoring model for predicted MTIs is calibrated to correspond linearly with the probability of downregulation of the target, providing a meaningful guide for selecting a score cutoff. Agarwal et al. 69 recently compared 17 sequence-based target prediction algorithms and found that the number of potential MTIs varied greatly, reflecting the varied strategies of these algorithms. Their analysis found that TargetScan version 7 performed significantly better than the existing models and was as good as recent high-throughput experimental approaches to identify effective target sites. Table 1 summarizes the target prediction algorithms discussed earlier. Sequence-based miR target prediction algorithms have been comprehensively reviewed elsewhere. 73
List of software, websites, and references to methods for sequence-based miR target prediction and method for inferring miR–target relationships using paired expression profiles of miRs and genes in single-cancer datasets.

High-Throughput Experimental Methods for miR–Target Identification.
High-quality experimentally derived training data are generally required to improve sequence-based target prediction performance. 74 High-throughput methods such as those employing crosslinking and immunoprecipitation (CLIP) are an important class of capture-based methods for detection of direct miR–target binding events associated with the Argonaute protein (Ago).75,76 Argonaute high-throughput sequencing of RNAs isolated by CLIP simultaneously sequences Ago-miR and Ago-mRNA binding sites to identify interaction sites between miR–target pairs. 76 One limitation of this approach is that miR–target complexes are dissociated prior to sequencing, requiring the target sequence in each miR–target pair to be inferred computationally, which is prone to error.
Recently a method for producing ligation of the miR–target pair called crosslinking, ligation, and sequencing of hybrids (CLASH) has shown to be more robust than CLIP for identification of miR target sites.
67
The former method is similar to CLIP, but adds a ligation step between the miR and target, allowing direct characterization of the chimeric or hybrid miR–target to unambiguously identify the miR bound at a specific target site. A novel finding from the CLASH analysis was the detection of strongly overrepresented motifs in the interaction sites of several miRNAs, suggesting that individual miRs systematically differ in their binding site modes. Although this likely affects the response of RISC to miR–target binding, it is unclear how it impacts
While CLASH holds much promise, at the present time, this method has a very low yield with only ~2% of the reads obtained in an experiment corresponding to miR–target chimeras. Thus, further improvements to CLASH will be needed before comprehensive mapping of MTIs will be possible. 77 As each cell line has a different miR expression profile, the cell line used in an experimental analysis will yield different sets of MTIs than other cell lines or disease conditions. For example, an miR with low expression in a cancer (sub)type profiled using CLASH may not be detected, whereas this miR may have high expression in another (sub) type of cancer. Therefore, studies have integrated knowledge of MTIs from one cell line or condition identified by CLIP and CLASH with miR and gene expression profiles from the cell line or condition of interest, yielding condition-specific MTIs. For example, StarBase, a database of 108 CLIP- and CLASH-based datasets from 37 studies, integrates TCGA pan-cancer expression data with CLIP-seq data to provide MTI pan-cancer predictions. 78 Recent comprehensive reviews of experimental target prediction methods are available elsewhere.75,77
While high-throughput experimental (
Methods for Inferring MtIs
The integration of matched miR and gene expression data with sequence-based target prediction has been shown to significantly improve the quality of the identified MTIs.50,80 While high-throughput measurement of miR and gene expression has become relatively straightforward, their joint integration for detecting high-confidence interacting miR–mRNA pairs is more challenging.80,82 A number of approaches have been used to quantify the statistical significance for association between an miR and its target using their expression measurements. These approaches include correlation and mutual information-based methods, 47 multiple linear regression (MLR) models, 17 partial least squares (PLS) regression, 83 and regularized least-squares regression models. 52 A PLS model extracts coefficients (miRs) that explain the maximum variance in the dependent variable (gene expression) by ensuring good fit of the model. 80 A regularized least-squares model also ensures good model fit and adds an extra term to prevent model overfitting (discussed in the “Regularized least squares” section). GenMiR++, the first developed target prediction algorithm that integrated miR and gene expression data with sequence-based target predictions, applies a Bayesian inference to score potential targets. 51 In the following section, we survey the major classes of statistical approaches for MTI detection in paired miR and gene expression data from cancer samples.
Correlation Coefficient-Based Methods.
The principle of assuming that the expression levels of miRs and target mRNAs are negatively correlated is commonly used to detect MTIs.47,48,84 These methods typically select potential miR–target pairs that (i) are negatively correlated above some statistical significance threshold and (ii) have been identified to interact using sequence-based target prediction or experimental methods (Fig. 2). The large number of miR–target correlations calculated necessitates estimation of the false discovery rate (FDR), defined as the number of FP divided by the number of FP and true positives (TPs). Peng et al.
47
proposed a permutation-based method to estimate the FDR of miR–target correlations at a given statistical threshold (Fig. 3A). The FDR was defined as the ratio of the number of correlated miR–mRNA pairs above a given threshold (eg, Pearson's

Inferring MTIs by integrating match miR–gene expression profiles and sequence-based target prediction data. Sequence predicted targets from a pre-selected database (orange matrix) depicted as a binary matrix (indicating the presence or absence of miR–target pairs, as dark orange or light orange boxes, respectively). Expression profiles from matched gene (green matrix) and miR (red matrix) microarrays are correlated using the PCC and input into the purple matrix. MTIs with PCC above a selected threshold and present in the sequence-based target prediction database are indicated as dark purple boxes, while all other pairs as light purple boxes.
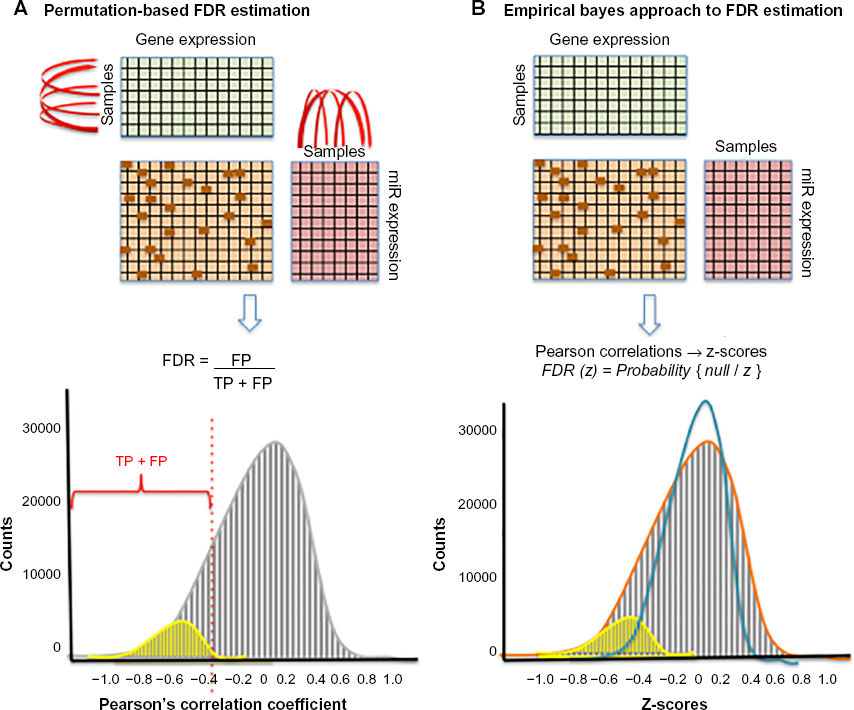
Methods for estimation of FDR from MTI data. (
For miR and gene expression profiles from heterogeneous conditions such as multiple (sub)types of cancer samples or cancer and healthy controls, correlations are often calculated for each condition separately rather than over the data as a whole.81,85,86 The rationale for this approach is that each cancer type may have differences in dysregulation of MTIs. Farazi et al. 81 found significant differences in the medians of the correlation distributions for miRs and their predicted targets comparing between three subtypes of breast cancer. They also detected distinct correlations between the expression of specific miR families and their predicted targets among the three cancer subtypes, providing a rationale for performing separate MTI analysis based on the subtype. Importantly, the top-ranked miRs according to regulatory activity did not necessarily overlap with the top-ranked miRs according to association with tumor subphenotype. This disconnection becomes especially relevant for validation and development of future miR-based therapies.
MLR and Regularized Least-Squares Models.
MLR models. Whereas correlation-based approaches consider only the pairwise miR–gene expression, MLR models gene expression by a linear combination of all miR expression profiles targeting the gene. Furthermore, other epigenetic or genomic factors can also be modeled such that gene expression is the response (dependent) variable and the transcriptional and epigenetic regulators are the independent variables in the models (Fig. 4). Integrating gene expression with associated alterations in genomic, epigenetic, and miR expression has been undertaken in several studies to identify molecular drivers of cancer (sub) types. Yang et al. 17 applied an MLR model to analyze gene expression of each gene in a mesenchymal signature of ovarian cancer. The putative regulatory factors of each gene selected for analysis were the associated DNA copy number abnormalities (CNA), promoter methylation (PM), and miR expression level, which were used as independent variables in the regression model. Based on this analysis, the investigators detected a set of 219 genes predicted to be targeted by 19 miRs in an miR–mRNA network. These genes could be used to distinguish the mesenchymal subgroup of ovarian cancer from other ovarian cancer subtypes.
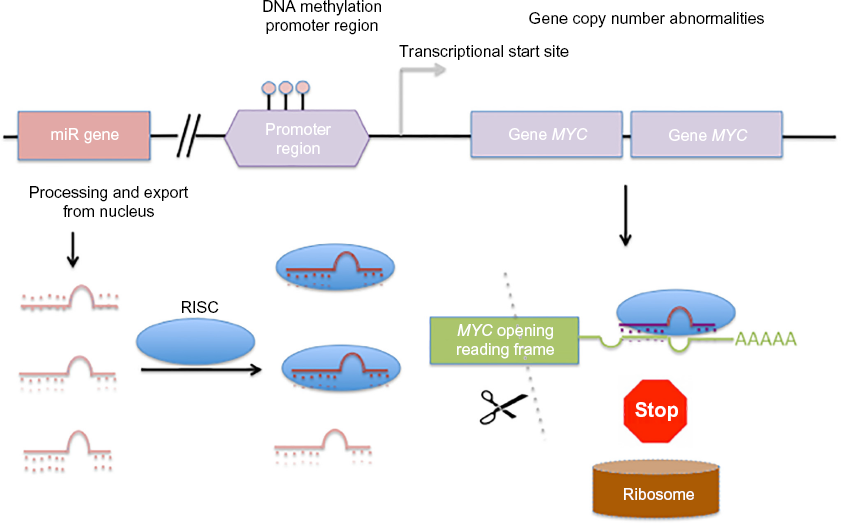
Factors controlling gene expression in cancer. The expression of the oncogene
Regularized Least Squares.
Least absolute shrinkage and selection operator. The least absolute shrinkage and selection operator (LASSO) algorithm performs variable selection procedure by estimating linear regression coefficients through L1-constrained least squares. This L1 constraint (penalty) tends to result in regression coefficients that are exactly zero, thereby imposing sparsity on feature selection, making the models more interpretable. Several investigators have argued that LASSO avoids overfitting in the presence of noisy expression data and a large number of explanatory variables, leading to better prediction accuracy.53,87 Li et al. 54 found LASSO with negative coefficient constraint as the best performing method for the joint analysis of miR and mRNA expression data compared to Pearson's correlation-based methods and Genmir++ (a Bayesian learning method to infer the probabilities of targets) 51 using a database of experimentally verified MTIs as a reference.
MLR with Elastic Net Penalty.
While LASSO models multiple potentially competing miRs, 52 several investigators82,86 have noted that it fails to account for co-expression between miRs targeting the same gene. The sparse solution (L1 penalty) implemented in LASSO selects one representative miR from each correlated group of miRs, disregarding other potentially biologically relevant co-expressed miRs within the group. In contrast, the ridge regression model maintains predictors in the model by using an L2 penalty in which the coefficients are small but non-zero. However, this approach does not facilitate feature selection. The elastic net penalty overcomes the drawbacks of LASSO and ridge regression by combining L1 and L2 penalties in order to account for co-expression among miRs while simultaneously performing feature selection. Compared to Pearson's correlation and LASSO, elastic net regression in combination with negativity constraint coefficients was applied to a head and neck cancer dataset and was found to identify MTIs with greater enrichment for experimentally validated MTIs. 82
Ensemble of Computational Methods.
Le et al.
88
investigated the performance of eight methods for joint analysis of miR–target expression and prediction methods using datasets from multiple cancer types. The computational methods compared were (i) Pearson's correlation coefficient, (ii) MIC (maximal information coefficient, a mutual information based method to detect linear and non-linear associations between two variables),
89
(iii)
An ensemble of three methods (Pearson, IDA, and LASSO) obtained more targets than any single method and identified targets with enhanced functional enrichment. From this, we can infer that different classes of computational methods tend to identify unique sets of validated targets and therefore each has its own merits. 91 It is important to note that this analysis did not incorporate sequence-based target predictions. Thus, the investigators hypothesized that the poor performance by GenMiR++ and ProMISe, two methods originally designed to incorporate sequence-based predicted targets, may have been due to the use of miR and gene expression data alone. Le et al. 93 provided a software pipeline integrating the above computational methods in the R package miRLAB that is freely available on Bioconductor at http://bioconductor.org/packages/miRLAB/.
The statistical approaches described in this section quantify the association between any given single miR and single gene (refer “Correlation coefficient-based methods” section) or associations between multiple (co-expressed) miRs and a single gene (refer “MLR and regularized least-squares models” section). These approaches are summarized in Table 1. In the next section, we explore methods for identifying associations between co-expressed miRs and groups of gene targets in a network of “many-to-many” miRs and genes termed an MRM. As is discussed in the following, a greater understanding of the (patho)biological roles of miRs and their targets can be gained by identifying MRM compared to single MTI analysis.
Mir-Regulatory Modules
Methods for Inferring MRMs in a Single-Cancer Type Via Network Approaches
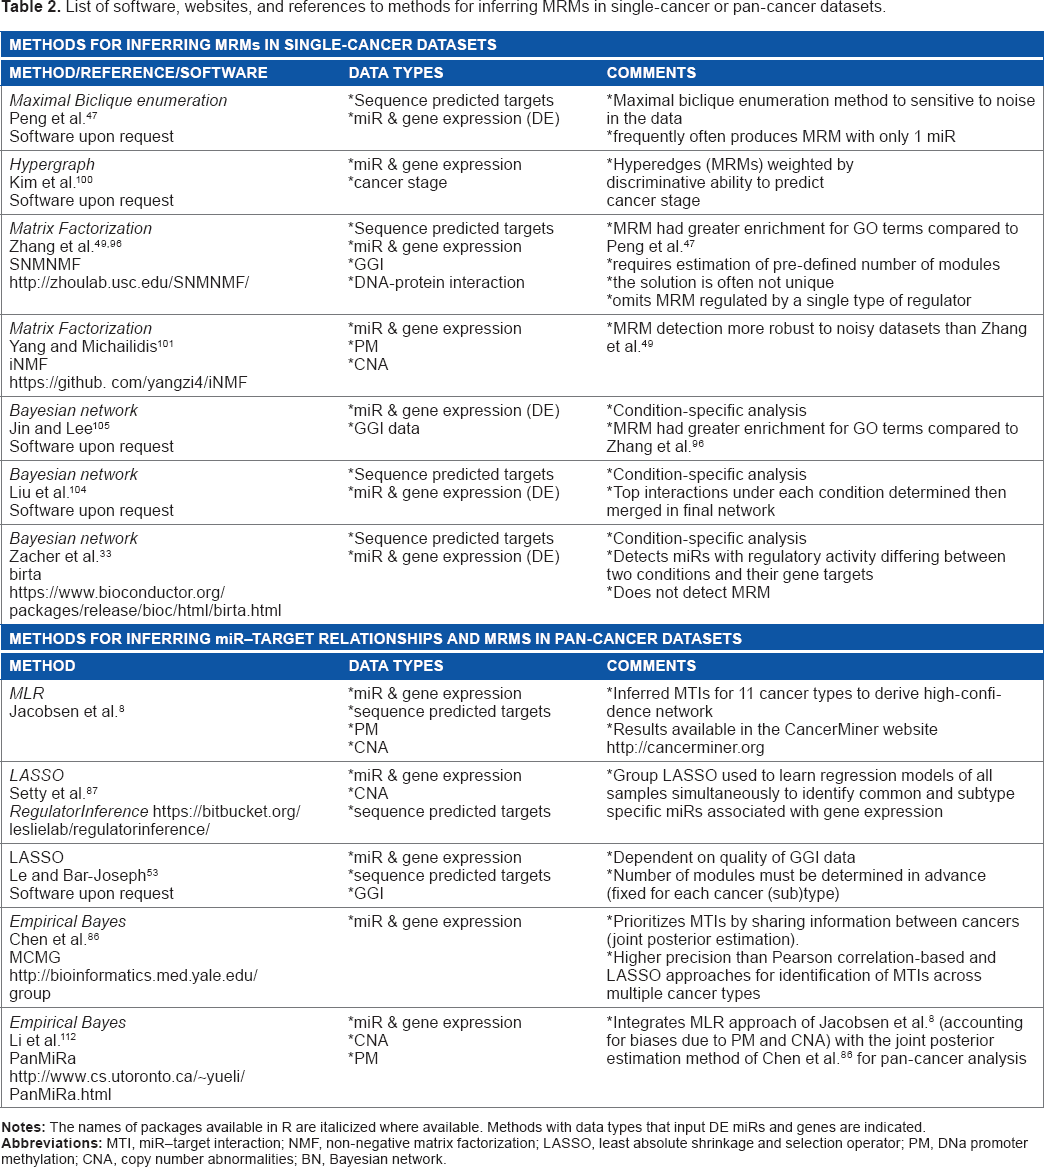
A number of methods have been developed to study MRM. Most approaches aim to identify groups of co-expressed miRs and their inversely expressed targets by integrating paired miR and gene expression profiles with sequence-based predicted MTIs. The methods discussed in this section implement analysis of a single condition (eg, cancer type versus some reference). Here, we discuss three distinct learning frameworks to elucidate MRM: biclique enumeration, matrix factorization, and Bayesian networks (BNs). The methods that have been designed for analysis of more than two conditions (eg, pan-cancer analysis) are discussed in the “Methods for inferring pan-cancer MTIs and MRMs via joint analysis of sample data” section. The methods for inferring MRM in cancer and pan-cancer datasets are summarized in Table 2.
List of software, websites, and references to methods for inferring MRMs in single-cancer or pan-cancer datasets.
Bipartite Graphs and Biclique Enumeration Approach.
A bipartite graph (network) consists of two sets of nodes (in this case, miR and target) and a set of edges connecting the nodes (in this case, edges represent association strength between miR and target). 36 A putative module (in this case, MRM) in the bipartite network has been postulated to correspond to a biclique, a special type of bipartite network where every node in the first set (miRs) is connected to every node in the second set (target genes). 47 A biclique is called a maximal (complete) biclique if it is not contained in a larger biclique. To perform enumeration of the maximal bipartite cliques (EBC) within the bipartite network representing putative MRMs, the module input consensus algorithm (MICA), 94 the most efficient algorithm for finding bicliques, is often used. 47 Zhang et al. 95 argued that MICA is designed for general graphs and unable to take advantage of the bipartite structure. Therefore, the investigators developed the maximal biclique enumeration algorithm, which outperformed MICA. 95
Peng et al. 47 developed one of the earliest approaches to identify MRM using a maximal biclique method on MTIs discovered in a multi-step approach. In the first step, pairwise Pearson's correlation between the differentially expressed (DE) miRs and genes across all samples was preformed to identify putative MTIs. The MTIs were selected if they exceeded a predefined FDR threshold (discussed in the “Correlation coefficient-based methods” section). Then the MTIs were further selected if present in a set of sequence-based target predictions, resulting in a binary matrix of MTIs. This matrix of selected MTIs was graphically represented as a bipartite network. Using MICA, maximal bicliques (ie, putative MRMs) were identified, which comprised between one and three miRs per MRM.
Maximal biclique-based methods to discover putative MRM have been argued to be too sensitive to noise in the data and frequently produce MRM with a high level of redundancy and only a single miR that cannot be used to explore miR combinatorial regulation.95,96 Missing subsets (false negatives) or erroneous (FP) MTIs may have an adverse effect on the quality of the maximal bicliques detected. Furthermore, searching only for maximal bicliques may be too restrictive as they are defined by an all-to-all relation between miRs and targets within the MRM. 97 To add flexibility to MRM detection, several studies98,99 have applied quasi-bicliques, which exhibit a most-to-most interaction between miRs and genes within the MRM (Fig. 5). 97 Quasi-bicliques allow all nodes in the bipartite network (miRs and genes) to accommodate missing interactions up to some user-determined level. Veksler-Lublinsky et al. 99 found that MRMs discovered using the quasi-biclique method more significantly identified MTIs than a maximal biclique approach.

Comparison of maximal biclique and quasi-biclique enumeration of bipartite graph for identification of MRMs. A matrix of miRs and genes (purple) indicating known MTIs (dark purple boxes) is represented as a bipartite graph with miRs shown as circles on the left (labeled 1–5) and genes shown on the right (labeled 1–8) in a) and b). MTIs are depicted with an edge (straight line) connecting the miR and gene. (
Kim et al. 100 have argued that the bi-relationships modeled between miRs and targets using bicliques are unsuitable for complex genetic interactions because information is lost. Instead, they applied hypergraphs to generalize the concept of an edge between nodes to a hyperedge by which more than two variables could be connected simultaneously. As the weight of a hyperedge reflects the strength of higher order dependency among variables, it was hypothesized that each hyperedge potentially behaves as a gene module. To model prostate cancer stage-specific MRM networks, the investigators developed a hypergraph model with each hyperedge represented by miR and gene expression for each cancer stage. Using a learning hypergraph model, hyperedges having high discriminative capacity between cancer stages were selected The investigators identified putative prostate cancer stage-specific MRMs; however, it is unclear whether the hypergraph structure improves MRM discovery over the maximal biclique approach utilized by Peng et al. 47
Matrix Factorization Approach.
An alternative strategy to the biclique approach was implemented by Zhang et al. 96 by integrating miR and target expression profiles using non-negative matrix factorization (NMF) to identify putative MRM. The NMF method decomposes a matrix to find two smaller (lower rank) non-negative matrices, allowing substructures to be readily identified within the data. This method is similar to principal component analysis, another unsupervised matrix decomposition technique, except that it employs a constraint of non-negativity instead of orthogonality. 101 Zhang et al. 96 extended the NMF method by simultaneously factoring two variable types (expression profiles for miRs and genes) into a common basis matrix and two lower rank matrices. The decomposed matrices were then used to identify MRM with each miR or gene permitted to be assigned to multiple MRMs. Sparsity was induced via L1 penalty, and they named their algorithm the sparse network-regularized multiple NMF (SNMNMF) technique. To guide the optimization process, the investigators incorporated sequence-based predicted target data and GGI using a semi-supervised learning framework to define constraints for MRM. Using a multiplicative interactive procedure, the model is learned until convergence to a local optimum.
Comparing NMF to EBC methods using the TCGA ovarian cancer data, only 19% of the modules identified by EBC were enriched for at least one gene ontology (GO) biological term compared to 53% of the modules identified by NMF, indicating that this method performed better than EBC. The limitations of the NMF approach include the requirement for a pre-defined number of modules in order to perform the matrix factorization (which may be difficult to estimate empirically), the solution is often not unique, and it does not enforce a negative correlation constraint. A negativity constraint is implemented by other MRM methods to account for the fact that since miRs mainly repress mRNA target expression levels, positively correlated MTIs are likely to be FP.3,82
An additional limitation of the conventional NMF method is that it only permits two types of genomic data (eg, miR and gene expression) to be analyzed. Therefore, Zhang et al. 49 implemented a joint NMF (jNMF) semi-supervised framework for the integrative analysis of more than two types of genomic data to identify groups of methylomic markers, miRs, and genes in putative modules in ovarian cancer datasets. Yang and Michailidis 101 have noted that the jNMF method is not different from NMF, and as a consequence, jNMF does not distinguish between different data sources in the integrative analysis, which can be problematic for analyzing heterogeneous data. Thus, the investigators developed an integrative NMF (iNMF) method that applied a novel tuning selection procedure that allows the model to adapt to the level of heterogeneity among the datasets. The iNMF method was found to be more robust to heterogeneous noise across the data sources than jNMF for the detection of true modules. These matrix factorization approaches exemplify transformation-based integration of multi-dimensional datatypes (refer “Framework for elucidating MiR-regulatory modules (MRM) from multi-dimensional omics data” section).
BN Models.
A BN is a graphical model based on probabilistic relationships among the measured variables, 102 which can be applied to miR and mRNA expression datasets to discover MRM.103,104 Inference of the BN structure (topology) involves searching among the possible networks and then scoring these structures. Two nodes are expected to be connected to each other if one node (ie, miR expression) affects another (eg, gene target expression). If the search space (number of potentially interacting variables) is not sufficiently restricted, the process of learning a BN can become very computationally time consuming, as all possible networks will be formed. 103 Therefore, most BN approaches rely on constraints to decrease the search space to provide a more compact representation of probability distributions. Prior information such as predicted target data can be incorporated to improve network construction.
After the topology of the BN is determined, the strength of the relationship between any two nodes is quantified using conditional probabilities (network parameters). Thus, the expression values (activities) of miRs and genes are represented as nodes, and the dependence between nodes (regulatory interactions) is represented by the edges within the network.
Jin and Lee 105 proposed a method to integrate miR–gene expression data with GGI data using the TCGA ovarian cancer dataset as an alternative to the NMF method developed by Zhang et al. 49 To constrain the search space, DE genes along with labeled samples were input into a biclustering algorithm. Clustering has been previously demonstrated to aid in the inference of BN by reducing the parameter space and avoiding highly correlated gene profiles from inhibiting interaction inference. 106 The interaction of sample and gene expression profiles was modeled as a bipartite graph and generated subgraphs, termed gene-sample modules (GSMs). Within each GSM, the expression trend was similar for most genes among the subset of selected samples.
Since previous studies have shown that not all the genes in cancer-related pathways undergo expression changes, the investigators expanded the GSMs using GGI data by including genes that are significantly correlated with at least one gene in a GSM. Next, to discover MRMs, a BN model was used to estimate dependencies between expression values of miRs and genes in the GSM using Bayes information criterion (BIC). The BIC is a score function used to assess the degree to which the BN explains the data (ie, whether it provides a “good” structure).
102
The search space is constrained to the miRs whose correlation coefficient values for genes in a given GSM are in the top
Liu et al. 104 were the first to model separate BN structures in two different conditions (eg, cancer and normal) in order to effectively identify both strong and subtle MTIs. For each condition, the BN learning was performed using the miR and gene expression as input, initially generating separate BN models for each condition. The BN learning iteratively evaluated the MTIs, removing MTIs from the initial structure using the expression data and retaining only high-confidence MTIs, with the goal of selecting the structure that best fits the data based on a scoring function. To avoid statistically insignificant results and overfitting with small sample sizes, a bootstrapping step (sampling with replacement) was added to achieve reliable inference and integration of the BN models from the two conditions. To significantly reduce the search space, the BN was assumed to have a bipartite graph topology, and sequence-based predicted targets were further used to constraint the initial network. Furthermore, miR and gene expression profiles were discretized into a binary status: “up” or “down” regulated. This condition known as “splitting” approach, initially used to generate separate models, was shown to capture complex MTIs from the cancer and control samples. Using datasets from epithelial and mesenchymal cell lines, their method named Bayesian networks splitting and averaging was found to identify more co-regulated targets by multiple miRs compared to conventional BN that did not separate the conditions. This example of intermediate integration 40 learned after combining the sample types was also found to result in improved performance over concatenation-based integration by Gevaert et al. 107 for integration of clinical and gene expression data.
Zacher et al. 33 formulated a BN integrating miR and gene expression to infer miR activities in a specific condition versus a reference condition (eg, controls). In their model, if the activity of certain miRs changes between conditions, a shift in the expression value of the targets is expected. For example, an miR is considered to be active in a condition if it is upregulated and its gene targets are downregulated compared to the reference condition. While TF-target activity can also be inferred using this approach, we will focus on the use of this application for miR–target discovery. The investigators applied a Bayesian linear regression, where the expression level of each gene in each condition was determined by a linear combination of miR activities. Then a score was used to rank the degree to which miRs explained the observed differential gene expression, where a score close to 1 indicates that the corresponding miR is essential (ie, high miR activity) for explaining the differential gene expression in the condition versus reference. The miR activity states are inferred using Markov Chain Monte Carlo sampling. The model swaps the activity states of any two miRs with opposite activity states sampled from the posterior distributions. To reduce the size of the potential network, the investigators (i) input only DE miRs and genes between the two conditions, (ii) limited MTIs to those present in experimental or sequence-based predicted MTIs datasets, and (iii) required that the target genes for two miRs exhibit a minimal overlapping similarity (ie, 0.8). While this method identifies miRs (and their targets) with condition-specific activity, it does not directly identify MRMs in contrast to the other BN methods described earlier.
The investigators applied their method to ovarian cancer data from TCGA. They separated patients into “early” or “late” relapse (>1 year) and discovered 12 miRs active in the “early” but not in the “late” relapse patients, with target genes of 11 of the 12 miRs directly associated with relapse-free survival times. This method named Bayesian influence of regulation of transcriptional activity is freely available through the R package birta on Bioconductor at https://www.bioconductor.org/packages/release/bioc/html/birta.html.
These BN methods represent examples of transformation-based (intermediate) integration.40,57 While the methods described earlier facilitate MTI or MRM discovery using datasets from a single-cancer type (or subtype), other recent works have investigated methods for inferring MTIs and MRMs across many types of cancers, which are discussed in the next section.
Methods for Inferring Pan-Cancer MTIs and MRMs Via Joint Analysis of Sample Data
The recent availability of miR and gene expression across multiple cancer types has spurred investigators to develop approaches to compare the similarities and differences of MTIs and MRMs across cancer types. Recurrent MTIs across cancer types are hypothesized to play important roles in tumorigenesis. 8 Pan-cancer analysis has identified convergent cancer subtypes composed of several distinct cancer types providing novel prognostic and therapeutic insights. 108 Joint analysis of multiple cancer types to infer pan-cancer MTIs and MRMs presents an additional set of challenges in comparison to single-cancer analysis. These challenges include systematic confounding biases owing to differences in study size, sample heterogeneity (eg, tumor purity), experimental platforms, differences in miR expression across cancers, and other technical factors. Thus, pan-cancer analysis requires robust algorithms to detect key features (MTIs) in the setting of noisy multi-dimensional datasets. While early efforts addressed these challenges by performing analysis of each cancer individually before combining these results, 8 more recent studies have developed probabilistic approaches to large-scale pan-cancer analysis as discussed in the following.
MLR and Regularized Least-Squares Models.
Multiple linear regression. Jacobsen et al. 8 analyzed associations between miR and gene expression for individual cancer types using an MLR model that was fit to the gene expression, taking into account biases due to copy number abnormalities (CNA) and PM at the gene locus (Fig. 6). The linear coefficients for each miR in the MLR model indicate the magnitude of association between the miR–target pairs for each cancer type, where the greater (negative) value of the coefficient infers greater miR activity on the target gene. This method more accurately evaluated miR–target expression association in the presence of CNA and PM abnormalities that influence gene expression. To evaluate the relative strength of association between given miR and gene in at least half of the cancer types while avoiding potential biases in cancer datasets (such as sample size), the authors developed a rank-based, statistic, association RECurrence (REC), under the null hypothesis that no association exists between the miR–target pair in any of the cancer types. Jacobsen et al. 8 applied a model-based (late integration) approach40,57 (refer “Framework for elucidating MiR-regulatory modules from multi-dimensional omics data” section) that applies an MLR model to each cancer type individually and combines the results (ranks) into a pan-cancer REC score.

MLR of mRNA expression in a single-cancer type to identify miR–mRNA associations. mRNA expression from each sample is modeled as the response variable (left), and miR expression, DNA copy number abnormalities (CNA), and level of PM are the independent variables. The MLR evaluates pairwise associations between mRNA
Using this approach, the investigators identified 143 miR–target pairs (40 miRs and 72 mRNA targets) having both strong negative REC score and exceeding sequence-based predicted target thresholds (using TargetScan and miRanda scores). The 40 miRs in the pan-cancer network were more likely to be dysregulated by genetic and epigenetic alterations – a common property of cancer driver genes – than 180 other miRs expressed across all cancer types. The results of this analysis are available in the CancerMiner website (http://cancerminer.org).
Regularized Regression (LASSO).
Setty et al. 87 applied a LASSO model using CNA, miR binding site counts in mRNA 3′ UTR, and TF binding site counts in the gene promoter as covariates to explain gene expression changes (tumor versus normal) from subtypes of glioblastoma multiforme. First, LASSO was applied on a sample-by-sample basis to identify key direct regulators (miR and TF) that account for DE genes in glioblastoma multiforme relative to normal brain samples. A second LASSO model used a multi-task learning framework (group LASSO) to learn regression models of all samples simultaneously. Multi-task learning seeks to perform individual tasks (eg, selecting MTIs in subtypes), while exploiting the relationships between several learning tasks to increase the power of the search, thereby improving model performance. Group LASSO, an extension of LASSO, was developed for multi-task learning to select a common subset of features among tasks. 109 For both LASSO models, Setty et al. 87 used a feature-scoring scheme to determine significant regulators for common and subtype-specific gene expression. This scoring scheme estimated increase in total residual error in the models when an miR was excluded in order to determine its degree of influence in predicting gene expression changes. Using this method, common and subtype-specific miR and TFs were identified. This software is available in the R package RegulatorInference (https://bitbucket.org/leslielab/regulatorinference/).
Le and Bar-Joseph
53
developed a probabilistic regression model called protein interaction-based miR modules (PIMiM) to discover MRMs in specific cancers (conditions) and across multiple cancers. The goal of this approach was to determine MRMs that explain gene expression as a function of the miR expression and the set of proteins the genes interact with. This module-based method assigned miRs and predicted targets to one of
PMiM was also found to detect MRMs with higher functional enrichment than the matrix factorization method by Zhang et al. 96 when PIMiM was applied to the ovarian cancer dataset from TCGA. The investigators also found that using the prior knowledge from GGI datasets greatly increased precision and recall of 115 miRs known to participate in ovarian cancer. A potential disadvantage of supervised MRM identification methods such as PMiM is that the MRMs identified naturally tend toward the reference (in this case, GGI data). Yang and Michaelidis 101 have argued that publically available GGI datasets are prone to accumulated errors and oversimplification, and therefore, supervised MRM methods depend on the accuracy of these databases. Indeed, a recent evaluation of Mirsynergy, 54 a LASSO and clustering-based MRM algorithm that is also dependent on GGI data, was found to produce module structures that were highly dependent on initial clustering of miRs and the GGI data. 110 Moreover, supervised methods are less likely to select new candidates based on the existing data and therefore are at a disadvantage for novel discovery. 101
To integrate multiple types of cancers, PMiM uses a group LASSO to regularize the models over multiple cancer (sub)types using an L1/L2 penalty to encourage miRs and genes to be assigned to the same modules across cancer types. One limitation of this approach is that the total number of modules must be determined in advance and is fixed for each cancer (sub)type. The group selection approaches implemented by Setty et al. 87 and Le and Bar-Joseph 53 are examples of model-based (late) integration methods (refer “Framework for elucidating MiR-regulatory modules from multidimensional omics data” section) in which different models are learned simultaneously across cancer types, increasing the power to detect pan-cancer MTIs compared to traditional approaches that integrate parameters after each cancer has been separately modeled.
Bayesian Models.
Chen et al. 86 demonstrated the advantage of joint analysis of multiple cancers using an EB method over a single-cancer analysis for identification of MTIs. The underlying goal of their method was to integrate MTI commonalities among cancers by explicitly borrowing information among the cancer types to increase the power of detecting TP and reducing FP MTIs, respectively. It was recognized that different cancer types have distinct sets of MTIs, and therefore, the investigators expected that only a fraction of the MTIs would be shared between cancers. Additionally, cancers that were more closely related (eg, ovarian and breast cancers) were expected to share a higher degree of common MTIs than distantly related cancers. Thus, similarity between two cancers was quantified by the fraction of shared MTIs.
In the first stage, Pearson's correlation coefficients (PCCs) for all miR–mRNA pairs were expressed as
In the next stage, the estimated similarity between cancers based on the fraction of shared MTIs was calculated. Then the estimated similarity among cancers and the estimated MTI probability in individual cancers (obtained from local FDR) were combined to derive the posterior marginal probability of MTIs between miR–target pairs. The prior probabilities that measure cancer similarity were estimated from the observed data using an iterative updating procedure. Unlike the local FDR approach for single-cancer analysis, the pan-cancer approach was shown to change the order of
Li and Zhang
112
developed a pan-cancer analysis method called pan-cancer miRNA–target associations (PanMiRa) that directly infers the posterior distribution of the pan-cancer MTIs and accounts for potential genomic confounders. Unlike the MCMG approach that predicts cancer-specific MTIs by borrowing information from other cancers, PanMiRa aims to infer recurrent MTIs across all cancers while taking into account biases due to CNA and PM. Similar to Jacobsen et al.
8
, PanMiRa applies an MLR model for individual cancers with gene expression as the response (dependent) variable and miR expression, CNA, and PM as the independent variables (Fig. 6). The coefficient in the MLR model for miR expression (denoting relationship between miR
Conclusion and Outlook
Dysregulation of miR activity is increasingly being recognized as a pivotal factor in the development and progression of cancer. Expression profiling of miRs within tumors and those secreted from tumors as circulating miRs detected in bodily fluids have great potential for diagnostic and prognostic biomarkers in many types of cancer. miRs possess several characteristics making them particularly advantageous as therapeutic targets. Their small size and resistance to degradation make delivery of miRs to the tumor site relatively achievable.
To detect miRs with therapeutic potential in cancer, the investigators have sought to identify these miRs acting as central drivers of cancer within miR-regulatory networks. These networks are composed of subsets of densely interconnected co-expressed miRs, and their overlapping targets are termed as MRM. As MRM are composed of many MTIs, MRM identification is dependent on the quality of the MTIs. Much progress has been made over the past decade in experimental high-throughput methods to detect MTIs, and this knowledge has served to improve in silico sequence-based target predictions. Integration of matched miR and gene expression profiles from cancer samples with in silico and/or experimental MTIs is instrumental for most MRM detection methods.
The general challenges for MRM detection are the complexity of the regulatory networks, the large number of FPs generated from computational analysis, and the frequently small sample sizes available. With massive multi-omic projects such as TCGA, the latter issue is abating within the cancer field. Furthermore, as our knowledge of miR biology and regulatory mechanisms continues to augment, it is expected that computational tools being developed or refined will reflect this biological reality. Our understanding of the complexities of post-transcriptional regulation by miR will continue to be refined. While mRNA destabilization has been found to be the dominant form of miR-mediated repression in endogenous genes, translational repression has been reported to be the major mode for reporter genes. Some investigators have identified miRs capable of repressing translation in one cellular context while inducing translation upregulation in another, 113 challenging basic assumptions regarding miR-regulatory roles. Moreover, advances in our understanding of miR–miR interactions as well as TF–miR interactions are currently being applied to develop increasingly sophisticated network analyses to reflect the complexity of post-transcriptional regulation.
In this review, we have highlighted major classes of statistical and computational approaches to identify MTIs and MRM in individual cancer and pan-cancer analyses. Future developments in the MRM tool are anticipated to improve integration of multiple heterogeneous omics datasets across multiple types of cancer types. Exploiting improved integration of these omic datasets and the information borrowed from many cancer types is expected to facilitate novel discovery and prioritization of MRM. Specifically, MRM that encompass the interplay between miRs and TFs for gene co-regulation will help to further elucidate the miR-regulatory mechanisms. Knowledge of these important regulatory layers will be vital for the development of effective therapeutic interventions in cancer and other challenging diseases.
Author Contributions
Wrote the first draft of the manuscript: CJ W. Contributed to the writing of the manuscript: PH, CCdS. Agree with manuscript results and conclusions: CJW, PH, JB, CCdS. Jointly developed the structure and arguments for the paper: CJW, PH. Made critical revisions and approved final version: CJW, JB, PH, CCdS. All authors reviewed and approved of the final manuscript.