
Abstract
RECK is downregulated in many tumors, and forced RECK expression in tumor cells often results in suppression of malignant phenotypes. Recent findings suggest that RECK is upregulated after epithelial–mesenchymal transition (EMT) in normal epithelium-derived cells but not in cancer cells. Since several microRNAs (miRs) are known to target RECK mRNA, we hypothesized that certain miR(s) may be involved in this suppression of RECK upregulation after EMT in cancer cells. To test this hypothesis, we used three approaches: (1) text mining to find miRs relevant to EMT in cancer cells, (2) predicting miR targets using four algorithms, and (3) comparing miR-seq data and RECK mRNA data using a novel non-parametric method. These approaches identified the miR-183-96-182 cluster as a strong candidate. We also looked for transcription factors and signaling molecules that may promote cancer EMT, miR-183-96-182 upregulation, and RECK downregulation. Here we describe our methods, findings, and a testable hypothesis on how RECK expression could be regulated in cancer cells after EMT.
Introduction
RECK is downregulated in many types of tumors. Forced expression of RECK inhibits tumor angiogenesis, invasion, metastasis, and/or proliferation, depending on the cell system.1–5 However, the molecular mechanisms of RECK down-regulation in tumor cells remain largely unknown.
The epithelial–mesenchymal transition (EMT) is a process by which epithelial cells lose their apicobasal polarity and cell-cell adhesion and gain migratory and invasive properties, resembling those of mesenchymal cells. EMT is essential for numerous developmental processes, including mesoderm formation and neural tube formation. EMT has also been shown to occur during wound healing, organ fibrosis, cancer invasion, and metastasis.6,7
Accumulating evidence indicates the involvement of a number of microRNAs (miRs) in the process of carcinogenesis, as well as cancer progression. 8 Based on their activities, cancer-associated miRs can be divided into two groups: oncomiRs and tumor suppressor miRs. A single miR may target multiple mRNAs, while one mRNA may be targeted by multiple miRs, providing a basis for an intricate network of gene regulation. Hence, bioinformatic analyses and evaluation of large sets of data and publications already accumulated in this field of studies should be a reasonable approach for deducing the cellular functions of miRs. For example, numerous papers on miRs relevant to EMT as well as miRs induced by various stimuli (such as hypoxia and growth factors) and targeting RECK mRNA have already been published (see below).
We previously found that TGFβ-induced EMT was accompanied by RECK upregulation in nontumorigenic epithelial cell lines (MCF10A and HMLE), but not in carcinoma-derived cell lines (MCF7 and A549). 9 RE CK overexpression did not affect the process of EMT but negatively regulated cell proliferation and migration. Although the exact mechanisms by which RECK expression is uncoupled from EMT in cancer cells remain to be elucidated, one obvious possibility is transcriptional repression of RECK gene in cancer cells. However, we found some discrepancy between the levels of RECK mRNA and RECK protein in cancer cells and, therefore, speculated whether some cancer-associated miRs might also play roles in this uncoupling. To address this question in this study, we first attempted to find candidate miRs using three approaches in silico: (1) text mining to extract miRs enriched in studies of cancer EMT, (2) prediction of miRs targeting RECK mRNA, and (3) analysis of TCGA breast cancer miR-seq and RECK mRNA data using a newly developed nonparametric correlation test. These approaches point to the involvement of the miR-183-96-182 cluster in the uncoupling of RECK expression from EMT in cancer cells. We also searched for candidate transcription factors involved in this event using ENCODE, transcription factor ChIP-seq data, ONCOMINE gene expression database, and expression datasets deposited in NCBI GEO. We propose a testable hypothesis based on these findings.
Methods
Collecting Relevant Abstracts from PubMed
The following sets of key words were used to collect relevant abstracts of original papers from PubMed: for EMT-associated miRs in noncancerous cells, (microRNA[Title/Abstract] OR miRNA[Title/Abstract] OR miR[Title/Abstract]) AND (EMT[Title/Abstract] OR “epithelial–mesenchymal transition”[Title/Abstract] OR “epithelial-to-mesenchymal”[Title/Abstract]) NOT (cancer[Title/Abstract] OR metastasis[Title/Abstract] OR carcinoma[Title/Abstract] OR sarcoma[Title/Abstract] OR tumor[Title/Abstract] OR “review”[Publication Type]) and for EMT-associated miRs in cancer, (microRNA[Title/Abstract] OR miRNA[Title/Abstract] OR miR[Title/Abstract]) AND (EMT[Title/Abstract] OR “epithelial–mesenchymal transition”[Title/Abstract] OR “epithelial-to-mesenchymal”[Title/Abstract]) AND (cancer[Title/Abstract] OR metastasis[Title/Abstract] OR carcinoma[Title/Abstract] OR sarcoma[Title/Abstract] OR tumor[Title/Abstract]) NOT “review”[Publication Type]. The search was performed on November 2, 2015. The abstracts were downloaded as.txt files.
Text Mining for miRs with Differences between Noncancerous and Cancer Cells
We used R package “pubmed.mineR” 10 to process the abstracts from PubMed. This provided a correspondence table “HGNCdata” that includes approved symbol, approved name, gene synonyms, and so on for genes, but not for miRs. Therefore, we acquired miRrelated information from the HUGO Gene Nomenclature Committee (HGNC) website. 11 In the abstracts, several alias/synonyms are used to describe the same miR. Thus, we first mapped the prefix “miR-”, “microRNA-”, “MicroRNA-”, “hsa-miR-”, and “mmu-miR-” to the same character “MIR”, converting the alias in the abstract to the approved symbol, according to HGNC. The converted abstracts were analyzed using pubmed.mineR; we first used the gene_atomization function to extract the miRs mentioned in the abstracts and then used the searchabsT function to count the abstracts that referred to each miR. For each miR referred, we calculated its proportion to all papers describing cancer EMT or noncancer EMT and tested the null hypothesis that the proportion in cancer EMT = proportion in noncancer EMT using two-tailed prop.test.
Prediction of miR Targets
We used four commonly used tools for predicting miRs: miRanda (August 2010 release),12,13 PicTar, 14 TargetScan,15–17 and MicroT-CDS (microT v4). 18 For miRanda, we used human target site predictions with good mirSVR score and conserved miR. PicTar predictions in vertebrates were used with the default setting to search for all miRs potentially targeting RECK, and to evaluate them based on the PicTar score. TargetScan was used with the default setting, and the Context score and PCT (probability of conserved targeting) were used to evaluate the probability of a miR to bind RECK 3'-UTR. For microT-CDS, we used the gene symbol “RECK”, gene ID “ENSG00000122707”, species “Homo sapiens”, and Ensembl version 69 from homologous genes. The results were evaluated using the miTG score.
Data Collection from TCGA
We acquired the breast invasive carcinoma dataset from the TCGA website 19 on May 3, 2013. From the total 905 breast cancer cases, we extracted 53 cases for which mRNA and miR data on both cancer tissues and matched normal breast tissues were available. In the TCGA project, mRNA expression data had been acquired using Agilent 244K Custom Gene Expression G4502A-07 platform (alias: AgilentG4502A_07). miR-seq data had been obtained using Illumina Genome Analyzer (alias: illuminaga) system or Illumina Hiseq (alias: illuminahiseq) system. For miR-seq analysis, we used the level 3 data (ie, expression calls for miRs per sample). In the case of mRNA, we used level 2 data (ie, normalized signals per probe) and averaged the expression calls of the probes that correspond to the same gene to obtain a single value for each gene. Agilent G4502A_07 contains five probes for RECK. From them, we chose to use two (A_23_P83028 and A_23_P83030) that were corresponding to the 3'-UTR of the full-length RECK transcript; the other three probes were ignored in this study, since they may also pick up smaller transcripts whose functions are presently unclear (Supplementary Fig. 1). To avoid division by zero in calculation, we assigned the uniform value of 0.1 to all cases in which the miR expression was undetectable.

Algorithm of paired data correlation (PDC) test.
The Paired data Correlation Test
To facilitate evaluation of the trends in expression changes, we developed a nonparametric method as follows: by setting appropriate cutoff values, the expression change between a pair of measurements was categorized into three groups (up, down, and no change) and labeled accordingly (1, -1, and 0, respectively). We call this label “Value of Change”. To compare the changes in two factors (eg, a miR vs. RECK mRNA), the absolute value of the difference between two Values of Changes was used for evaluation; we call this parameter “diff”. Thus, diff = 0 indicates two factors changing toward the same direction, diff = 1 indicates no change in one factor and up or down in the other, and diff = 2 indicates two factors changing toward the opposite directions. To evaluate the trends of changes in multiple pairs of data (eg, multiple patients), the sum of diff (termed “diff.sum” score) was used. In this case, a smaller diff.sum score indicates a trend of two factors changing toward the same direction, whereas a larger diff.sum score indicates a trend of two factors changing toward opposite directions. The P-value for each diff.sum score was calculated by simulation to evaluate how likely the diff.sum score can be obtained by chance. Specifically, we first got a vector containing 53 diff values for RECK mRNA and a 1046 x 53 matrix containing diff values for 1046 miRs in 53 patients. We then simulated a 1000 times larger matrix, 1,046,000 X 53, by randomly shuffling the position of patients in the original diff matrix for miRs, while keeping the RECK diff vector unchanged. Using the RECK diff vector and the simulated diff matrix for miRs, we obtained 1,046,000 diff.sum scores. Probabilities for each specific diff.sum were then calculated based on the distribution of the 1,046,000 diff.sum scores. The concept of this non-parametric correlation test for paired data, which we termed the paired data correlation (PDC) test, is illustrated in Figure 1. Based on the distribution of RECK mRNA and miRs in cancer and normal breast tissues, we chose cutoff values of 0.8 and 1.25 (±0.3219 in log2), respectively, for the downregulation and upregulation of RECK mRNA, respectively, and 0.5 and 2.0 (±1 in log2) for those of miRs.
Analysis of the miR-183-96-182 Promoter
UCSC Genome Browser on Human Feb. 2009 (GRCh37/hg19) Assembly 20 was used to search for possible transcription factors of the miR-183-96-182 cluster. Based on the tracks related to regulation (eg, Integrated Regulation from ENCODE Tracks) 21 and the position of transcription start site (TSS) of the miR-183-96-183 cluster, we decided to focus on the region up to 16 kb upstream of the miR-183 precursor. Transcription factors suggested to bind this region by the Transcription Factor ChIP-seq (161 factors) from ENCODE with Factorbook Motifs were extracted manually.
Survey of Gene Expression Profile Data
We screened gene expression profile data from knockdown, knockout, overexpression, or inhibitor treatment experiments relevant to candidate transcription factors. The NCBI GEO datasets that include information on miR-183-96-182 cluster were based mainly on three platforms, namely, Illumina HumanHT-12 V4.0 expression beadchip (GPL10558), Affymetrix Mouse Gene 1.0 ST Array (GPL6246), and Affymetrix Human Gene 1.0 ST Array (GPL6244). These data were acquired using R package “GEOquery”, 22 and the values for multiple probes corresponding to the same gene ID were averaged to obtain a representative value for each gene. For important candidates, we extended our search to other array-based platforms as well as RNA-seq data. We also used ONCOMINE 4.523 to find the trends in expression of candidate transcription factors for miR-183-96-182 in various cancers. The thresholds used were P-value = 0.001, fold change = 2, and gene rank = top 10%.
Results
Text Mining for Papers Describing miRs Involved in Cancer EMT and Noncancer EMT
To examine our hypothesis that miRs may play roles in uncoupling RECK expression from EMT in cancer, we first surveyed original papers in PubMed describing miRs involved in cancer EMT and noncancer EMT using the key word sets described in the “Methods” section. This literature search yielded 887 papers on cancer EMT and 145 papers on noncancer EMT. The most reported miRs in cancer EMT were members of the miR-200 family: miR-200c (121 papers), miR-200b (75 papers), and miR-200a (59 papers). The most reported miR in noncancer EMT was miR-21 (20 papers), which has also been associated with cancer EMT (53 papers). Some miRs have only been associated with cancer EMT. For example, miR-22 has been associated with cancer EMT in 25 papers, but never with noncancer EMT. In total, 40 miRs have been associated with cancer EMT in more than three papers but never with noncancer EMT (Supplementary Table 1), although the specificity of association was statistically significant only in a few cases (probably because of the paucity of noncancer studies). Representative miRs are shown in Table 1.
Number of original research papers describing miRs in the context of cancer and/or noncancer EMT.

Target Prediction Implicates miR-182 in Uncoupling of RECK Expression from EMT in Cancer
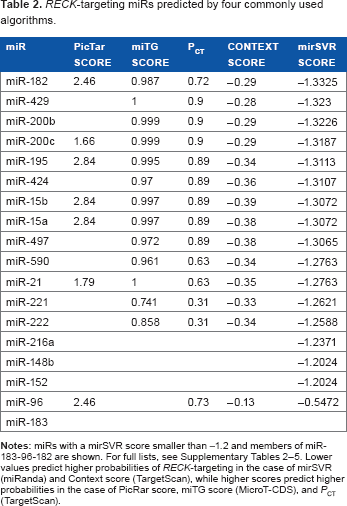
Second, we screened for miRs potentially targeting RECK mRNA using four algorithms as follows: miRanda, TargetScan, PicTar, and DIANA-microT. These algorithms evaluate the following features in different combinations and emphases: (1) base pairing pattern between a miR and a possible target, (2) thermodynamic stability of miR-mRNA hybrid, and (3) conservation of target sequences across related species. Despite the differences in their theoretical bases and computational procedures, 24 the results from these four algorithms showed considerable overlap. Among the 16 miRs with an mirSVR score (miRanda) less than -1.2, 6 miRs were also detected with the other algorithms (Table 2). Of note, miR-182 gave the top score with miRanda (mirSVR) and high scores with Pictar (PicTar score), TargetScan (Context score and PCT), and MicroT-CDS (miTG score; Table 2 and Supplementary Tables 2–5).
RECK-targeting miRs predicted by four commonly used algorithms.
Inverse Correlation between the Levels of miR-182 and RECK mRNA in Breast Cancer Tissues
Third, we looked for miRs that show differential expression between cancer and normal tissues with correlation to RECK mRNA expression levels. For this purpose, we chose to use TCGA breast cancer data in which both mRNA and miR data in cancer tissues as well as matched normal tissues were available (n = 53). As expected, highly significant downregulation of RECK mRNA in cancer tissues was observed (P = 0.000; Fig. 2A). When we chose the cutoff values of 0.8 and 1.25 for downregulation and upregulation, respectively, we found that RECK mRNA was downregulated in cancer tissue in 47 patients, upregulated in two patients, and unchanged in four patients (Fig. 2B).

PDC test for RECK mRNA and various miRs in paired TCGA breast cancer samples. (A) Expression of RECK mRNA in 53 pairs of cancer and matched normal tissues in TCGA breast cancer dataset. The boxes indicate the interquartile range (IQR) of data between 75% (Q3) and 25% (Q1). The bars below and above each box indicate the data in Q1 - 1.5 x IQR and Q3 + 1.5 x IQR, respectively. P-value was calculated by paired t-test. (B) Ratio (in log2) of the RECK mRNA levels between cancer and normal tissues from 53 breast cancer patients. Blue and red broken lines indicate the cutoff values for “Down” (0.8) and “Up” (1.25) groups, respectively. (C) Median of ratios (in log2) of the levels of miRs (1046 species) among 53 pairs of cancer and normal tissues. Blue and red broken lines indicate the cutoff values for “Down” (0.5) and “Up” (2.0) groups, respectively. (D) Distribution of diff.sum based on random shuffling of original miRs diff matrix and then generating a 1000 times larger simulated dataset (see “Methods” section for details). (E) Relationship between the levels (in log2) of RECK mRNA and various miRs. Top row: miRs with low diff.sum scores (positive correlation). Middle row: miRs with intermediate diff.sum scores. Bottom row: miRs with high diff.sum scores (inverse correlation). Red spots represent cancer samples and blue spots represent normal tissue samples. Gray line represents regression curve. P represents the cumulative probability obtained from the distribution showed in (D), and values sufficiently close to 0 or 1 both indicate a rare event. For more completed scatter between top miRs with low/high diff.sum scores and RECK mRNA, see Supplementary Figures 2 and 3.
In the case of miRs, distribution of the median of the ratio (cancer/normal) was roughly symmetrical around zero (in logarithmic scale). When cutoff values of 0.5 and 2 were chosen, 71 miRs were downregulated and 77 miRs were upregulated in cancer tissues (Fig. 2C). For a technical reason (to avoid division by zero), we assigned the expression value of 0.1 to all undetectable miRs. Therefore, the miRs undetectable in both cancer and normal tissues would give the ratio of 1. Among the 638 miRs that gave the ratio of 1 (0 in the log2 scale as shown in Fig. 2C), 279 miRs were undetectable in all samples.
Based on these classifications, we compared the changes in the expression of RECK mRNA and miRs between cancer tissues and matched normal tissues using a newly developed nonparametric correlation test, named the PDC test (see “Methods” section for detail; the distribution of diff.sum based on simulation is illustrated in Fig. 2D). Through this method, we obtained a list of 1046 miRs, whose expression is similarly or inversely correlated with that of RECK mRNA (Table 3; for full list, see Supplementary Table 6). In these tables, “diff.sum” score represents the extent of inverse correlation between the levels of the miR and RECK mRNA. In the present comparison of 53 pairs of data, diff.sum scores, by definition, range between 0 (perfect positive correlation) and 106 (perfect inverse correlation). The diff.sum scores for miR-139 (9) and miR-486-1 (13) are among the lowest in the list (Table 3, see also Fig. 2E), indicating that the changes in their expression are concordant to that of RECK mRNA in most cases. Interestingly, both miRs have been reported as tumor suppressors, and their expression has been shown to be inversely correlated with tumor proliferation or progression.25,26 On the other hand, the diff.sum scores for miR-96 (91) and miR-183 (95) are among the highest in the list, indicating their inverse correlation with RECK mRNA. miR-183, miR-96, and miR-182 are located in close proximity on human chromosome 7 and are expressed in a single primary transcript. 27 Indeed, miR-182 also shows a high diff.sum score (90). Of note, several well-studied miRs reported to exhibit oncogenic activities, such as miR-21, or those of bidirectional activities, such as the miR-200 family (miR- 200a, miR-200b, and miR-200c), are also among the high diff.sum score group (ie, inversely correlated with RECK mRNA).
miRs exhibiting positive or inverse correlation in expression with RECK mRNA among the matched breast cancer and normal breast tissues from 53 patients (TCGA data).

TEAD4 and SOX2 as Possible miR-183-96-182 Regulators
The above findings prompted us to focus on the miR-183–96–182 cluster. Besides its inverse correlation in expression with RECK (Table 3), two of its members (miR-182 and miR-96) have the potential to target RECK (Table 2) and at least four studies have been published for each member (15 papers in total) in the context of cancer EMT, but never in the context of noncancer EMT (Table 1).
The TSS of the miR-183-96-182 primary transcript has been predicted to be at 5207 bp upstream of the miR-183 precursor on human chromosome 7. 28 A region of 4 kb surrounding this TSS is rich in nucleosomes with H3K4Me3 and H3K27Ac modifications, both known to mark active transcription. ENCODE ChIP-seq data also indicate binding of many (∼70) transcription factors within the region of about 16 kb surrounding the TSS (Fig. 3A). A survey of gene expression databases indicated that several of these factors may affect the expression of RECK in various experimental settings. For instance, knockdown of TEAD4 resulted in elevated Reck expression in the mouse myogenic cell line C2C12 (GSE27845, Fig. 3B). Likewise, suppression of Ezh2 resulted in elevated Reck expression in high-grade glioma and preadi-pocytes (GSE63853 and GSE20054, respectively, Supplementary Fig. 5A and B). No miR-183-96-182 expression data are available from these experiments. Paradoxically, however, knockdown of EZH2 resulted in elevated expression of miR-183, miR-182, and miR-182* in the prostate cancer cell line DU145 (GSE26996, Supplementary Fig. 5C). No RECK expression data are available from this experiment.

Candidates for the transcription factors regulating the miR-183-96-182 cluster. (A) The 23-kb human genomic region containing the miR-183-96-182 cluster as shown in the UCSC genome browser. Three miRs, SOX2, and TEAD4 are highlighted by red boxes. MYC and EZH2 are underlined. The binding site for SOX2 is based on Vencken's meta-analysis (PMID: 25156079). TSS of pri-miR-183-96-182 is based on Chien et al (PMID: 21821656). (B) Effects of TEAD4 knockdown (KD) on the level of Reck mRNA in differentiated C2C12 cells. ShSC, control shRNA; ShA and ShB, two independent shRNAs targeting TEAD4; n = 1. (C) Effects of SOX2 KD on the levels of miR-182, miR-96, and RECK mRNA in undifferentiated human embryonic stem cells. WT, treated with scrambled siRNA; SOX2 KD, treated with SOX2 siRNA; n = 1. (D) Effects of knocking down SOX2 or RMST on the level of RECK mRNA in neural stem cells. si-NT, control siRNA; si-RMST and si-SOX2, siRNA targeting RMST and SOX2, respectively; n = 1. (B), (C), and (D) are based on the following NCBI GEO datasets, respectively, GSE27845, GSE67993, and GSE49403.
We also surveyed the effects of additional 30 factors, mainly oncogenes and EMT regulators, on RECK and miR-183-96-182 expression. This survey detected SOX2, whose knockdown influenced the expression of the miR-183-96-182 cluster and RECK. In one dataset (GSE67993), SOX2 knockdown in human embryonic stem cells resulted in downregulation of miR-182/miR-96 and upregulation of RECK mRNA (Fig. 3C). In another dataset (GSE49403), knockdown of SOX2 or its coregulator RMST in neural stem cells resulted in upregulation of RECK mRNA (Fig. 3D), although this dataset did not provide information on miR-183-96-182 expression. In addition, another dataset (GSE59380) indicated that knockdown of SOX2 in the embryonal carcinoma cell line 2102Ep resulted in downregulation of miR-183/miR-182. 29
Discussion
Utility of the PDC Test Developed in this Study
One of the questions we attempted to address in this study was when the level of RECK mRNA changes (between cancer and normal tissues), how the levels of various miRs change in the same patient. The change in this case can be qualitative, since it involves intrinsic differences between cancer tissue and the corresponding normal tissue. Our PDC test is a simple approach to make such comparisons possible. In this test, we can choose cutoff values depending on the nature of the data being compared. For example, the levels of RE CK mRNA are known to be generally low among cancer samples, and therefore, a too strict cutoff value (eg, 0.5) for downregulation may cause unnecessary loss of information. In the case of miRs, however, more robust cutoff values of 0.5 should be more appropriate in light of their mechanism of action. However, even when we chose more stringent conditions (cutoff values of 0.5 and 2 for both RECK mRNA and miRs), the top five miRs detected in this study were the same, albeit in different order, demonstrating the robustness of this method. Nevertheless, the adjustability of cutoff values should make this method useful in wider applications.
In this study, the PDC test was successfully used for enriching miRs, whose expression are positively or inversely correlated with RECK expression. Of note, among the top 14 miRs with positive correlation with RECK mRNA (diff.sum ≤17, P ≤ 0.013; Table 3, Ranking T1-T10), 12 miRs have previously been reported to have tumor suppressor function (Table 3). Among the top 11 miRs with inverse correlation with RECK mRNA (diff.sum ≥85, P ≥ 0.991; Table 3, Ranking B1-B8), 6 miRs have previously been reported as oncomiRs, and importantly, 4 of them (miR-96,30–32 miR-21,33–36 miR-182,37–39 and miR-92b 40 ) target RECK directly. Furthermore, additional three miRs reported to target RECK mRNA (miR-7-1, 36 miR-200b, 41 and miR-200c 41 ) are also found within the top 41 in this category. Hence, this approach seems to be useful for predicting potential oncomiRs and tumor suppressor miRs and, in more general, for predicting potential miR-target relationship.
Classical theory holds that miRs repress target gene expression through two mechanisms as follows: (1) perfect or nearly perfect base pairing with the target mRNA promotes cleavage of the mRNA and (2) partially complementary miRs inhibit translation of target mRNAs. However, more recent findings indicate that translational inhibition by partially complementary miRs is also accompanied by accelerated degradation of target mRNA. 42 Our approach (to find miRs that target RECK and show inverse correlation in expression with RECK) is based on this new understanding.
miR-183-96-182 may uncouple RECK expression from EMT in cancer
We used three approaches to find candidate miRs that play roles in RECK suppression after EMT in cancer cells. The first approach of surveying published reports in PubMed has an advantage that these findings have been experimentally validated, but it also has disadvantages such as the large influence of key word choice and the arbitrary nature of the areas covered by current literature. The second approach of finding miR targets using multiple algorithms is more objective and genome wide (advantage), but the results are not always accompanied by experimental validation (disadvantage). The third approach of finding miRs with correlated changes in expression with a target gene is also objective and genome wide (advantage), but the results largely depend on the datasets used and do not usually provide any information on the mechanism of correlated changes (disadvantage). Although the results obtained through each approach may have limited value for identifying feasible candidates, the miRs detected by multiple approaches should be of particular interest.
The members of the miR-183-96-182 cluster were detected by all three approaches. First, these miRs are enriched in the abstracts related to cancer EMT studies (Table 1). Second, miR-182 was among the top-ranking miRs predicted to target RECK by all the algorithms used. miR-96 was also predicted to target RECK, albeit at lower ranking (Table 2). Third, miR-183, miR-96, and miR-182 were among the top-ranking miRs with inverse correlation with RECK in our PDC test (Table 3). Indeed, Hirata et al already showed that miR-182 could suppress RECK expression in cell lines derived from bladder cancer 38 and prostate cancer. 39 Multiple studies also indicate that miR-96 targets RECK.30–32
Several findings suggest the causative role of miR-183-96-182 in cancer EMT. Yang et al found that overexpression of miR-182 enhanced cell proliferation, invasion, and migration and induced molecular features of EMT, including upregulation of Snail and Vimentin with concomitant down-regulation of E-cadherin. 43 In a recent study, the three members of miR-183-96-182 cluster were found to promote EMT in breast cancer cells. 44 However, multiple lines of evidence place miR-183-96-182 downstream of EMT as well. In gallbladder cancer cells, TGFβ was found to induce miR-182 expression, and inhibition of miR-182 resulted in suppression of TGFβ-induced cancer cell migration and invasion. 45 Although TGFβ is not equivalent to EMT, it is commonly used to induce EMT in cultured cells. Likewise, glioma cells treated with TGFβ showed remarkable increase in the expression of miR-182, miR-183, and miR-96. 46 Taken together, these reports suggest a positive feedback loop between EMT and miR-183–96–182 in cancer cells. Interestingly, TGFβ showed no effect on miR-182 expression in normal human astrocytes, 46 supporting the idea that miR-182 may be involved in cancer-specific inhibition of RECK induction after EMT. Further strengthening this idea, miR-182 was downregulated after EMT in a prostate epithelial cell line (noncancerous). 47 However, this study was categorized into “cancer EMT” (Table 1) because the abstract contains the terms “cancer” and “metastasis”, exemplifying a potential pitfall in such text-mining approaches.
miR-183–96–182 or its components are overexpressed in various cancers and may play positive roles in carcinogenesis.48–51 Higher expression of the miR-183–96–182 cluster (as a whole or in part) in breast cancer cell lines compared with the MCF10A human breast epithelial cell line has also been reported in multiple studies.27,32 However, there are several studies reporting a inverse correlation between miR-183–96–182 or its components and malignancy,52,53 suggesting context-dependency of their actions.
Possible Regulators of miR-183–96–182 Expression
Several molecules such as β-catenin/TCF/LEF, 54 p53, 55 and TGFβ 46 have been implicated in the regulation of miR-183–96–182 expression. 48 In this study, however, we found some evidence suggesting SOX2 and TEAD4 as potential regulators of miR-183–96–182 expression.
SOX2 seems to have multiple effects on carcinogenesis: in lung cancer, SOX2 expression has been correlated with better prognosis,56,57 while in esophageal cancer, SOX2 amplification and/or overexpression has been associated with poorer prognosis. 58 In breast cancer, high SOX2 expression has been associated with cancer formation and malignancy.59–61 From three datasets on SOX2 knockdown experiments, we found evidence supporting the model that SOX2 suppresses RECK expression via upregulation of miR-183–96–182 in cancer cells (Fig. 4). Through a meta-analysis of two sets of SOX2 chromatin immunoprecipitation data using human embryonic stem cells, Vencken et al. 29 suggested a SOX2-binding site at ∼4 kb upstream of the predicted miR-183 TSS (Fig. 3A); in that study, however, SOX2 was considered to be an inhibitor of EMT during embryonic development. In the context of cancer, however, SOX2 has been reported to bind to the promoters of SNAIL, SLUG, and TWIST and to promote EMT, 62 which fits with our model. Induction of Sox2 by TGF-β has also been reported. 63 Thus, although multiple lines of evidence in the databases support the involvement of SOX2 in the pathway proposed here (Fig. 4), the evidence is fragmentary and not always in comparable contexts.

Model consistent with our findings. In cancer cells, transcription factors such as SOX2 and TEAD4 are upregulated and induce miR-182-96-183 expression. Three miRs in turn promote EMT, while two of them (miR-182 and miR-96) target RECK mRNA. The positive feedback loop between EMT and miR-182-96-183 works to stably downregulate RECK after EMT.
TEAD4, a member of the TEAD family, plays crucial roles in mammalian development and carcinogenesis and is overexpressed in various types of cancer (Supplementary Fig. 4). Knockdown of TEAD4 in C2C12 cells resulted in marked upregulation of Reck expression (Fig. 3D). Based on ENCODE ChIP-seq data, the nearest TEAD4-binding site is quite distant in the case of RECK (27.8 kb upstream of TSS) but very close in the case of miR-183–96–182 (0.2 kb upstream of TSS) (Fig. 3A). In ovarian cancer, increased TEAD4 expression predicts poorer prognosis, and increased expression of both YAP and TEAD4 shows even more dramatic association with poor prognosis. 64 While this article was under revision, Liu et al published a study reporting TEAD4 overexpression in colorectal cancer and its activity to promote EMT by activating Vimentin expression. 65 Herein, we suggest that RECK inhibition via miR-183–96–182 activation may also be involved in TEAD4-induced malignant behaviors of cancer cells after EMT (Fig. 4).
Conclusions
Through multiple in silico approaches, we aimed to narrow down the candidate miRs possibly involved in cancer-specific suppression of EMT-induced RECK upregulation. Two oncomiRs (miR-182 and miR-96) closely clustered on human chromosome 7 show inverse correlation in expression with RECK, are capable of directly targeting RECK, and have previously been implicated both upstream and downstream of EMT in cancer cells. We also predict that transcription factors such as SOX2 and TEAD4 may enhance the expression of the miR-183–96–182 cluster from which miR-182 and miR-96 are produced (Fig. 4).
Author Contributions
Conceived and designed the experiments: ZW, MN. Analyzed the data: ZW, RM. Wrote the first draft of the manuscript: ZW. Contributed to the writing of the manuscript: MN, RM, KY, YY. Developed the structure and arguments for the paper: ZW, MN. Made critical revisions and approved the final version: MN. All the authors reviewed and approved the final manuscript.
Supplementary Materials
Footnotes
Acknowledgments
The authors thank all LMCR members, especially Drs. Masakazu Toi, Satoru Ikeda, Kazuki Matsui, Yoshiteru Murofushi, Shun Ikeda, Nobuhiro Okada, and Boban Stanojevic, for their support and valuable discussion; Drs. Ryo Yamada and J. B. Brown for their instructions on some of the statistical and mathematical methods; and Takeshi Yamasaki and Kaori Sugiyama for administrative assistance.