
Abstract
Alternative splicing is a key regulatory mechanism for gene expression, vital for the proper functioning of eukaryotic cells. Disruption of normal pre-mRNA splicing has the potential to cause and reinforce human disease. Owing to rapid advances in high-throughput technologies, it is now possible to identify novel mRNA isoforms and detect aberrant splicing patterns on a genome scale, across large data sets. Analogous to the genomic types of instability describing cancer genomes (eg, chromosomal instability and microsatellite instability), transcriptome instability (TIN) has recently been proposed as a splicing-related genome-wide characteristic of certain solid cancers. We present the R package TIN, available from Bioconductor, which implements a set of methods for TIN analysis based on exon-level microarray expression profiles. TIN provides tools for estimating aberrant exon usage across samples and for analyzing correlation patterns between TIN and splicing factor expression levels.
Introduction
Cancers often harbor genomic types of instability, including chromosomal instability and microsatellite instability. However, cancer-associated variation may occur at several levels of gene regulation and, in particular, the processing of pre-mRNA into mature mRNAs is important for proper protein synthesis and cell function. Alternative pre-mRNA splicing is a major source of genetic variation in human beings, and disruption of the splicing process may cause cancer. An improved understanding of the mechanisms that cause such structural transcript variation may provide important insights into disease development and progression. Alternative splicing is regulated by splicing factors, proteins that remove certain introns from the pre-mRNA, thereby joining the exons of the mRNA together. We have recently described transcriptome instability (TIN) in cancer, a genome-wide characteristic defined by the amounts of aberrant exon usage per sample, and shown that this is strongly and nonrandomly associated with splicing factor expression levels in several cancer types.3,4
High-resolution microarrays allow for genome-wide expression profiling at the exon level, enabling the detection of alternative splicing across a large series of samples. Here, we describe TIN, an R package enabling analysis of TIN from expression data obtained by Affymetrix Human Exon 1.0 ST Arrays. A major challenge in large-scale data analysis is reproducibility. With this aim, the TIN package consists of a set of unambiguous procedures that use raw expression data (cell intensity [CEL] files) as input, which are readily accessible and easy to extend. Information on how to install the package is provided in the Supplementary File.
Methods
The TIN software package is a collection of R modules that make use of the aroma.affymetrix 5 framework to analyze exon-level expression data. Starting from raw CEL files, the TIN tool applies the Finding Isoforms using Robust Multichip Analysis (FIRMA) method 6 for preprocessing and alternative splicing detection. The FIRMA method is an extension of the robust multichip analysis (RMA) approach 7 that not only estimates expression levels but also detects alternative splicing patterns between samples. Using the FIRMA method, the first two preprocessing steps, background correction of perfect match probes and inter-chip quantile normalization, are performed in concordance with standard RMA procedures. For the summarization step, a more general model that includes the relative change for each sample in a particular exon is introduced in the FIRMA approach to allow for alternative splicing or different levels of expression for each exon along the gene. For each exon sample combination, the FIRMA method calculates alternative splicing scores, FIRMA scores, based on whether the probes systematically deviate from the expected gene expression level. Thus, the FIRMA scores are a measure of the relative ratio between exon expression level and corresponding gene expression level. Strong positive and negative scores are indicative of differential exon inclusion and skipping, respectively.
The main idea is to test the association between splicing factor expression levels and the amounts of aberrant exon usage among samples. Sample-wise total relative amounts of aberrant exon usage are recorded from exons with FIRMA scores exceeding user-defined thresholds, and the correlation between aberrant exon usage amounts and splicing factor expression levels is tested across all samples. Two methods are implemented for testing if the correlation between sample-wise aberrant exon usage amounts and splicing factor expression levels is stronger than expected by chance. First, permutations of the FIRMA scores are done for each probe set/exon across all samples, and the sample-wise amounts of aberrant exon usage are recalculated based on the permutations. If the correlation between the aberrant exon usage amounts and splicing factor expression levels is considerably lower when based on permutations compared to the original FIRMA scores, it is an indication of splicing factor expression having impact on the aberrant exon usage in the samples. Second, correlation is tested using a number of miscellaneous gene sets instead of the original set of 280 splicing factor genes. Equivalently, poorer correlation for random gene sets compared to the splicing factor set can be considered an indication that the aberrant exon usage to some extent was attributable to the expression levels of the splicing factor genes. An overview of the pipeline is outlined in Figure 1.
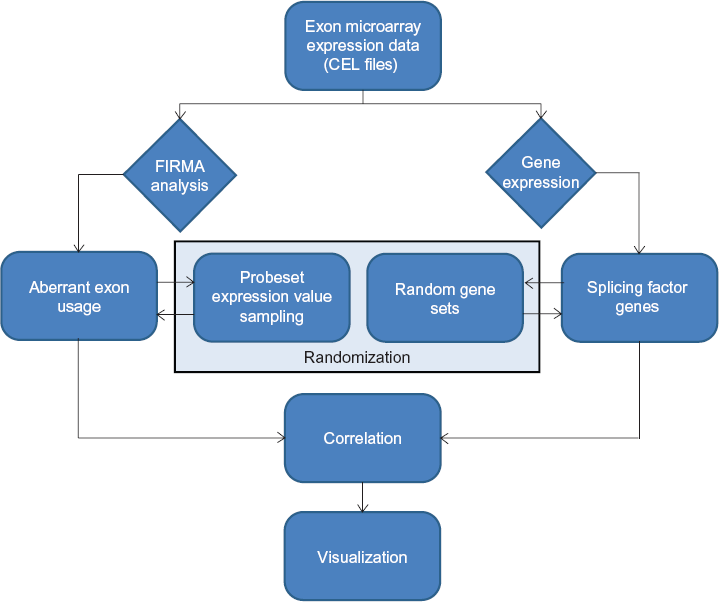
Pipeline to investigate TIN in tumor samples based on exon-level microarray data. CEL files with raw expression data is taken as input, along with gene-level expression data. The FIRMA algorithm is used to identify exon skipping and inclusion events, and user-defined thresholds (such as the upper and lower first percentile) are used for denoting exons as aberrantly spliced. The correlation between aberrant exon usage and splicing factor gene expression is evaluated and tested against random associations in two ways. First, the correlation step is carried out using permutations of the expression data at each probe set. second, the correlation is calculated using random gene sets instead of known splicing factor genes.
Example
Five R data sets are included in the package. By issuing the following commands:
data.frames with the three sets of data will become available. The first object is a comprehensive list of 280 splicing factor genes created by combining search results from several public annotation databases. 3 Second, one of the major collections of gene sets in the Molecular Signatures Database, MSigDB, 8 comprising 1,454 Gene Ontology gene sets, is included to see if the association between aberrant exon usage and gene expression levels is different in the splicing factor gene set compared to more general gene sets. Third, a list of matching gene symbols and Affymetrix transcript cluster identifiers for the full genome (core set of human genes) are provided in the annotation data set to provide easy access and enable generation of new gene sets. The main purpose behind the TIN package is to facilitate reproducibility through a consistent set of algorithms, which may be applied on real-world data; however, for educational purposes, a small toy data set is embedded in the release. Thus, preprocessed FIRMA scores for 16 samples and 10,000 randomly selected probe sets are included in the sampleSetFirmaScores object. Equivalently, gene-level expression data for the same 16 samples across the core set of human genes are provided through the sampleSetGeneSummaries object. Summary files for real gene-level expression data can be generated by using, for instance, Affymetrix Power Tools or Expression Console prior to applying the TIN package. The analysis pipeline is outlined in the following example, with expression data from 131 prostate cancers. 9 The data set is publicly available from NCBI's Gene Expression Omnibus (GEO; accession number GSE21034).
To use the small toy data set supplied with the package instead, load the sample data by issuing the following two commands
In the example, the lower and upper 1st percentiles are used as threshold values to score exons with deviating skipping or inclusion (Fig S1). Information on where to find documentation of the different functions is provided in the Supplementary File.
Having performed FIRMA analysis and entered gene-level expression values, sample-wise amounts of aberrant exon usage are calculated. Pearson correlation between relative amounts of aberrant exon usage and splicing factor expression is obtained using tools from the WGCNA package (Bioconductor). 10 To assess the association, correlation is also calculated for random permutations of the FIRMA scores at each probe set and for random sets of genes.
Visualization
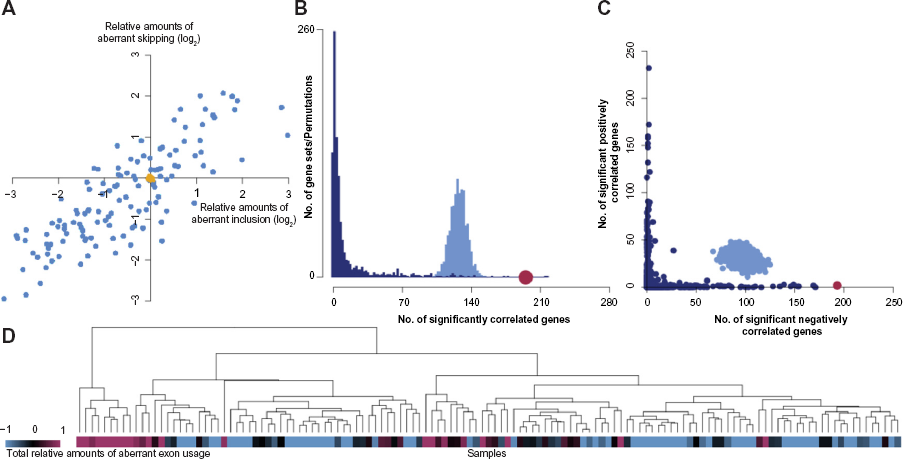
The TIN package implements four different methods for visualizing the results (Fig. 2). First, a scatter plot visualizes sample-wise relative amounts of aberrant exon inclusion vs exon exclusion and optionally includes amounts calculated from random permutations of the FIRMA scores for comparison (Fig. 2A). Second, the package includes a function for comparing sample-wise correlation between splicing factor gene expression and total relative amounts of aberrant exon usage, with correlations obtained either by making permutations of the sample-wise amounts of aberrant exon usage or by using randomly generated gene sets (Fig. 2B). Third, a scatter plot that compares the amount of splicing factor genes for which expression levels are significantly positively and negatively correlated with the total relative amounts of aberrant exon usage per sample is created (Fig. 2C). This plot may also include results based on permutations of the sample-wise aberrant exon usage amounts and randomly constructed gene sets. In addition, a function for hierarchical clustering of the samples based on splicing factor expression levels is included to test for separation of samples according to aberrant exon usage amounts (Fig. 2D). Example commands for creating visualization plots are outlined below:
Further instructions on parameter usage and how the methods work are provided in the accompanying vignette and documentation of the package.
(
Results and Discussion
We have developed the TIN package (Bioconductor) to analyze TIN in cancer or other disease conditions from exon-level microarray data. By using computational tools already available to create algorithms for analyzing TIN, the package offers a framework for calculating and visualizing the correlation between sample-wise aberrant exon usage amounts and expression levels of multiple gene sets, including splicing factors. The R software has been applied to expression data from different cancer types, and we have shown that TIN is a common feature of several types of solid cancer. In most cancer types studied, we found strong and nonrandom (
Author Contributions
Conceived and designed the methods: BJ, AS, RIS. Wrote the software code: BJ. Wrote the first draft of the manuscript: BJ. Contributed to the writing of the manuscript: AS, RIS. Agreed with manuscript results and conclusions: BJ, AS, RIS. Developed the structure and arguments for the paper: BJ. Made critical revisions and approved the final version: BJ, AS, RIS. All the authors reviewed and approved the final manuscript.
Supplementary Material
Supplementary File
This file contains installation guidelines, links to documentation for the TIN package, and Figure S1, a distribution plot of all FIRMA scores in the worked example.