
Abstract
Background
One of the major mechanisms of generating mRNA diversity is alternative splicing, a regulated process that allows for the flexibility of producing functionally different proteins from the same genomic sequences. This process is often altered in cancer cells to produce aberrant proteins that drive the progression of cancer. A better understanding of the misregulation of alternative splicing will shed light on the development of novel targets for pharmacological interventions of cancer.
Methods
In this study, we evaluated three statistical methods, random effects meta-regression, beta regression, and generalized linear mixed effects model, for the analysis of splicing quantitative trait loci (sQTL) using RNA-Seq data. All the three methods use exon-inclusion levels estimated by the PennSeq algorithm, a statistical method that utilizes paired-end reads and accounts for non-uniform sequencing coverage.
Results
Using both simulated and real RNA-Seq datasets, we compared these three methods with GLiMMPS, a recently developed method for sQTL analysis. Our results indicate that the most reliable and powerful method was the random effects meta-regression approach, which identified sQTLs at low false discovery rates but higher power when compared to GLiMMPS.
Conclusions
We have evaluated three statistical methods for the analysis of sQTLs in RNA-Seq. Results from our study will be instructive for researchers in selecting the appropriate statistical methods for sQTL analysis.
Background
Alternative splicing, a post-transcriptional process that allows multiple messenger RNA (mRNA) isoforms to be produced by a single gene, is a regulated process, and a major mechanism for generating protein diversity. During this process, specific exons of a gene can be either included or excluded from the mature mRNAs, leading to structurally and functionally distinct proteins. In multicellular organisms, alternative splicing is a prevalent phenomenon, which has been estimated to occur in over 90% of the human genes. 1
Alternative splicing is often altered in cancer cells to produce aberrant proteins that drive the progression of cancer.2–5 Genome-wide studies have identified more than 15,000 splicing variants associated with a wide range of cancers.6–8 During oncogenesis, alternative splicing can affect genes involved in promoting cell migration, activating cell growth, maintaining hormone responsiveness, curbing apoptosis, and evading chemotherapy.9,10 A number of factors can contribute to the misregulation of alternative splicing, including the disruption of either
Several studies have demonstrated the regulatory role of single nucleotide polymorphisms (SNPs) on the splicing patterns of mRNA precursors. These SNPs have been termed splicing quantitative trait loci (sQTL). One of the critical steps in studying the mechanisms and regulation of alternative splicing is the identification of these loci, which previously has been achieved via high-throughput technologies such as microarrays. Using samples from lymphoblastoid B cell lines, brain, or peripheral blood mononuclear cell,11–14 several studies have demonstrated the functional importance of alternative splicing in a variety of normal and diseased tissues in human. Interestingly, this body of work has also collectively suggested that
Analysis of sQTLs using RNA-Seq is challenging because the characterization of alternative splicing relies on isoform-specific gene expression, which has to be estimated statistically. To date, only a few methods have been developed to identify sQTLs from RNA-Seq data. One simple approach is to perform linear regression in which the percentage of exon read counts over total gene read counts is treated as the quantitative trait, and the SNP genotype is treated as the independent variable. 15 However, this model fails to account for the variability in RNA-Seq read counts and hence can lead to false positive results. Recently, Zhao et al developed GLiMMPS, a generalized linear mixed effects model approach that takes into account the variation of exon-specific read coverage as well as the overdispersion of read counts. 18 Although GLiMMPS has shown significant improvement over simple linear regression, this method has several shortcomings. First, by considering only splice junction reads, GLiMMPS ignores reads that align to the body of alternative exon and those that align to flanking constitutive exons. Previous studies have shown that both types of reads are informative for alternative splicing inference. 19 Second, GLiMMPS cannot be extended to integrate the paired-end nature of RNA-Seq data. Third, GLiMPPS treats the estimated exon-inclusion level as a random effect, while a more desirable and mathematically accurate approach is to explicitly model the variance associated with the exon-inclusion level estimation. Fourth, GLiMPPS relies on the assumption that RNA-Seq reads are uniformly distributed along transcripts. Various studies have shown that RNA-Seq reads are rarely uniformly distributed, and the ignorance of this phenomenon can lead to biased estimates of isoform-specific gene expression. 20
An ideal method for sQTL analysis should be able to directly model the variation of exon-inclusion level estimates between samples, utilize extra information embedded in paired-end RNA-Seq data, and adjust for non-uniform read distribution. In this study, we evaluated three statistical methods, including random effects meta-regression, beta regression, and generalized linear mixed effects model, for the analysis of sQTLs. All the three methods used exon-inclusion level estimated by the PennSeq algorithm as input. 20 PennSeq is a recently developed statistical method that utilizes paired-end reads and allows for non-uniform read distribution. Using both simulated and real RNA-Seq datasets, we demonstrated that the best performing method is the random effects meta-regression approach, which shows low false discovery rates (FDRs) but higher power when compared to GLiMMPS.
Materials and Methods
Estimation of Exon-Inclusion Level
One vital step in sQTL analysis is to estimate exon-inclusion level, which is defined as the proportion of mRNAs that originates from the exon-inclusion isoform, ie, the longer isoform including the exon that is otherwise skipped, among all transcripts from the same gene. The estimated exon-inclusion level is often treated as a quantitative trait and used in a regression framework to identify sQTLs. GLiMMPS only uses junction reads mapped to splice junctions and estimates the exon-inclusion level as the fraction of the number of inclusion splice junction reads to the total number of junction reads. However, as shown in Figure 1A, reads aligning to the alternative exon body and those that align to the flanking constitutive exons are also informative for exon-inclusion level estimation, because higher expression of the exon-inclusion isoform will increase the density of reads in the alternative exon relative to the flanking constitutive exons. 19 To utilize all available information, we chose to use PennSeq, 20 a recently developed non-parametric-based approach, to estimate exon-inclusion level. The PennSeq algorithm considers all mapped reads in a given exon-trio, which is composed of the alternative exon and the flanking constitutive exons. Additionally, PennSeq takes into account the paired-end nature of the data and allows the exon-inclusion isoform and the exon-exclusion isoform to have their own non-uniform read distributions. The exon-inclusion level is then estimated as the relative expression of the exon-inclusion isoform over the total expression of the two isoforms.
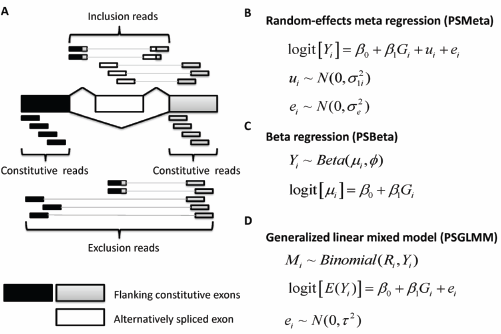
(A) An exon-trio is composed of two flanking constituitive exons and an alternatively spliced exon. RNA-Seq reads aligning to the body of the alternatively spliced exon or to splice junctions involving this exon support the inclusive isoform, whereas reads joining the two constitutive exons support the exclusive isoform.
19
GLiMMPS uses splice-junction reads only, but does not use reads mapping to the alternative exon body and those mapping to the flanking constitutive exon body. In contrast, PennSeq uses all available reads in the exon-trio. (B) PSMeta: random effects meta-regression.
Random Effects Meta-Regression for Analysis of Sqtls
The goal of random effects meta-regression is to synthesize results from multiple studies, accounting for variability in the effect estimates across studies by explicitly allowing for different sources of variability: within- and between-study variation. 21 This parallels perfectly with sQTL analysis in that within-study variation represents the variance introduced in exon-inclusion level estimation and between-study variation represents the variation in exon-inclusion levels across samples. This analogy motivated us to explore random effects meta-regression as a means to identify sQTLs.
Let

With the above notation, the random effects meta-regression model (Fig. 1B) can be expressed as:

where
Beta Regression for Analysis of sQTLs
Since exon-inclusion level takes values between 0 and 1, it is natural to assume that it follows a beta distribution. With this assumption, we can identify sQTLs using beta regression.
23
In contrast to the random effects meta-regression, which requires logit transformation on the exon-inclusion estimates, beta regression can model the exon-inclusion level directly, producing results that are readily interpretable. The beta regression model is based on an alternative parameterization of the beta distribution in terms of a mean parameter μ and a precision parameter φ. We assume

We can perform beta regression using the
Generalized Linear Mixed Effects Model for Analysis of Sqtls
GLiMMPS is based on generalized linear mixed effects model in which the dependent variable is the exon-inclusion level, estimated exclusively from reads spanning splice junctions, which only represent part of the information on alternative splicing embedded in RNA-Seq data. Therefore, it is expected that using estimates from PennSeq, which incorporates other alternative splicing informative reads omitted by GLiMMPS, would yield higher power. To fit the generalized linear mixed effects model, we first calculate the total number of reads mapped to a given exon-trio, denoted by

where
RNA-Seq Data Simulation
To evaluate the performance of the aforementioned methods in sQTL identification, we conducted simulation studies and compared their empirical power to that of GLiMMPS. Flux Simulator was used to simulate a series of paired-end RNA-Seq experiments
RNA-Seq Datasets and Genotype Data
We downloaded the RNA-Seq data produced by Lappalainen et al.
17
This dataset includes 91 lymphoblastoid B cell lines from the CEPH (CEU) population in the HapMap project. Each sample has approximately 10 million 75 bp paired-end reads, which were already mapped to the reference human genome (hg19, NCBI build 37) using the JIP pipeline. We downloaded the Phase 1 genotype data for 79 CEU samples generated by the 1000 Genomes Project.
26
The number of subjects who had both RNA-Seq and DNA genotype data is 78. To search for sQTLs, we identified all exon-trios in autosomal chromosomes and restricted analysis to
Results
Comparison of Exon-Inclusion Level Estimation
First, we compared the exon-inclusion levels estimated by GLiMMPS and PennSeq based on simulated data. Because of the narrow range of the exon-inclusion levels under the null model, we focused on those exon-trios from the alternative model in which the exon-inclusion level was influenced by an sQTL. For each of the 120 simulated individuals, we calculated the Pearson correlation coefficient between the estimated and the true values of the exon-inclusion levels. As expected, PennSeq yielded more accurate estimate than GLiMMPS. Among the 120 individuals, 102 (85%) had higher correlation coefficients in PennSeq than in GLiMMPS. The improvement in accuracy was also reflected in the root mean squared error, calculated as
Comparison of FDR and Power
Next, we compared the FDR of random effects meta-regression (denoted by PSMeta), beta regression (denoted by PSBeta), generalized linear mixed effects model with PennSeq estimates (denoted by PSGLMM), and GLiMPPS. We analyzed all 120 simulated individuals for sQTLs. To evaluate the impact of sample size, we generated samples of reduced sample size by randomly picking 60 and 90 individuals out of the 120. All evaluated methods had FDRs well below the 5% nominal level for all sample sizes we considered (Fig. 2A). However, GLiMMPS appeared to be overly conservative compared to the other methods. Its estimated FDR was generally below 1%, which was several times smaller than the expected 5%.
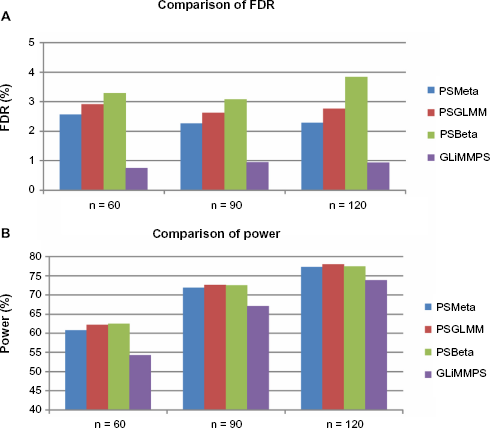
Comparison of false discovery rate and power using all simulated exon-trios. (A) The FDR was calculated as the fraction of false discoveries (ie, an SNP with FDR-adjusted
Our main interest was to compare the power of various types of regressions with GLiMMPS. Unsurprisingly due to its conservativeness, GLiMMPS had the lowest power among all models we evaluated (Fig. 2B). For example, when the sample size was 60, the power of GLiMMPS was 54%, whereas the powers of PSMeta, PSBeta, and PSGLM were all above 60%, which represent 12–15% improvement over GLiMMPS. The loss of power for GLiMMPS became less pronounced when sample size gets larger. When the sample size was 90, the power improvement of the other methods over GLiMMPS was around 7–8%, and when the sample size was 120, the power improvement was approximately 5–6%.
Impact of Non-Uniform read Distribution
The assumption of uniform read distribution is one of the significant limitations of GLiMMPS. In order to appraise the real-life applicability of a method, understanding the impact of sequencing coverage non-uniformity on its performance is a critical step. In the GLiMMPS publication, Zhao et al informally evaluated the impact by introducing a random scaling factor in junction read counts. 18 However, read count is a simple summary of the original RNA-Seq data and is unlikely to capture all of the variations in non-uniformity present in raw reads. Using raw RNA-Seq data generated by the Flux Simulator, we can directly evaluate the impact of non-uniformity on the power of the various approaches. To quantify the degree of non-uniformity, we extracted the fraction of coverage, defined as the fraction of the transcript that is covered by reads, from the output of the Flux Simulator.
Based on this measure, we calculated the mean fraction of coverage across all samples and focused on those transcripts with mean coverage less than 1/3. A large fraction of the transcript body of these genes was not covered, which would lead to severe non-uniform read distribution. Figure 3A shows that the FDRs of PSMeta and GLiMMPS were under control, but PSBeta and PSGLMM had slightly inflated FDRs when sample size was 90 or 120. The power of all methods dropped substantially (Fig. 3B), especially for GLiMMPS. Compared to the power obtained from all simulated exon-trios, the loss of power for PSMeta, PSBeta, and PSGLMM was between 34 and 38%, whereas the power loss was 44% for GLiMMPS. Moreover, the power improvement of the other three methods over GLiMMPS was also more pronounced, especially when sample size was small. With 60 subjects, the power improvement of PSMeta over GLiMMPS was 23%, which is twice of the power improvement when all exon-trios were considered. These results suggest that when non-uniformity is a concern, using exon-inclusion levels obtained from junction reads alone can lead to substantial loss of power.

Impact of non-uniform read distribution. Only exon-trios with average percent transcript coverage less than 1/3 were included in the analysis, where the average percent transcript coverage was calculated across all 120 simulated subjects. (A) The FDR was calculated as the fraction of false discoveries (ie, an SNP with FDR-adjusted
Application to the Real RNA-Seq Dataset on CEU Samples
To further assess the performance of different methods, we analyzed a real human RNA-Seq dataset on CEU lymphoblastoid cell line samples. We carried out sQTL analysis for common SNPs (MAF ≫0.2) within 200 kb from alternatively spliced exons because previous studies have suggested that sQTLs are often near the target exons.12,15 To get reliable results, we only focused on those exon-trios in which the number of mapped reads is greater than 10 in all 78 subjects. Eventually, we were left with 3,694 exon-trios (in 2,070 genes), 640,105 SNPs, and 1,590,722 exon-trio-SNP pairs in the final comparison.
We found that the two generalized linear mixed effects model based approaches, PSGLMM and GLiMMPS, failed to converge for a large number of exon-trio-SNP pairs. Among the 1,590,722 exon-trio-SNP pairs we considered, GLiMMPS failed to converge for 35.75% of the pairs and PSGLMM failed for 50.07%. In contrast, PSBeta failed to converge for 0.92% of the pairs, and PSMeta failed to converge for only 1.75%. For the 549,095 pairs that failed in GLiMMPS, we observed an excess of
To characterize and compare the performance of these methods in greater detail, we generated quantile–quantile plots with the
Comparison of the numbers of sQTL SNPs identified by PSMeta and GLiMMPS based on the CEU RNA-Seq dataset. Displayed are the numbers of exon-trio-SNP pairs, exon-trios, and genes that contain a significant sQTL SNP.

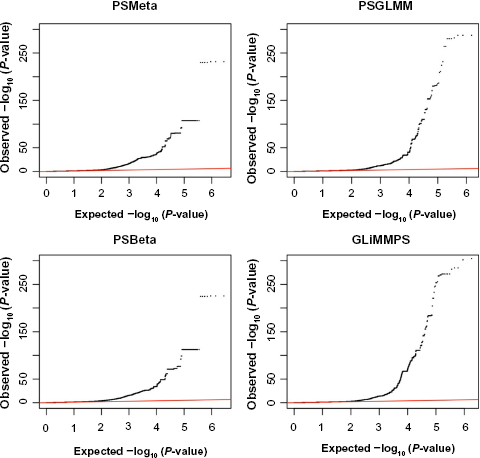
Comparison of quantile–quantile plots based on the CEU RNA-Seq data. Displayed are valid results from each method, ie, those exon-trio-SNP pairs that failed to converge were eliminated.
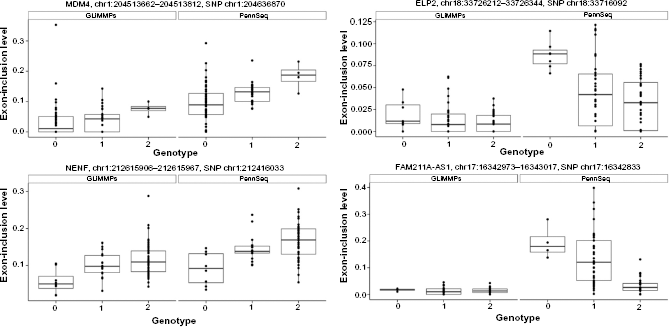
Illustrative examples of sQTL SNPs identified by PSMeta but were missed by GLiMMPS. The horizontal axis shows the genotype (represented by 0, 1, 2, counting the number of minor alleles) at each sQTL SNP, and the vertical axis shows the estimated exon-inclusion levels from PennSeq and GLiMMPS.
Next, we compared the performance of PSMeta and GLiMMPS independently by conducting FDR adjustment on exon-trio-SNP pairs that converged for each individual method. Since PSMeta converged for a significantly larger proportion of the pairs, we detected notably more sQTL SNPs in PSMeta as compared to GLiMMPS: 22,150 exon-trio-SNP pairs, containing 16,757 sQTL SNPs for 624 exon-trios in 447 genes for PSMeta, but only 7,409 exon-trio-SNP pairs, involving 6,251 sQTL SNPs for 272 exon-trios in 216 genes for GLiMMPS (Table 1). This result suggests that due to its intrinsic computational advantage, PSMeta greatly outperformed GLiMMPS in genome-wide search for sQTL SNPs.
Discussion
The advent of RNA-Seq has equipped us with a powerful tool to systematically search for sQTLs that regulate the pattern of alternative splicing. In sQTL analysis using RNA-Seq data, it is important to account for exon-inclusion level estimation uncertainty, directly model variation in the precision of exon-inclusion level estimates between samples, and allow for non-uniform read distribution along transcripts. In this study, we evaluated three statistical methods, including random effects meta-regression, beta regression, and generalized linear mixed effects model, for the analysis of sQTLs. In contrast to GLiMMPS, which uses junction reads only to quantify exon-inclusion levels, we used PennSeq, 20 a statistical method that utilizes all available reads and allows for non-uniform read distribution. Using both simulated and real RNA-Seq datasets, we demonstrated that PSMeta is the best performing method, and identified sQTLs at low FDRs but higher power when compared to GLiMMPS.
The main reason for power improvement of PSMeta over GLiMMPS is due to the efficient use of additional RNA-Seq read information in exon-inclusion level estimation. Closer examination of the simulated data showed that the exon-inclusion levels using junction reads only were less well estimated as compared to PennSeq, which uses all available reads including those from flanking constitutive exons. Another reason is that GLiMMPS cannot explicitly model paired-end data structure, but PennSeq can effectively utilize paired-end read information in its modeling. In paired-end RNA-Seq data with tight distribution of insert size, reads mapped to flanking constitutive exons can provide useful information about the exon-inclusion level. By using the generalized linear mixed effects model with estimates obtained from PennSeq, we confirmed that the power loss of GLiMMPS was due to the use of less-accurate estimate of exon-inclusion levels.
We also examined the impact of non-uniformity on the performance of different methods. The power of all methods decreased for exon-trios that demonstrate severe non-uniformity. Among the four methods we evaluated, PSGLMM and PSBeta had slightly inflated FDRs. The FDRs of both PSMeta and GLiMMPS were under control, but PSMeta had greater power. Overall, PSMeta appeared to be the most reliable yet powerful method for sQTL analysis.
In this study, we only focused on exon-skipping events, but the framework we presented can be easily generalized to examine other types of alternative splicing, including intron retention, alternative 5’ splice site, alternative 3’ splice site, and mutually exclusive exons. For example, for alternative splicing events that involve alternative 5’ splice site, we can treat the relative abundance of the isoform with alternative 5’ splice site as the quantitative trait in random effects meta-regression. Analysis for events that involve intron retention, alternative 3’ splice site, and mutually exclusive exons can be performed in a similar fashion.
In our analysis, we estimated the exon-inclusion levels first and then identified sQTLs using regression-based methods. This two-stage approach might be less powerful than identifying sQTLs using a one-stage approach, which avoids estimating exon-inclusion levels directly. We are currently pursuing extensions in this direction. Another possible direction of future research is to consider the overall splicing pattern of a gene by simultaneously considering the relative abundances of all isoforms of the gene. This analysis will give a single test statistic for each gene instead of one statistic for each exon-trio. We expect this approach to have increased statistical power due to its reduced burden of multiple testing.
Conclusions
In summary, we have evaluated three statistical methods for the analysis of sQTLs in RNA-Seq. As shown by both simulations and the analysis of real data, the most robust method is PSMeta, a random effects meta-regression-based approach. An appealing feature of PSMeta is that it can be easily implemented using existing software packages. Results from our study will be instructive for researchers in selecting the appropriate statistical methods for sQTL analysis.
Author Contributions
Designed the study: ML. Conducted the analysis: CJ, YH, and YL. Wrote the manuscript: CJ, ML. Made critical revisions: CJ, ML. All authors reviewed and approved the final manuscript.
Footnotes
List of Abbreviations
RNA-Seq, RNA sequencing; sQTL, splicing quantitative trait loci; MAF, minor allele frequency; FDR, false discovery rate.