
Abstract
The landscape of translational research has been shifting toward drug combination therapies. Pairing of drugs allows for more types of drug interaction with cells. In order to accurately and comprehensively assess combinational drug efficacy, analytical methods capable of recognizing these alternative reactions will be required to prioritize those drug candidates having better chances of delivering appreciable therapeutic benefits. Traditional efficacy measures are primarily based on the “extent” of drug inhibition, which is the percentage of cells being killed after drug exposure. Here, we introduce a second dimension of evaluation criterion, speed of killing, based on a live cell imaging assay. This dynamic response trajectory approach takes advantage of both “extent” and “speed” information and uncovers synergisms that would otherwise be missed, while also generating hypotheses regarding important mechanistic modes of drug action.
Introduction
Numerous efforts have been dedicated to cancer therapeutics over the last few decades, primarily focusing on identifying driver mutations and other target types, whose activities could be severely disrupted via single-target drug inhibitors.1,2 The initiating breakthrough for this type of approach was the development of Gleevec¯ (Imatinib), a
Drug efficacy is typically evaluated
Drug efficacy can be measured based on the “extent” of their ability in inhibiting cells: the percentage of cells being killed after drug exposure. There is, however, one more critical type of measure that has largely been neglected, the speed of killing. Given two drugs with similar extent of efficacy, a faster working drug may be preferred as it may reduce the chance that cells will develop acquired resistance and minimize the likelihood that the drug is broken down and filtered out of the system before providing maximal killing. In addition, crucial cell behaviors, including cytostasis and cell death, manifest differently in cell response dynamics. But the traditional way of measuring efficacy, where the number of live treated cells is compared to the number of live untreated cells, specifies a way but is unable to attribute it to either inhibition of cell growth or induction of cell death. In fact, dynamics is such a vital element in the study of system biology that analyzing multiple component response trajectories over time after perturbation has long been an indispensable tool for gaining insight into complex cell functions and machinery.
Here, we will introduce how a live cell imaging-based assay can exploit information about temporal responses to evaluate the efficacy of drug combinations. The response dynamics between single and combination drug therapies can reveal important modes of mechanism and help uncover potent drug combinations that would otherwise be missed.
Results
We tested four different drugs, MLN9708, SH-4-54, PIK-75, and KPT-330, and their combinations, pre-selected for their critical inhibition capabilities on distinct and independent molecules. (For better readability and more clarity, especially in figures and equations, wherever appropriate, these drugs are coded as drug A, B, C, and D, respectively.) We applied them on ten different canine cell lines and the images of cells were captured 46 times, once in an hour. We processed the images and extracted relevant morphological features for classifying dead/alive cells. Details of these procedures can be found in the “Materials and methods” section.
Limitation of traditional “end point only” synergism detection approach
In order to assess the effectiveness of a drug, we define the killing efficacy (KE) of a drug as the percentage of cells classified as dead after treatment. We use the notation
When two drugs X and Y are assumed to work through independent mechanisms, and therefore follow the Bliss independence model, we declare synergism, if the statistic

We now show the limitation of the traditional “end-point only” approach for detecting synergism of drug combinations. KEs are calculated for drugs MLN9708 (A) and SH-4-54 (B) and their combination at time point 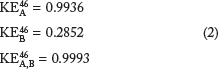
Comparing response trajectories can discover strong synergism not revealed by a non-dynamic approach
We will now calculate KEs for the full 46 hours and plot them over time in Figure 1. It is obvious that though SH-4-54 itself is not a potent inhibitor, it sensitized the cells, so that the combination works in an extremely efficient manner and accomplishes maximal killing much sooner. As discussed earlier, this speed is a very desirable property of drugs.

KE over time for drugs MLN9708 (black), SH-4-54 (blue), and a combination of MLN9708 + SH-4-54 (red).
By considering KEs over a period of time, we define combinational drug synergism, based on the single time point synergism test, relative to two drugs X and Y by

Figure 2 shows the KE over time across different cell lines: ABRAMS, BKOS, and CML1. As

KE overtime (hours on the x-axis) for drugs MLN9708 (A; black), SH-4-54 (B; blue), and MLN9708 + SH-4-54 combination (red), except in (B) which has drug PIK-75 (C; blue) and combination A + C (red). The green dashed line shows the “synergistic points” calculated as
Ranking drug efficacy using a two-dimensional drug efficacy measuring technique
It is a common practice to rank drug efficacies, so that a candidate drug or drug combination can be prioritized for testing in the next phase. Having drug response dynamics at our disposal gives us two-dimensional drug efficacy parameters: extent and speed, denoted by (
As an example, AUCX is calculated for Figure 2A and 2B for ABRAMS and ranked high to low as follows:

There are scenarios when one may wish to decompose AUC values and take a look at (

Response curves with
We will estimate (

(
Discussion
We have shown that the efficacy of drugs and drug combinations can be more thoroughly evaluated using a live cell imaging-based dynamic response trajectory approach. As the landscape of translational research has been shifting to combination therapies, 11 our aim here is to develop a method that prioritizes drug combinations that kill cancer cells in a more complete and efficient fashion. The addition of timeline information is crucial in uncovering synergism that will otherwise be missed by the traditional two-point system approach (taking measurements at the start and end of an experiment only).
It should be noted that even though we only tested a combination of two drugs in this work, our method could be directly applied (eg, in Figs. 1 and 3) or easily extended (eg, to Fig. 2) to combinations of more than two. For example, if we desired to evaluate any possible synergistic effects of a 3-drug (X, Y, and Z) combination over the singletons, Equations (1) and (3) become:

Testing the behavior of actin cytoskeletal elements has been undertaken as a result of the accelerated kill rate response of MLN9708 after being combined with SH-4-54 (Fig. 1). This acceleration suggests the possibility that SH-4-54 might be eroding the integrity of some fundamental cell structures. This was confirmed by comparing actin cytoskeletal filaments in cells treated with MLN9708 or SH-4-54 alone, or both. From Figure 5, it is clear that the cytoskeletal structure is compromised for cells treated with SH-4-54 or with the combination, but not for those treated with MLN9708 only, and this occurs in concurrence with pyknosis and death of the cells. MLN9708 alone has about the same killing efficacy at 13 hours as that of SH-4-54 (Fig. 1); however, cells have dramatically different cytoskeletal structural morphologies (Figs. 5B and 5C), indicating that two different modes of mechanism are involved when these two drugs exert their individual inhibitory powers. Imaging the dynamics of various behaviors of cellular components in many individual cells over time in response to differing drugs is a way to analyze the systems active in cells. Recent advances in the development of reporters for a wide variety of cellular components make it possible to more fully interrogate cellular activities from a systems viewpoint.

Actin cytoskeletal filament images for ABRAMS at 13 hours for (A) untreated, (B) treated with MLN9708 only, (C) treated with SH-4-54 only, and (D) treated with MLN9708 + SH-4-54 combination.
Materials and Methods
Selection of drugs
Two proteins that are highly involved in generating prosurvival activities in a wide variety of cancer cells are Mcl1 and Stat3. Mcl1 binds with the proapoptotic Bax and Bak1 proteins, keeping them from forming multimers that breach the outer membranes of mitochondria, initiating apoptotic cell death. A number of drugs suppressing Mcl1 production or activity have been produced. The drug PIK-75 targets the suppression of Mcl1 production by inhibiting the ability of the Cdk9 kinase to phosphorylate RNA polymerase II, which is required for transcription of Mcl1.
17
The drug MLN9708 (Ixazomib, Takeda Oncology) is currently in clinical use to reduce prosurvival activity of Mcl1 in cancer cells. This drug stimulates the production of Pmaip1 (NoxA) protein by inhibiting the chymotrypsin-like proteolytic (β5) site of the 20S proteasome, which ultimately stimulates transcription and translation of the
Stat3 protein has long been studied as a likely target for cancer drug development. 20 Drugs designed to antagonize Stat3 activity have mostly been designed to target kinases that phosphorylate Stat3 at a position that allows the phosphorylated protein to form homodimers. These types of drugs have not been very successful, which is likely due to several different kinases known to be active on Stat3 and probably more that have not yet been identified. More recently, two Stat3 antagonists with differing modes of repression have been developed. An inhibitor of CREB-binding protein-mediated Stat3 acetylation, KPT-330, effectively blocks Stat3 transcription of Mcl1. 21 More recently, a Stat3 antagonist, SH-4-54, was developed that binds with phosphorylated Stat3 in a way that prevents homodimerization. 22 This type of inhibition is more specific in its action and less likely to be confounded by alternate interactions.
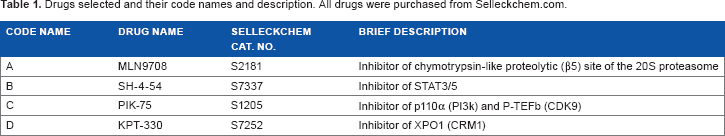
A summary of these drugs is provided in Table 1.
Drugs selected and their code names and description. All drugs were purchased from Selleckchem.com.
Cell culture
We have imaged ten different canine cell lines kindly provided by Dr. H.M. Wilson-Roble. Canine osteosarcoma cells (ABRAMS, BKOS, BOOZA, MCKOS, SKOS, and UWOS2) and canine malignant melanoma cells (CML1, CML6M, JONES, and PARKS) were grown in imaging medium (IM) having low levels of autofluorescence and were maintained at 37 °C with 5% CO2. IM contains 70% Medium 199 (Thermo Fisher Scientific, 11825015), 30% Roswell Park Memorial Institute-1640 medium (11875085) supplemented with 10% fetal bovine serum (16000044), 20 mM Hepes (15630080), 20 mM Glutamax (35050061), and 11 mM D-glucose (A2494001).
Sample preparation
Cells of each type were plated at a density of 2,000 cells/well in 30 μL/well of IM on a 384-well microtiter plate (Greiner Bio-One 781091) pre-coated with 10 μg/mL rat tail collagen type I (BD Biosciences 354249) and incubated overnight at 37 °C with 5% CO2. Prior to taking baseline time points, nuclei were stained with 0.00667% Vybrant¯ DyeCycle™ violet stain (ThermoFisher Scientific V35003), which is a live cell permeable stain and produces blue fluorescence (<437 nm) when bound to double-stranded DNA and stimulated with a violet excitation source (<369 nm). Each well also contained 0.0125% CellTox™ green (CTG) dye for measuring cell death (Promega Inc. G8742). This cyanine dye preferentially stains the dead cell DNA when cell membrane integrity is compromised, producing bright green fluorescent signal (<509 nm) when stimulated with a 488 nm excitation source.
Treatment and imaging
After taking baseline time points (typically the first one or two time points), cells were treated with different drugs or drug combinations, and each well was scanned every hour for 1 or 2 days using an Image Xpress Micro XLS Widefield High-Content Analysis System (Molecular Devices) sampling at three different imaging sites within each well.
An example composite image is given in Figure 6A for a baseline time point and Figure 6B for 44 hours after being treated with drugs; the full-time sequence images can be found in the Supplementary Files (S01.avi for the nucleus channel and S02.avi for the CTG channel). Phase-contrast cell images were also captured to provide information about overall cell-structure changes over time. A plug-in tool based on ImageJ (National Institutes of Health) was developed that allows users to more efficiently view and manage the large number of images collected. The interface of the tool is demonstrated in Supplementary Figure S03.pdf.

Sample composite images of nuclei (blue) and CTG (green), showing (A) early time point before being treated with drugs and (B) a time point about 45 hours after being treated with drugs.
Image processing
The images were sent into an in-house pipeline developed in Matlab (Mathworks) using the SDC morphological toolbox. 23 After image segmentation on both nuclear channel and green fluorescent channel, 24 we collected a large number of measurements for each individual cell. Details on image segmentation method were previously reported.24,25 As our primary goal here is to assess the ability of various drugs and drug combinations in killing cancer cells, we used the following morphological features on each cell in dead/alive labeling (the rationales are provided in the following sections):
Nucleus size (
Nucleus mean intensity (μInuk)
CTG mean intensity in nucleus (μICTG/nuk)
In addition, nuclei boundaries are also saved and can be easily overlaid on the original images using the ImageJ plug-in tool.
Identifying apoptotic cells morphologically
Debates are still ongoing about the most reliable cell morphological manifestations for classifying dead cells versus live cells.26,27 However, for our practical purpose, we can safely classify a cell as dead if its membrane is compromised, at which time the CTG dye in the media can enter the cell and bind to the DNA and produce a significant signal when compared to intact cells. Therefore, we can classify a cell as dead when

Pyknosis, or condensation of chromatin in nucleus, is typically a hallmark of apoptosis and is irreversible. As such, the start of the process can be easily detected on nuclear channel images when the nuclei become much smaller and brighter, as determined by another classification rule, which is as follows:

It has been observed that pyknosis measured by nucleus intensity and size well precedes the loss of cell membrane integrity as detected by CTG and the exact time depending on the cell lines and drugs used. Figure 7 shows a couple of examples (the complete set of comparisons, including multiple cell lines and drugs, can be found in the Supplementary File S04.pdf). In Figure 7, blue lines are the percentages of cell death based solely on μICTG/nuk and black lines indicate the percentages of cell death based solely on nucleus intensity μInuk. The peak activities measured by either method are separated by more than 24 hours. This makes CTG unsuitable for early death detection. On the other hand, as drug-responsive cells move deeper into apoptosis and experience structural breakdown, the brightness observed at the beginning of pyknosis starts fading away and the nuclear boundary becomes harder to detect. This intensity deficit makes measuring of nuclear size and intensity unreliable for apoptotic cells in late stages. To optimize live/dead classifying accuracy late in response, we combined Equations (4) and (5). Our final classification rule for dead cells is as follows:


Blue lines are the percentages of cell death (y-axis) based solely on μICTG/nuk and black lines solely on nucleus intensity μInuk. The peak activities measured by either method are separated by more than 24 hours. Hours are plotted on the x-axis.
Selection of morphological thresholds
As discussed earlier, the determination of μI0,CTG/nuk is rather trivial as the CTG signals are well separated in intensities for dead and live cells. To find

Sample histogram plots of nucleus mean intensity for cell lines PARKS (A) and CML1 (B). Values are in log2 scale on the x-axis. Groups of normal cells and cells in pyknosis in (B) are less distinguished when compared to (A).
If a more precise threshold is desired, as maybe in the case of Figure 8B, the threshold is refined by a secondary step by using a semi-automatic selection tool, which we have developed in ImageJ (CellTagger):
Identify cells close to decision boundaries as determined by histograms and mixture Gaussian fit;
Run CellTagger. The above identified cells are marked with yellow outlines (an example is shown in Figure 9A; outlines are obtained from the saved nuclei boundaries);
(A) Example nucleus images. Cells near decision boundaries are marked with yellow outlines. Only a portion of the full-sized image that contains these marked cells is shown. (B) Same image as in (A) after the user has marked dead cells (red), live cells (green), or undecided (remaining yellow outlined).
As the example shows in Figure 9B, an experienced molecular biologist will go through all these cells and mark them in red (dead cells), green (live cells), or leave them as yellow (undecided/ignored);
Repeat this for all the images in the sequence (example in Supplementary File S05.avi);
Collect all new classification labels (dead or live) and refine the thresholds.
After all thresholds are established, we use a rule in Equation (6) and for each cell line and drug, we compute the percentage of dead cells (%Apop) as

Validating classification
To evaluate the thresholds selected and classification accuracy, we use the same ImageJ tool CellTagger after selecting all cells in the image (that is, all cells except those touching image borders, since they will have imprecise size information) and manually assign dead or alive labels by experienced molecular biologists. Due to the large amount of data, this validation process has been carried out randomly, and Figure 10 shows a typical comparison between the percentages calculated from our computer approach and from our two biologists. The decisions are quite comparable.
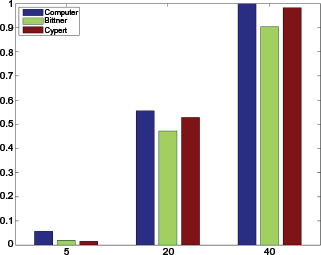
A typical comparison between percentages calculated from our computer approach and by our two biologists.
As one of the most sought-after properties of candidate drug or drug combination in the ability to kill cancer cells completely, we are particularly critical to the accuracy of calling at or close to 100% KE. To that end, we carried out a validation experiment, where we removed the drugs at the end of experiment run and watched whether the remaining cells, if any, started to grow again in 2 days. For drug combination MLN9708 + SH-4-54 on ABRAMS, where all cells are calculated as dead (Fig. 1), the dead cells are washed away (Supplementary Fig. S06B and E) and none of the remaining cells grew back in 2 days (Supplementary Fig. S06C and F). As a comparison, there were plenty of live SH-4-54-only treated ABRAMS cells, 48 hours after SH-4-54 was removed (Supplementary Fig. S07).
Finding time point Te.
The time point
Author Contributions
Conceived and designed the experiments: CS, JMT, ERD, MLB. Analyzed the data: CS, JH, MC, TM, HMW. Wrote the first draft of the manuscript: CS, MLB. Contributed to the writing of the manuscript: CS, JH, MC, ERD, MLB. Agreed with manuscript results and conclusions: CS, JH, MC, TM, HMW, ERD, MLB. Jointly developed the structure and arguments for the paper: CS, JH, MC, ERD, MLB. Made critical revisions and approved final version: CS, JH, MC, ERD, MLB. All authors reviewed and approved of the final manuscript.
Footnotes
Acknowledgment
The authors thank Brendan Horan for his previous work in developing an ImageJ plug-in interface tool as a Helios intern at Translational Genomics Research Institute.