Estrogen is a well-known risk factor for breast cancer. Current models of breast cancer risk prediction are based on cumulative estrogen exposure but do not directly reflect mammary estrogen metabolism or address genetic variability between women in exposure to carcinogenic estrogen metabolites. We are proposing a mathematical model that forecasts breast cancer risk for a woman based on three factors: (1) estimated estrogen exposure, (2) kinetic analysis of the oxidative estrogen metabolism pathway in the breast, and (3) enzyme genotypes responsible for inherited differences in the production of carcinogenic metabolites. The model incorporates the main components of mammary estrogen metabolism, i.e. the conversion of 17β-estradiol (E2) by the phase I and II enzymes cytochrome P450 (CYP) 1A1 and 1B1, catechol-O-methyltransferase (COMT), and glutathione S-transferase P1 (GSTP1) into reactive metabolites, including catechol estrogens and estrogen quinones, such as E2-3,4-Q which can damage DNA. Each of the four genes is genotyped and the SNP data used to derive the haplotype configuration for each subject. The model then utilizes the kinetic and genotypic data to calculate the amount of E2-3,4-Q carcinogen as ultimate risk factor for each woman. The proposed model extends existing models by combining the traditional “phenotypic” measures of estrogen exposure with genotypic data associated with the metabolic fate of E2 as determined by critical phase I and II enzymes. Instead of providing a general risk estimate our model would predict the risk for each individual woman based on her age, reproductive experiences as well as her genotypic profile.
Estrogens have long been recognized as the primary risk factor for the development of breast cancer.1,2 Epidemiologic studies have indicated that breast cancer risk is higher in women with early menarche and late menopause, who have longer exposure to estrogens.3 A pooled analysis of nine prospective studies found that circulating estrogen levels were directly related to risk of breast cancer in postmenopausal women.4 Based on these data, current models of breast cancer risk prediction are mainly based on cumulative estrogen exposure and include such factors as age, age at menarche, and age at first live birth;5,6 (www.cancer.gov/bcrisktool). While all these studies implicate estrogens as risk factor for the development of breast cancer, they leave open two important questions that need to be answered to advance from an empirical, global risk assessment to a truly etiological, individualized assessment. The questions are: (1) How do estrogens cause breast cancer? and (2) Since all women are exposed to estrogens, how do we better delineate risk? To close these gaps in our knowledge we need to explain mechanisms of estrogen carcinogenesis and inter-individual risk variation and our approach is to examine the dynamics of a pathway for estrogen metabolism and use its prediction of the level of DNA corrupting compounds as a predictor of breast cancer risk.
Carcinogenesis is usually viewed as a stepwise process beginning with genotoxic effects (initiation) followed by enhanced cell proliferation (promotion). The main estrogen, 17β-estradiol (E2), is a substrate for the phase I enzymes, cytochrome P450 (CYP) 1A1 and 1B1 and a ligand for the estrogen receptor. In its dual role of substrate and ligand, E2 has been implicated in the development of breast cancer by simultaneously causing DNA damage via its oxidation products, the 2-OH and 4-OH catechol estrogens, and by stimulating cell proliferation and gene expression via the estrogen receptor. Thus, E2 and its oxidative metabolites are unique carcinogens that affect both tumor initiation and promotion.7–9
As shown in Figure 1, E2 is oxidized to catechol estrogens by CYP1A1 and CYP1B1. These enzymes further oxidize the catechol estrogens to semiquinones and quinones. The highly reactive estrogen quinones form Michael addition products with deoxyribonucleosides.10–12 Thus, estrogen quinones share a common feature of many chemical carcinogens, i.e. the ability to covalently modify DNA.13–16 Furthermore, estrogen semiquinones and quinones undergo redox-cycling, which results in the production of reactive oxygen species that can cause oxidative DNA damage.17–19
Oxidative estrogen metabolism causes DNA adduct formation. The estrogen metabolism pathway is regulated by oxidizing phase I and conjugating phase II enzymes. CYP1A1 and CYP1B1 catalyze the oxidation of E2 to catechol estrogens 2-OHE2 and 4-OHE2. The catechol estrogens are either methylated by COMT to methoxyestrogens (2-MeOE2, 2-OH-3-MeOE2, 4-MeOE2) or further oxidized by CYPs to semiquinones (E2-2,3-SQ, E2-3,4-SQ) and quinones (E2-2,3-Q, E2-3,4-Q). The estrogen quinones are conjugated by GSTP1 to GSH-conjugates (2-OHE2-1-SG, 2-OHE2-4-SG, 4-OHE2-2-SG). Alternatively, the quinones can form quinone-DNA adducts (e.g. 4-OHE2-N7-guanine, 2-OHE2-N2-deoxyguano sine) or cause oxidative adducts (e.g. 8-OH-deoxyguanosine) via reactive oxygen species resulting from redox-cycling between semiquinones and quinones. The three adducts and their estrone (E1) and adenine counterparts have been identified in human breast tissues.56,57 Recently, we demonstrated experimentally that CYP1B1-mediated oxidation of E2 in the presence of deoxyguanosine caused the formation of the 4-OHE2-N7-guanine adduct.48 Our results provide direct evidence that metabolism of the parent hormone can initiate DNA damage.
Support for the carcinogenic activity of estrogens and their oxidative products, the catechol estrogens, comes from experiments in animal models. Treatment with either E2 or the 2-OH or 4-OH catechol estrogens caused kidney cancer in male Syrian hamsters and endometrial cancer in female CD1 mice, the latter compounds being the most carcinogenic agents.20–22 However, there is no animal model for estrogen-induced breast cancer and even in the hamster and mouse models the precise mechanism of DNA damage is uncertain. Thus, there is a need to understand estrogen metabolism in the human breast in order to elucidate the role of endogenous and exogenous estrogens in mammary carcinogenesis. To advance this understanding requires not only characterization of the various estrogen metabolites but equally important, a precise definition of the responsible enzymes. Several investigators have proposed a qualitative model of mammary estrogen metabolism regulated by oxidizing phase I and conjugating phase II enzymes.23,24 The oxidative estrogen metabolism pathway starts with E2 and E1, which are oxidized to the 2-OH and 4-OH catechol estrogens by the phase I enzymes CYP1A1 and CYP1B1.25,26 As described above, the P450-mediated estrogen metabolism is expected to lead to the formation of both estrogen and oxidative DNA adducts, all of which have been shown to possess mutagenic potential.27,28 It is postulated that the genotoxicity of the oxidative estrogen metabolism pathway is mitigated by alternate reactions of the metabolites with phase II enzymes. Specifically, catechol-O-methyl transferase (COMT) catalyzes the methylation of catechol estrogens to methoxy estrogens, which lowers the catechol estrogens available for conversion to estrogen quinones.29,30 In turn, the estrogen quinones undergo conjugation with glutathione (GSH) via the catalytic action of glutathione S-transferase GSTP1.31,32 The formation of GSH-estrogen conjugates would reduce the level of estrogen quinones and thereby lower the potential for DNA damage.
The current models of mammary estrogen metabolism have limitations. Firstly, only single enzymes, e.g. CYP1B1 and COMT, have been analyzed to date with simple substrate-product kinetics, which clearly generates an incomplete picture of the metabolic pathway. Secondly, while the model incorporates the functional roles of the phase I and II enzymes, it does so only qualitatively and it remains uncertain how the enzymes interact quantitatively. Third, each of the phase I and II enzymes contains genetic polymorphisms.26,29,33,34 Studies from several laboratories have examined the functional implications of the polymorphisms on estrogen metabolism, again focusing on single enzymes.26,29,30,35,36 Thus, the multitude of potential kinetic reactions resulting from the complex genetic variations of the phase I and II enzymes is completely outside the scope of the current model of estrogen metabolism. In contrast to the relatively small number of functional studies of estrogen metabolism, multiple epidemiological studies have investigated breast cancer risk in relation to genetic variation in the critical enzymes involved in estrogen metabolism with inconsistent findings.37,38 A drawback of any purely genetic assessment is the lack of information about functional interactions inherent in complex metabolic pathways such as the estrogen metabolism pathway. Thus, such studies cannot assess the underlying metabolic interactions in the pathway.39,40 A pathway-based functional and quantitative approach is necessary to overcome the current limitation in genotype assessment.
We have developed an experimental in vitro model of mammary estrogen metabolism, in which we combined purified, recombinant phase I enzymes CYP1A1 and CYP1B1 with the phase II enzymes COMT and GSTP1 to determine how E2 is metabolized.41 We employed both gas and liquid chromatography with mass spectrometry (GC/MS and LC/MS) to measure the parent hormone E2 as well as eight metabolites, i.e. the catechol estrogens, methoxyestrogens, and estrogen-GSH conjugates. With this important experimental data, an in silico model of the metabolic pathway has been developed.42
Methods
A mathematical model for the estrogen metabolism pathway that is shown in Figure 1 can be constructed using some basic assumptions about the kinetics of the reactions in this figure. We assume that each reaction in the pathway (A → B, a generic step in the pathway) is an enzyme-catalyzed reaction of the form: where E denotes the enzyme, C is the enzyme-substrate complex, and ki, i = 1,2,3, are the rate constants of the reaction. For these types of reaction we approximate the kinetics using the quasi-steady state assumption: C = E*A/(Km + A), Km=(k2+k3)/k1, where E* is the initial enzyme concentration. We can “prove” this approximation by looking at the differential equations for A + E:
This system of differential equations yields two conservation laws:
With the conservation laws, we can reduce the four differential equations to two differential equations:
We now assume that the reaction has progressed to the state that
Hence, the formation of B(t) is approximately given by dB/dt ≈ k3 (E0A/Km + A) = kcatE*A/(Km + A) where kcat = k3 and E* = E0 is the initial enzyme level.
More information about the quasi-steady state approximation can be found in Parl et al.43 Using this approach for the individual reactions in Figure 1, we can write down to a system of nonlinear, ordinary differential equations for the concentrations of the compounds in the pathway:
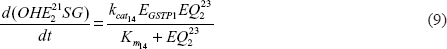
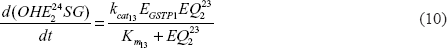
Here and are constants and Eenzyme are the enzyme levels in the reactions. There are parts of the pathway for which kinetic data is not available. In particular, rate constants are not known for the reactions: 2-OHE2 → E2-2,3-SQ → E2-2,3-Q and 4-OHE2 → E2-3, 4-SQ → E2-3, 4-Q reactions. Our first simplification is to collapse these reaction to single reactions, 2-OHE2 → E2-2,3-Q and 4-OHE2 → E2-3,4-Q, respectively. The next simplification is to assume that each of these quinone production reactions satisfy dynamics of the form: where and σ are constants. For the mathematical model to be a tractable computational model of the metabolism pathway, it is necessary to have estimates of these unknown constants. We next look at a technique for estimating , and .
Experimental values for rate constants of the CYP1A1, CYP1B1, COMT, and GSTP1 catalyzed reactions are available.26,29,32,41,42 Furthermore, the concentrations over time for each non-quinone compound in the complete pathway have been measured for a particular starting concentration of . Using this data, a searching algorithm was written in Mathematica (Wolfram Research, Inc.) to find values for and σ in each of the two quinones reactions that fit the experimental data in a certain metric using numerical solutions of the differential equation system. The constants, , and , were obtained in this manner.
Results
Figure 2 shows comparisons between the model (solid curves) and the data41 over a simulation covering 30 minutes for some of the components in the pathway. These simulations used the estimates for , and calculated above as well as the published values of the other kinetic parameters. In the simulations of the pathway it was assumed that initially all quantities are zero, except for . Enzyme concentrations used in the simulation are consistent with those reported previously.41
Comparison of mathematical model with experimental data. The red curves are plots of the solutions to the nonlinear system of differential equations and the blue dots are experimental data.41 As shown, the model allowed simulations of all reactions in the pathway, which agreed well with the experimentally determined results.42
Having all of the parameters of the system, one can view the model as giving functional relations between E2(t) and the estrogen quinone concentrations: and . Figure 3 shows the time-wise buildup and decay of the estrogen quinones. In an attempt to give a simple measure of the quinone concentrations over the course of time, we introduce the Area Under the Curve (AUC) metric: where k = 23, 24 and T = 30 min. It is possible to introduce other measures e.g. which is the highest concentration achieved during the time interval [0, T]. We have chosen the AUC metric because it incorporates both concentration level and time.
Kinetic-genomic modeling of catechol estrogen. (A) 4-OHE2 and estrogen quinone (B) E2-3,4-Q using rate constants for wild-type and variant CYP1A1, CYP1B1, and COMT. The Area Under the Curve = AUC represents the metabolite production over time. Only the highest, lowest, and wild-type (dotted line) AUCs are shown.42
The mathematical model for the estrogen metabolism pathway provides a relationship between an input E2 and two outputs AUC23 and AUC24. It can also be view as connecting the area under the curve outcomes to the kinetic parameters, kcat and Km, embedded in the model. The model permits one to analyze the behavior of the area under curve variables as functions of the kinetic parameters, either for a single step in the pathway or a combination of steps. This analysis allows one to view how variations in the kinetic parameters, which are the result of polymorphism of the enzymes, affect the area under the curve outcomes.
Each of the phase I and II enzymes involved in estrogen metabolism possesses genetic variants that (a) are associated with altered enzyme function and (b) occur in a sizable portion of the population.38,44 We and others have determined the enzymatic rate constants (kcat and Km) of the common CYP1A1, CYP1B1, and COMT variants and compared their activity to the respective wild-type enzymes.26,29,32,45,46 These studies were limited to individual enzyme reactions and did not take the entire estrogen metabolism pathway into account. To obtain a more realistic and inclusive view of estrogen metabolism in the female population, we utilized the model to simulate how variations in the kinetic parameters resulting from polymorphisms of the enzymes impact the metabolite concentrations. We examined 4 CYP1A1, 16 CYP1B1, and 2 COMT alleles. Thus, our simulations are based on the examination of 4.16.2 = 128 genetic combinations to demonstrate the utility of the model. Although each of the metabolites can be modeled, we concentrated our analysis on the catechols and quinones because of their documented carcinogenic activity.15,22
Since women may differ in their combination of enzyme variants, they will have different rate constants, resulting in differences of 4-OHE2 and E2-3,4-Q production. As shown in Figure 3 modeling of the 128 haplotype combinations produced a spectrum of catechol and quinone concentrations over time, as expressed by a range of AUC values. The simulations identified the haplotype combinations producing the highest and lowest AUCs. For example, the maximum AUCs for 4-OHE2 and E2-3,4-Q were produced by the haplotype CYP1A1461Asn-462IleCYP1B148Arg-119Ser-432Val-453Asn-COMT108Met, which were 2.6- and 4.6-fold higher, respectively, than the minimum AUCs produced by haplotype CYP1A1461Thr-462ValCYP1B148Gly-119Ala-432Val-453SerCOMT108Val. While 2.6 to 4.6-fold differences may not appear large, it is important to consider that they impact on lifetime exposure, which is consistent with the hormonal risk model presented by Pike.2
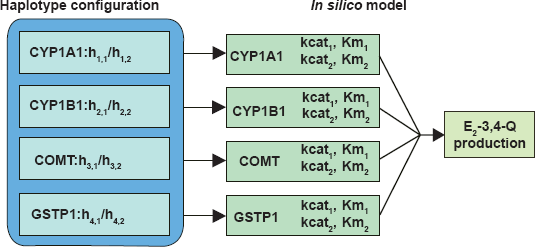
If a subject's haplotypes can be resolved for all genes (i.e. she has at most one heterozygous SNP for each gene), then the in silico model can be used directly to derive the E2-3,4-Q production, as depicted in Figure 4. When a subject's haplotype configurations are uncertain for some genes because of the presence of two or more heterozygous SNPs (e.g. CYP1B1), we first calculate the distribution of all haplotype configurations using PHASE47 (stephenslab.uchicago.edu/software.html). Then we derive the E2-3,4-Q production value for each haplotype configuration, and calculate the weighted average of all E2-3,4-Q production values, using the probabilities of haplotype configurations as weights. It can be shown that this weighted average is the expected E2-3,4-Q production given the genotypes. This way, we incorporate information from all genotyped SNPs and each haplotype configuration is apportioned appropriately. Application of the model to a breast cancer case-control population (438 pre- and postmenopausal women with 221 invasive breast cancer cases and 217 controls) defined the estrogen quinone E2-3,4-Q as a potential breast cancer risk factor. This exploratory analysis identified a subset of women at increased breast cancer risk based on their enzyme haplotype and consequent E2-3,4-Q production.42 Based on the E2-3,4-Q AUC values, cases predominated in the top tier of the population. For example, among the 10 women with the highest E2-3,4-Q values in the entire study population, there were nine cases and one control (p-value = 0.01). These results suggest for the first time the possibility that breast cancer risk prediction may be enhanced by incorporation of inherited differences in estrogen metabolism.
Utilization of in silico model to derive E2-3,4-Q production. Each of the four genes is genotyped for all subjects and the SNP genotype data used to derive the haploype configuration for each subject. The model then calculates the E2-3,4-Q production for each haplotype configuration as well as the weighted average of all E2-3,4-Q production values, using the probabilities of haplotype configurations as weights.
Obviously, the model requires testing and as a first step we have examined the contribution of the estrogen concentration on E2-3,4-Q production and the associated breast cancer risk. Numerous epidemiological studies have implicated estrogens in the development of breast cancer.3 For example, a pooled analysis of nine prospective studies of serum estrogen levels and breast cancer in 2428 postmenopausal women revealed a strong association of serum E2 concentrations with breast cancer risk.4 The relative risk of breast cancer for women whose free E2 levels were in the top quintile was 2.58 compared with 1.00 for those women whose levels were in the bottom quintile. Since the nine studies employed different methods to measure, E2, there were considerable differences in the median E2 values reported. In spite of this variability, the median serum E2 concentrations in seven of the nine studies were higher in the case patients than in the control subjects. To incorporate the different levels into our simulations, we introduced a ratio that is defined as . In Table 1, we summarized the median E2 values for the nine studies as well as the corresponding cases/controls E2 ratios, which ranged from 0.91 to 1.34. These ratios appear rather narrow and are of unknown biological significance. We used the model and our study population to determine whether such seemingly small differences in serum E2 concentrations between cases and controls could influence mammary estrogen metabolism sufficiently to cause significant differences in the production of the carcinogenic E2-3,4-Q. Since serum E2 was not measured in our study population, we used the initial level for the cases and controls from the nine prospective studies to calculate the E2-3,4-Q AUC for the 294 postmenopausal women in our group. There were 144 women with breast cancer and 150 control subjects with average ages of 65.6 and 64.9 years and average body mass indices of 25.7 and 26.0 kg/m2, respectively. In our simulations we varied the E2 ratio between cases and controls from 0.91 to 1.34 and calculated the corresponding E2-3,4-QAUC values. As the . varied, the fraction of cases in the top E2-3,4-Q AUC values of the women also changed. With an E2 Ratio of 0.908 (Rancho Bernardo), only 31 women in the top AUC cases and controls had breast cancer compared to 65 women (Washington Country) at 1.06 (p = 0.037) and 102 (SOF) at 1.34 (p < 0.00001). The results of these simulations demonstrate that relatively small changes in the concentration of the parent hormone E2 result in markedly increased production of the carcinogenic estrogen quinone metabolite, E2-3,4-Q, which, in turn, is reflected in a higher fraction of women with breast cancer in the top tier of our study population. Thus, testing of our model with estrogen concentrations reported in the literature confirms the striking influence of serum E2 concentrations on breast cancer risk. Importantly, the model offers a risk assessment of individual women by combining the hormone level with the genotype.
Correlation of postmenopausal serum estradiol concentration by study and case-control status with breast cancer risk. Controls (m in number) and cases (n in number) are individuals with the top AUC values (m + n) in the simulation model. The case-control data is from42 and the E2 Ratio is taken from a reanalysis of nine pooled prospective studies.4 The ratio of all centers is the average ratio of the nine centers.
Study, country
Estradiol pmol/L
m
n
n/(m + n)
Cases
Controls
Ratio
Cases
Controls
% Cases
p-value
Columbia, MO United States
55.1
51.4
1.07
63
42
60.0
0.034
Guernsey, United Kingdom
45.5
35.0
1.30
100
4
96.2
<0.001
Nurses' Health Study, United States
29.4
25.7
1.14
77
31
71.3
<0.001
NYU WHS, United States
134
101
1.33
102
4
96.2
<0.001
ORDET, Italy
21.9
21.7
1.01
59
55
51.7
>0.1
Rancho Bernardo, United States
36.7
40.4
0.908
31
73
29.8
>0.1
RERF, Japan
63.1
64.5
0.978
39
69
36.1
>0.1
SOF, United States
29.4
22.0
1.34
102
4
96.2
<0.001
Washington Country, United States
62.4
58.7
1.06
65
44
59.6
0.037
Average of all centers
1.126
78
35
69.0
<0.001
Discussion
A strength of the in silico model is that it can incorporate each woman's actual lifetime endogenous and exogenous estrogen exposures, in addition to her genotype, when predicting cumulative E2-3,4-Q exposure. This is schematically shown in Figure 5, which displays the interaction of estrogens, enzyme genotypes, and resulting E2-3,4-Q production as a three-dimensional graph. The graph is built on the two-dimensional Figure 3, in which we used a fixed E2 level to model the E2-3,4-Q AUC for wild-type and variant enzyme genotypes and displayed only the lowest, highest, and wild-type E2-3,4-Q AUCs. In the three-dimensional graph, we plot the available genotypes, from lowest to highest, separated into quintiles based on their respective E2-3,4-Q production. A new component in the three-dimensional graph is the variation in E2 concentration. As illustrated in the overall pathway in Figure 1 and in experimental studies, the input concentration of the parent hormone E2 determines the output concentration of the oxidative metabolites, such as 4-OHE2 and E2-3,4-Q.26,29,32,45,48 Thus, in the graph we display estrogen exposure in quintiles. Estrogen exposure can be represented by actual E2 values, measured in pmol/L, in combination with semiquantitative estimates each woman's overall exposure to estrogen. The latter is derived by taking into account her total years of ovulation as a function of current age, age at menarche, age at menopause, numbers of full-term pregnancies and lactation experience for each, and the dosage and duration of the use of exogenous estrogens. With regard to exogenous estrogens, all estrogens including equine estrogens used in hormone replacement therapy are metabolized via the same CYP-mediated oxidative pathway to generate catechols and quinones, which, in turn, cause DNA damage. For example, cell culture experiments showed that 4-OH-equilenin via its quinone induced DNA damage in breast cancer cell lines and cellular transformation in vitro.49,50 Thus, as far as the model is concerned, exogenous and endogenous estrogens can be combined although their precise contribution to estrogen exposure and the production of carcinogenic metabolites is presently unknown.
Three-dimensional graph displaying estrogen metabolomic-genomic model of breast cancer risk. The risk is represented by the amount of carcinogenic estrogen quinone, E2-3,4-Q AUC, which is produced by the metabolism of estrogen catalyzed by the enzymes CYP1A1, CYP1B1, and COMT. In theory, all enzyme genotype combinations could be plotted. However for clarity, we have plotted representative combinations from lowest to highest, separated into quintiles based on their respective E2-3,4-Q production: (1) CYP1A1461Thr-462ValCYP1B148Gly-119Ala-432Val-453SerCOMT108Val (2) CYP1A1461Thr-462ValCYP1B148Arg-119Ala-432Val-453AsnCOMT108Met, (3) CYP1A14617-Thr-462IleCYP1B148Arg-119Ala-432Val-453SerCOMT108Val, (4) CYP1A1461Thr-462IleCYP1B148Arg -119Ala-432Val-453SerCOMT108Met, (5) CYP1A1461Asn-462IleCYP1B148Arg-119Ser-432Val-453AsnCOMT108Met. Following the characterization of GSTP1 variants, we will include GSTP1 genotype data in the model. Cumulative estrogen exposure is displayed in quintiles. Actual E2 values, measured in pmol/L, could be plotted, in combination with semi-quantitative estimates of each woman's overall exposure to estrogen. The latter is derived by taking into account her total years of ovulation as a function of current age, age at menarche, age at menopause, numbers of full-term pregnancies and lactation experience for each, and the dosage and duration of the use of exogenous estrogens. (The authors acknowledge work of Eric Parl in the design and preparation of this figure).
In designing Figure 5, we assumed that the difference in estrogen exposure between individual women is no more than twofold, with the quintiles 1.0, 1.25, 1.5, 1.75, 2.0. We chose this two-fold difference based on the range of median serum E2 values seen in post-menopausal women4 and the variation in mammary tissue E2 concentrations.5 This range is conservative since up to fivefold differences have been reported.52 Regardless of the scale used for the estrogen exposure axis, the production of carcinogenic E2-3,4-Q would be expected to be greater in women with more endogenous (more ovulatory cycles) or exogenous (hormone replacement therapy, oral contraceptives) estrogen exposure. It is evident from Figure 5 that our in silico model extends existing models by combining the traditional “phenotypic” measures of estrogen exposure with genotypic data. It is also evident from the 3D graph that the combined phenotypic and genotypic data appear to have not just an additive, but also a multiplicative effect on E2-3,4-Q production.
Current models of breast cancer risk prediction are mainly based on cumulative estrogen exposure but do not reflect mammary estrogen metabolism;16 (www.cancer.gov/bcrisktool). Moreover, they do not address genetic variability between women in exposure to estrogen metabolites. Our model addresses the unique genetic trait of each woman and combines the genetic information with the metabolomic information in order to predict individual-level mammary estrogen metabolism. Some genetic traits are currently available in the patient care setting, such as BRCA and CYP2D6 testing. The availability of rapid genetic testing for BRCA1 and BRCA2 mutations has made it possible to follow unaffected carriers in greater numbers and to search for inherited mutations in women with a severe family history of breast cancer. The potential effect of CYP2D6 genetic variants on clinical response to tamoxifen treatment in breast cancer patients has gained much interest.53 The Food and Drug Administration recommended an update in the tamoxifen package insert in 2006 to reflect the increased risk of breast cancer recurrence in postmenopausal estrogen receptor-positive patients, who are CYP2D6 poor metabolizers. Thus, the CYP2D6 genotype has the potential to become a useful predictive marker for tamoxifen response. Certain characteristics are beneficial for a marker to become successful clinically.54 Testing of this marker should be cost-effective as well as easy to apply in daily practice, both of which are increasingly realized for DNA analysis. Thus, analysis of multiple genes encoding the enzymes in the estrogen metabolism pathway can readily be achieved. Estrogen is a universal breast cancer risk factor; by helping to define high-risk subgroups, the proposed model should advance the overall goal of reducing breast cancer mortality through improved screening and the early detection and treatment of disease. Rates of obesity, an important source of estrogen after menopause are on the rise in most of the world, underscoring the importance of establishing the impact of estrogen metabolites on breast cancer risk before and after menopause. Women who carry a germline mutation of BRCA1 frequently develop breast cancer at an early age. However, in any given kindred the age of onset can vary substantially and an important unresolved question is the extent to which other risk factors modify the cancer risk in carriers. Estrogen exposure appears to play an important role since prophylactic oophorectomy is associated with a significant reduction in the risk of breast cancer.55 A practical clinical application of the model in the premenopausal age group would be the differentiation of BRCA1 carriers into low- and high-risk based on their genetic profile of estrogen metabolism. Another clinical application of the model would be in the postmenopausal age group with the distinction of low- and high-risk women. The former could benefit from hormone replacement therapy whereas the latter should avoid such treatment.
In summary, our in silico model integrates pathway-specific genetic testing with diverse types of data and for the first time offers the opportunity to combine exposure, metabolic, and genetic data in assessing estrogens in relation to breast cancer risk. In order to achieve such comprehensive risk assessment, the model will require extensive validation.
Disclosure
The authors report no conflicts of interest.
Nomenclature
Symbol
Quantity
Symbol
Quantity
E2
17β-estradiol
ECYP1A1, ECYP1B1, ECOMT, EGSTP1
Enzyme Concentrations
2–OHE2-catechol estrogen
Rate Constants
4–OHE2-catechol estrogen
Rate Constants
2-MeOE2-methoxyestrogen
k1and k2
Rate Constants for decay of Quinones
2-OH-3-MeOE2-methoxyestrogen
α and β
Hill exponents
4-MeOE2-methoxyestrogen
Rate Constants for Quinone Formation
2-OHE2-1-SG-GSH-conjugate
2-OHE2-4-SG-GSH-conjugate
4-OHE2-2-SG-GSH-conjugate
E2-2,3-Q-quinone
E2-3,4-Q-quinone
t
time
Area under the Curve (AUC)
Footnotes
Acknowledgments
Supported in part by NIH 1R01CA/ES83752, 5U54CA113007.
References
1.
MacMahonB., FeinleibM.Breast cancer in relation to nursing and menopausal history.J Natl Cancer Inst.1960; 24: 733–53.
2.
PikeM.C., KrailoM.D., HendersonB.E.‘Hormonal’ risk factors, ‘breast tissue age’ and the age-incidence of breast cancer.Nature.1983; 303: 767–70.
The Endogenous Hormones and Breast Cancer Collaborative Group.Endogenous sex hormones and breast cancer in postmenopausal women: Reanalysis of nine prospective studies.J Natl Cancer Inst.2002; 94: 606–16.
5.
GailM.H., BrintonL.A., ByarD.P.Projecting individualized probabilities of developing breast cancer for white females who are being examined annually.J Natl Cancer Inst.1989; 81: 1879–86.
6.
RockhillB., SpiegelmanD., ByrneC.Validation of the Gail et al model of breast cancer risk prediction and implications for chemoprevention.J Natl Cancer Inst.2001; 93: 358–66.
7.
ParlF.F.Estrogens, Estrogen Receptor and Breast Cancer.Amsterdam: IOS Press. 2000.
8.
YueW., SantenR.J., WangJ.P.Genotoxic metabolites of estradiol in breast: potential mechanism of estradiol induced carcinogenesis.J Steroid Biochem Mol Biol.2003; 86: 477–86.
9.
YagerJ.D., DavidsonN.E.Estrogen carcinogenesis in breast cancer.New Engl J Med.2006; 354: 270–82.
10.
StackD.E., ByunJ., GrossM.L.Molecular characteristics of catechol estrogen quinones in reactions with deoxyribonucleosides.Chem Res Toxicol.1996; 9: 851–9.
11.
AkanniA., Abul-HajjY.J.Estrogen-nucleic acid adducts: reaction of 3,4-estrone o-quinone radical anion with deoxyribonucleosides.Chem Res Toxicol.1997; 10: 760–6.
12.
BoltonJ.L., PishaE., ZhangF.Role of quinoids in estrogen carcinogenesis.Chem Res Toxicol.1998; 11: 1113–27.
13.
BoltonJ.L., TrushM.A., PenningT.M.Role of quinones in toxicology.Chem Res Toxicol.2000; 13: 135–60.
14.
CavalieriE.L., LiK.M., BaluN.Catechol ortho-quinones: the electrophilic compounds that form depurinating DNA adducts and could initiate cancer and other diseases.Carcinogenesis.2002; 23: 1071–7.
15.
LiK.M., TodorovicR., DevanesanP.Metabolism and DNA binding studies of 4-hydroxyestradiol and estradiol-3,4-quinone in vitro and in female ACI rat mammary gland in vivo.Carcinogenesis, 2004; 25: 289–97.
16.
GaikwadN.W., YangL., MutiP.The moldeuclar etiology of breast cancer: Evidence from biomarkers of riks.Int J Cancer.2008; 122: 1949–57.
17.
LiehrJ.G., RoyD.Free radical generation by redox cycling of estrogens.Free Radical Biol Med.1990; 8: 415–23.
18.
NutterL.M., WuY.Y., NgoE.O.An o-quinone form of estrogen produces free radicals in human breast cancer cells: correlation with DNA damage.Chem Res Toxicol.1994; 7: 23–8.
19.
HanX., LiehrJ.G.Microsome-mediated 8-hydroxylation of guanine bases of DNA by steroid estrogens: correlation of DNA damage by free radicals with metabolic activation to quinones.Carcinogenesis.1995; 16: 2571–4.
20.
LiehrJ.G., FangW.F., SirbaskuD.A.Carcinogenicity of catechol estrogens in Syrian hamsters.J Steroid Biochem.1986; 24: 353–6.
21.
LiJ.J., LiS.A.Estrogen carcinogenesis in Syrian hamster tissues: role of metabolism.Fed Proc.1987; 46: 1858–63.
22.
NewboldR.R., LiehrJ.G.Induction of uterine adenocarcinoma in CD-1 mice by catechol estrogens.Cancer Res.2000; 60: 235–7.
CavalieriE.L., StackD.E., DevanesanP.D.Molecular origin of cancer: catechol estrogen-3,4-quinones as endogenous tumor initiators.Proc Natl Acad Sci U S A.1997; 94: 10937–42.
25.
HayesC.L., SpinkD.C., SpinkB.C.17β-estradiol hydroxylation catalyzed by human cytochrome P450 1B1.Proc Natl Acad Sci U S A.1996; 93: 9776–81.
26.
HannaI.H., DawlingS., RoodiN.Cytochrome P450 1B1 (CYP1B1) pharmacogenetics: association of polymorphisms with functional differences in estrogen hydroxylation activity.Cancer Res.2000; 60: 3440–4.
27.
ShibutaniS, TakeshitaM., GrollmanA.Insertion of specific bases during DNA synthesis past the oxidation-damaged base 8-oxodG.Nature.1991; 349: 431–4.
28.
TerashimaI., SuzukiN., ShibutaniS.Mutagenic properties of estrogen-quinone derived DNA adducts in Simian kidney cells.Biochemistry.2001; 40: 166–72.
29.
DawlingS., RoodiN., MernaughR.L.Catechol-O-methyltransferase (COMT)-mediated metabolism of catechol estrogens: comparison of wild-type and variant COMT isoforms.Cancer Res.2001; 61: 6716–22.
30.
GoodmanJ.E., JensenL.T., HeP.Characterization of human soluble high and low activity catechol-O-methyltransferase catalyzed catechol estrogen methylation.Pharmacogenetics.2002; 12: 517–28.
31.
StrangeR.C., SpiteriM.A., RamachandranS.Glutathione-S-transferase family of enzymes.Mutat Res.2001; 482: 21–6.
32.
HacheyD.L., DawlingS., RoodiN.Sequential action of phase I and II enzymes cytochrome P450 1B1 and glutathione S-transferase P1 in mammary estrogen metabolism.Cancer Res.2003; 63: 8492–9.
33.
CascorbiI., BrockmollerJ., RootsI.A C4887A polymorphism in Exon 7 of Human CYP1A1: population frequency, mutation linkages, and impact on lung cancer suseptibility.Cancer Res.1996; 56: 4965–9.
34.
Ali-OsmanF., AkandeO., AntounG.Molecular cloning, characterization, and expression in Escherichia coli of full-length cDNAs of three human glutathione S-transferase Pi gene variants.J Biol Chem.1997; 15: 10004–12.
35.
LiD.N., SeidelA., PritchardM.P.Polymorphisms in P450 CYP1B1 affect the conversion of estradiol to the potentially carcinogenic metabolite 4-hydroxyestradiol.Pharmacogenetics.2000; 10: 343–53.
36.
ShimadaT., WatanabeJ., InoueK.Specificity of 17β-oestradiol and benzo[a]pyrene oxidation by polymorphic human cytochrome P4501B1 variants substituted at residues 48, 119 and 432.Xenobiotica.2001; 31: 163–76.
37.
DunningA.M., HealeyC.S., PharoahP.D.P.A systematic review of genetic polymorphisms and breast cancer risk.Cancer Epidemiol Biomarkers Prev.1999; 8: 843–54.
38.
MitrunenK., HirvonenA.Molecular epidemiology of sporadic breast cancer. The role of polymorphic genes involved in oestrogen biosynthesis and metabolism.Mutation Res.2003; 544: 9–41.
39.
RitchieM.D., HahnL.W., RoodiN.Multifactor-dimensionality reduction reveals high-order interactions among estrogen-metabolism genes in sporadic breast cancer.Am J Hum Genet.2001; 69: 138–47.
40.
ThomasD.C.The need for a systematic approach to complex pathways in molecular epidemiology.Cancer Epidemiol Biomarkers Prev.2005; 14: 557–9.
41.
DawlingS., HacheyD.L., RoodiN.In vitro model of mammary estrogen metabolism: Structural and kinetic differences in mammary metabolism of catechol estrogens 2- and 4-hydroxyestradiol.Chem Res Toxicol.2004; 17: 1258–64.
42.
CrookeP.S., RitchieM.D., HacheyD.L.Estrogens, enzyme variants, and breast cancer: A risk model.Cancer Epidemiol Biomarkers Prev.2006; 15: 1620–9.
43.
ParlF.F., CrookeP.S., ContiD.V., ThomasD.C.2008. Pathway-based Methods in Molecular Cancer Epidemiology. In: Molecular Epidemiology. Applications in Cancer and Other Human Diseases. Eds. RebbeckT.R., AmbosoneC.B., ShieldsP.G.Informa Healthcare Publisher, New York (ISBN-101-4200-5291-8); p. 189–204
44.
GarteS., GaspariL., AlexandrieA.K.Metabolic gene polymorphism frequencies in control populations.Cancer Epidemiol Biomarkers Prev.2001; 10: 1239–48.
45.
DawlingS., RoodiN., ParlF.F.Methoxyestrogens exert feedback inhibition on cytochrome P450 1A1 and 1B1.Cancer Res.2003; 63: 3127–32.
46.
LewisD.F.V., GillamE.M.J., EverettS.A.Molecular modelling of human CYP1B1 substrate interactions and investigation of allelic variant effects on metabolism.Chem Biol Interact.2003; 145: 281–95.
47.
StephensM., SmithN.J., DonnellyP.A new statistical method for haplotype reconstruction from population data.Am J Hum Genet.2001; 68: 978–89.
ChenY., LieuX., PishaE.A metabolite of equine estrogens, 4-hydroxyequilenin, induces DNA damage and apoptosis in breast cancer cell lines.Chem Res Toxicol.2000; 13: 342–50.
50.
PishaE., LuiX., ConstantinouA.I.Evidence that a metabolite of equine estrogens, 4-hydroxyequilenin, induces cellular transformation in vitro.Chem Res Toxicol.2001; 14: 82–90.
51.
CastagnettaL.A.M., GranataO.M., TrainaA.Tissue content of hydroxyestrogens in relation to survival of breast cancer patients.Clin Cancer Res.2002; 8: 3146–55.
52.
RoganE.G., BadawiA.F., DevanesanP.D.Relative imbalances in estrogen metabolism and conjugation in breast tissue of women with carcinoma: potential biomarkers of susceptibility to cancer.Carcinogenesis.2003; 24: 697–702.
53.
DezentjeV.O., GuchelaarH.J., NortierJ.W.R.Clinical implications of CYP2D6 genotyping in tamoxifen reatment for breast cancer.Clin Cancer Res.2009; 15: 15–21.
54.
SwenJ.J., HuizingaT.W., GelderblomH.Translating pharmacogenomics: Challenges on the road to the clinic.PLoS.2007; 4: e209.
55.
HaberD.Prophylactic oophorectomy to reduce the risk of ovarian and breast cancer in carriers of BRCA mutations.N Engl J Med.2002; 346: 1660–2.
56.
EmbrechtsJ., LemiereF., Van DongenW.Detection of estrogen DNA-adducts in human breast tumor tissue and healthy tissue by combined nano LC-nano ES tandem mass spectrometry.J Am Soc Mass Spectrom.2003; 14: 482–91.
57.
MarkushinY., ZhongW., CavalieriE.L.Spectral characterization of catechol estrogen quinone (CEQ)-derived DNA adducts and their identification in human breast tissue extract.Chem Res Toxicol.2003; 16: 1107–17.