
Abstract
Background:
Evaluation of gene interaction models in cancer genomics is challenging, as the true distribution is uncertain. Previous analyses have benchmarked models using synthetic data or databases of experimentally verified interactions – approaches which are susceptible to misrepresentation and incompleteness, respectively. The objectives of this analysis are to (1) provide a real-world data-driven approach for comparing performance of genomic model inference algorithms, (2) compare the performance of LASSO, elastic net, best-subset selection,
Methods:
Five large
Results:
Conclusions:
This analysis explores a novel approach for comparisons of model selection approaches in real genomic data from 5 cancers. Our benchmarking datasets have been made publicly available for use in future research. Our findings support the use of
Keywords
Author Summary
Regression models are frequently used in cancer genomics, where they provide insight into the interactions between genes. Sparse regression models were developed to allow modelling of a large set of variables with a small number of samples – a scenario encountered frequently in genomics. However, evaluation of genomic model structures remains challenging, due to uncertainty regarding the true system of interactions. Previous studies have compared methods with synthetic data, which may not reflect the challenges of real-world data. In this study, genomic datasets were identified which contained enough samples to provide reasonable estimates of the true structures – which were used as ‘gold-standards’. Sparse regression methods were tasked with estimating the true structure given a small proportion of the available samples, allowing for comparison against the gold standards.
Our results show that the interaction strengths estimated by the
Background
Regression models in cancer genomics
High-dimensional regression problems are ubiquitous in modern oncological research, as datasets often contain fewer observations than variables.1-7 The tractability of penalised regression approaches in this setting has led to a large volume of research into their applications.1,7-9 Penalised regression offers robust predictions in high dimensional data and mechanistic insights through the estimated coefficient vector.1,7
Penalised regression
The inverse covariance matrix,

Here, notation is conventionally abused such that the

Ridge regression
17
penalises the model by the

Ridge regression partially alleviates instability under collinearity by constraining coefficient magnitude.
16
The Least Absolute Selection and Shrinkage Operator (LASSO)
11
penalty penalises the model by the
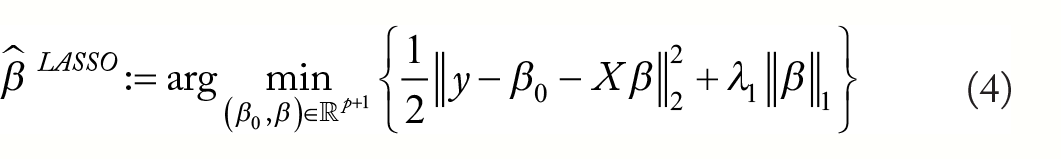
The LASSO approach has ‘oracle’ properties under some conditions, meaning that predictions are nearly as good as if the true set of predictor variables were known.18,19 An additional benefit of LASSO shrinkage is a tendency to shrink small coefficients to zero, leading to a ‘sparse’

Thus, for some

Best subset selection be may be approximated through
Assessing variable selection in genomic models
The true generating distribution for observational biological data is typically uncertain, complicating validation of estimated coefficient vectors. Consequently, many model assessments have employed synthetic9,15,24-27 or semi-synthetic1,10,28-30 datasets to assess variable selection performance. Real data analyses have focussed primarily on the models’ predictive capacity.31-33 Accurate predictions may not guarantee correct model structure, especially in the highly collinear conditions commonly encountered in genomics. The representativeness of synthe-tic datasets is both uncertain and untestable. 29 Further-more, results of these studies have been discordant, suggesting dependence on the benchmark datasets and validation techniques.9,10
Genomic databases such as REACTOME
34
and KEGG
35
contain experimentally verified interactions, which may be used to externally validate genomic model structure. This approach has been used in previous analyses27,29,36,37 and is limited by the uncertain completeness of such databases. Furthermore, the activity profile of interactions between a given set of genes may change with experimental conditions and unobserved confounders.38,39 Consequently, the set of active predictors for a specific dataset may not align exactly with a static database. Finally, effect sizes may not be comparable between documented interactions, precluding the assessment of model coefficients by this method. Data-partitioning facilitates model validation without ground truth data, by assessing model generalisability to unseen observations. As training and validation observations are sampled from the same data, their distribution is asymptotically identical. However, the distribution may be difficult to estimate when
Given the limitations of currently available methods for assessment of variable selection performance in genomic data, an urgent need exists for a novel approach.
Study objectives
The primary objectives of this study were to:
Provide a real-world data-driven approach for comparing performance of high dimensional model inference algorithms in cancer genomics for both prediction and variable selection. We evaluate models by simulating
Compare the performance of penalised linear regression methods for prediction and variable selection.
Compare algorithmic selection by internal cross-validation to preselection according to performance in external test datasets under our validation approach.
These objectives are realised by subsampling real
Materials and Methods
Data
Five cancer genomics datasets were extracted from Gene Expression Omnibus 40 with the GEOquery library. 41 Local institutional review board approval and informed participant consent were documented in each data publication.42-46
GSE73002
GSE73002 42 contains serum miRNA expression profiles for 4113 individuals; 1280 with breast cancer, 54 with benign breast disease, 63 with non-benign breast disease, 451 with various other cancers and 2836 non-cancer controls. Participants with breast cancer were recruited through admissions and referrals to the National Cancer Centre Hospital Japan between 2008 and 2014. Exclusion criteria were (1) administration of medication prior to serum sampling and (2) advanced cancer in other organs. Controls were recruited from (1) National Cancer Centre Biobank, Yokohama Minoru clinic and the Toray Industries staff. Samples from individuals with non-benign breast diseases and other cancers were extracted from the National Cancer Centre Biobank. miRNA expression was measured with was collected on the Toray Industries 3D-Gene Human miRNA Oligo Chip microarray.
GSE137140
GSE137140 43 contains serum miRNA expression profiles for lung cancer patients. About 1566 pre-operative and 180 post-operative samples are available, in addition to 2178 samples from patients without cancer, collected from the National Cancer Centre Japan and the Yokohama Minoru Clinic. Exclusion criteria were (1) miRNA expression quality check failure, (2) history of other malignancy, (3) missing clinical information, (4) pre-collection therapy and (5) over 180 days had passed between collection and surgery. miRNA expression was measured with was collected on the Toray Industries 3D-Gene Human miRNA Oligo Chip microarray.
GSE103322
GSE103322 44 contains full length single-cell RNAseq data from 5902 cells extracted from 18 patients with stage I to IV squamous cell carcinoma (SCC) of the oral cavity at the Massachusetts Eye and Ear Infirmary. Tissue samples were extracted from surgical biopsies of the primary tumour or lymph node. Sequencing was performed on the Illumina Nextseq 500 platform and transcript-per-million values reported.
GSE146026
GSE146026 45 contains single-cell RNAseq data from 22 ascites samples in 11 patients with high-grade serous ovarian cancer at Brigham and Women’s Hospital and the Dana-Farber Cancer Institute. About 9609 CD45+ depleted samples, profiled with 10× were included in this analysis. Sequencing was performed on the Illumina NextSeq 500 platform and transcript-per-million values reported.
GSE89567
GSE89567 46 contains 6341 single-cell RNAseq profiles from patients with isocitrate dehydrogenase mutant astrocytoma at Massachusetts General Hospital. Tumour tissue was collected from surgical resections and malignancy confirmed under frozen section. Following disaggregation, profiling was performed by Smart-seq2. Sequencing was performed on the Illumina NextSeq 500 and transcript-per-million values reported.
Data preprocessing
Where datasets had

Here

Here

Experiment setup
In each experiment, 500 design variables and a response were randomly selected from the available gene expression variables in 1 of the 5 datasets. A small proportion of the observations
Penalised regression methods applied in this analysis.

Metrics
Model assessment metrics and notation followed previous comparative analyses.9,10 As the true coefficient vector,

Thus,

Higher PVE indicates superior fit, and PVE is limited by the signal to noise ratio (SNR) such that 9 :

Relative risk (RR) was employed as an performance metric in Bertsimas’ analysis. 10 Optimal relative risk is 0 and nullity is 1.

Relative test error (RTE) compares error to the noise variance:

Following calls for model coefficient similarity assessment,
9
we measured the cosine similarity of

Active (non-zero) variable selection performance was also estimated under

Significance was adjusted for multiple comparisons using false-discovery-rate (FDR) control
53
and predictors were classified according to a cutoff

Graphical visualisation of variable selection validation method. ‘Gold-standard’ regression models were trained on subspaces of large genomic datasets (
To evaluate our model validation approach, we deployed it as a penalty preselection method, comparing it to traditional selection by minimisation of the internal cross-validation error. For each experiment, for each of 3 comparison metrics (PVE, F1 and coefficient similarity), a penalisation method was ‘preselected’ according to performance in experiments of equivalent sample size in the other 4 datasets. In each relevant experiment, penalisation methods’ performances were ranked and the method with the lowest rank aggregate performance was selected. The test performance of this method was compared to that of the penalisation method which yielded the lowest mean squared error on internal cross-validation. Overall performance of preselected penalties was compared to internal cross-validation selected penalties using a 2-sided paired t-test over all 3000 experiments.
Results
Experiment characteristics
Experiments represented a broad range of signal:noise ratios (Median: 0.94, IQR: [0.38, 2.68]), with high SNR in experiments sampled from GSE73002 (Median: 12.03, IQR: [4.69, 28.34]), intermediate SNR in GSE137140 (Median: 1.58, IQR: [1.16, 2.41]) and low SNRs in GSE103322 (Median: 0.47, IQR: [0.31, 0.85]), GSE146026 (Median: 0.39, IQR: [0.23, 0.77]) and GSE89567 (Median: 0.44, IQR: [0.31, 0.71]). The number of significant coefficients in each experiment was typically small (Median: 7.00, IQR: [1.00, 17.00]) and followed a right-skewed distribution (95th Quantile: 40.00, Max: 106.00). This is consistent with the scale-free property of genomic networks, in which a small number of genes have many interactions.
Predictive performance
Predictive performance metrics are provided in Figure 2 and Table 2.
Predictive performance of each penalisation method.
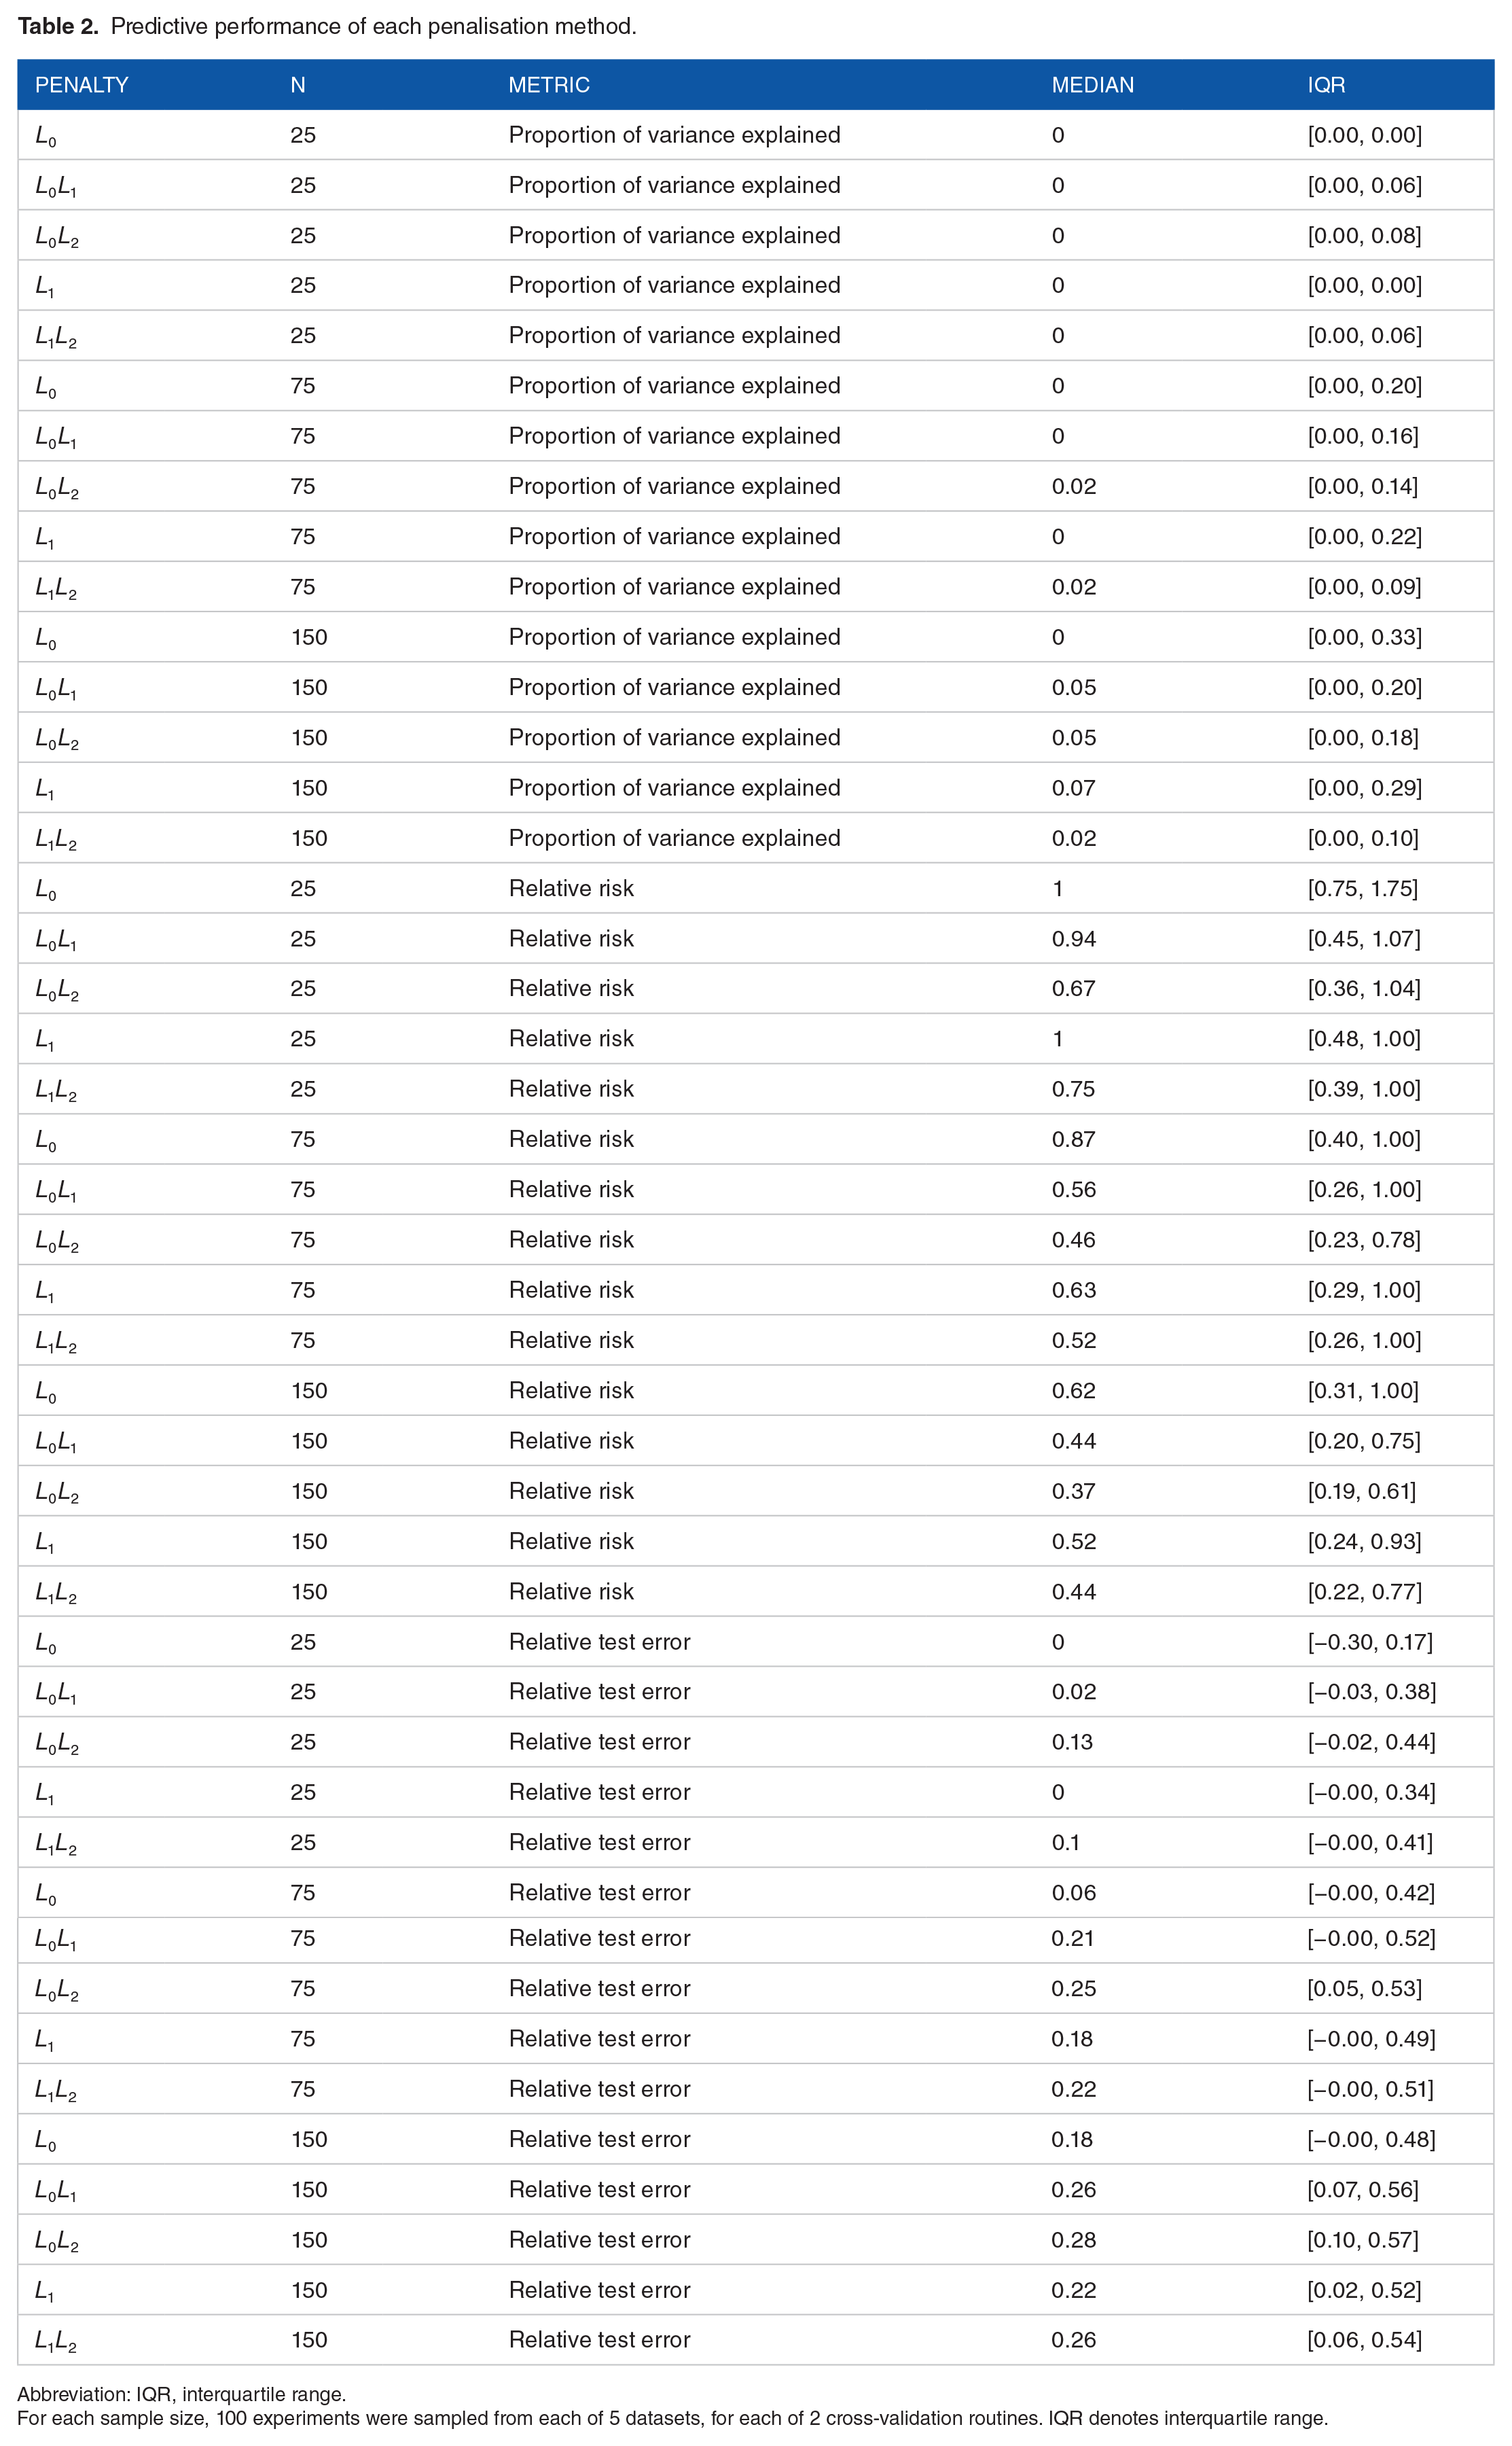
Abbreviation: IQR, interquartile range.
For each sample size, 100 experiments were sampled from each of 5 datasets, for each of 2 cross-validation routines. IQR denotes interquartile range.

Test predictive performance. Medians are represented by boxplot centrelines; first and third quartiles by hinges; and minima and maxima by whiskers.

Proportion of variance explained in test observations versus signal:noise ratio. Signal:noise ratio was estimated by the residuals of the gold standard models fitted to the complete dataset
Variable selection
Variable selection performance metrics are provided in Figure 4 and Table 3.
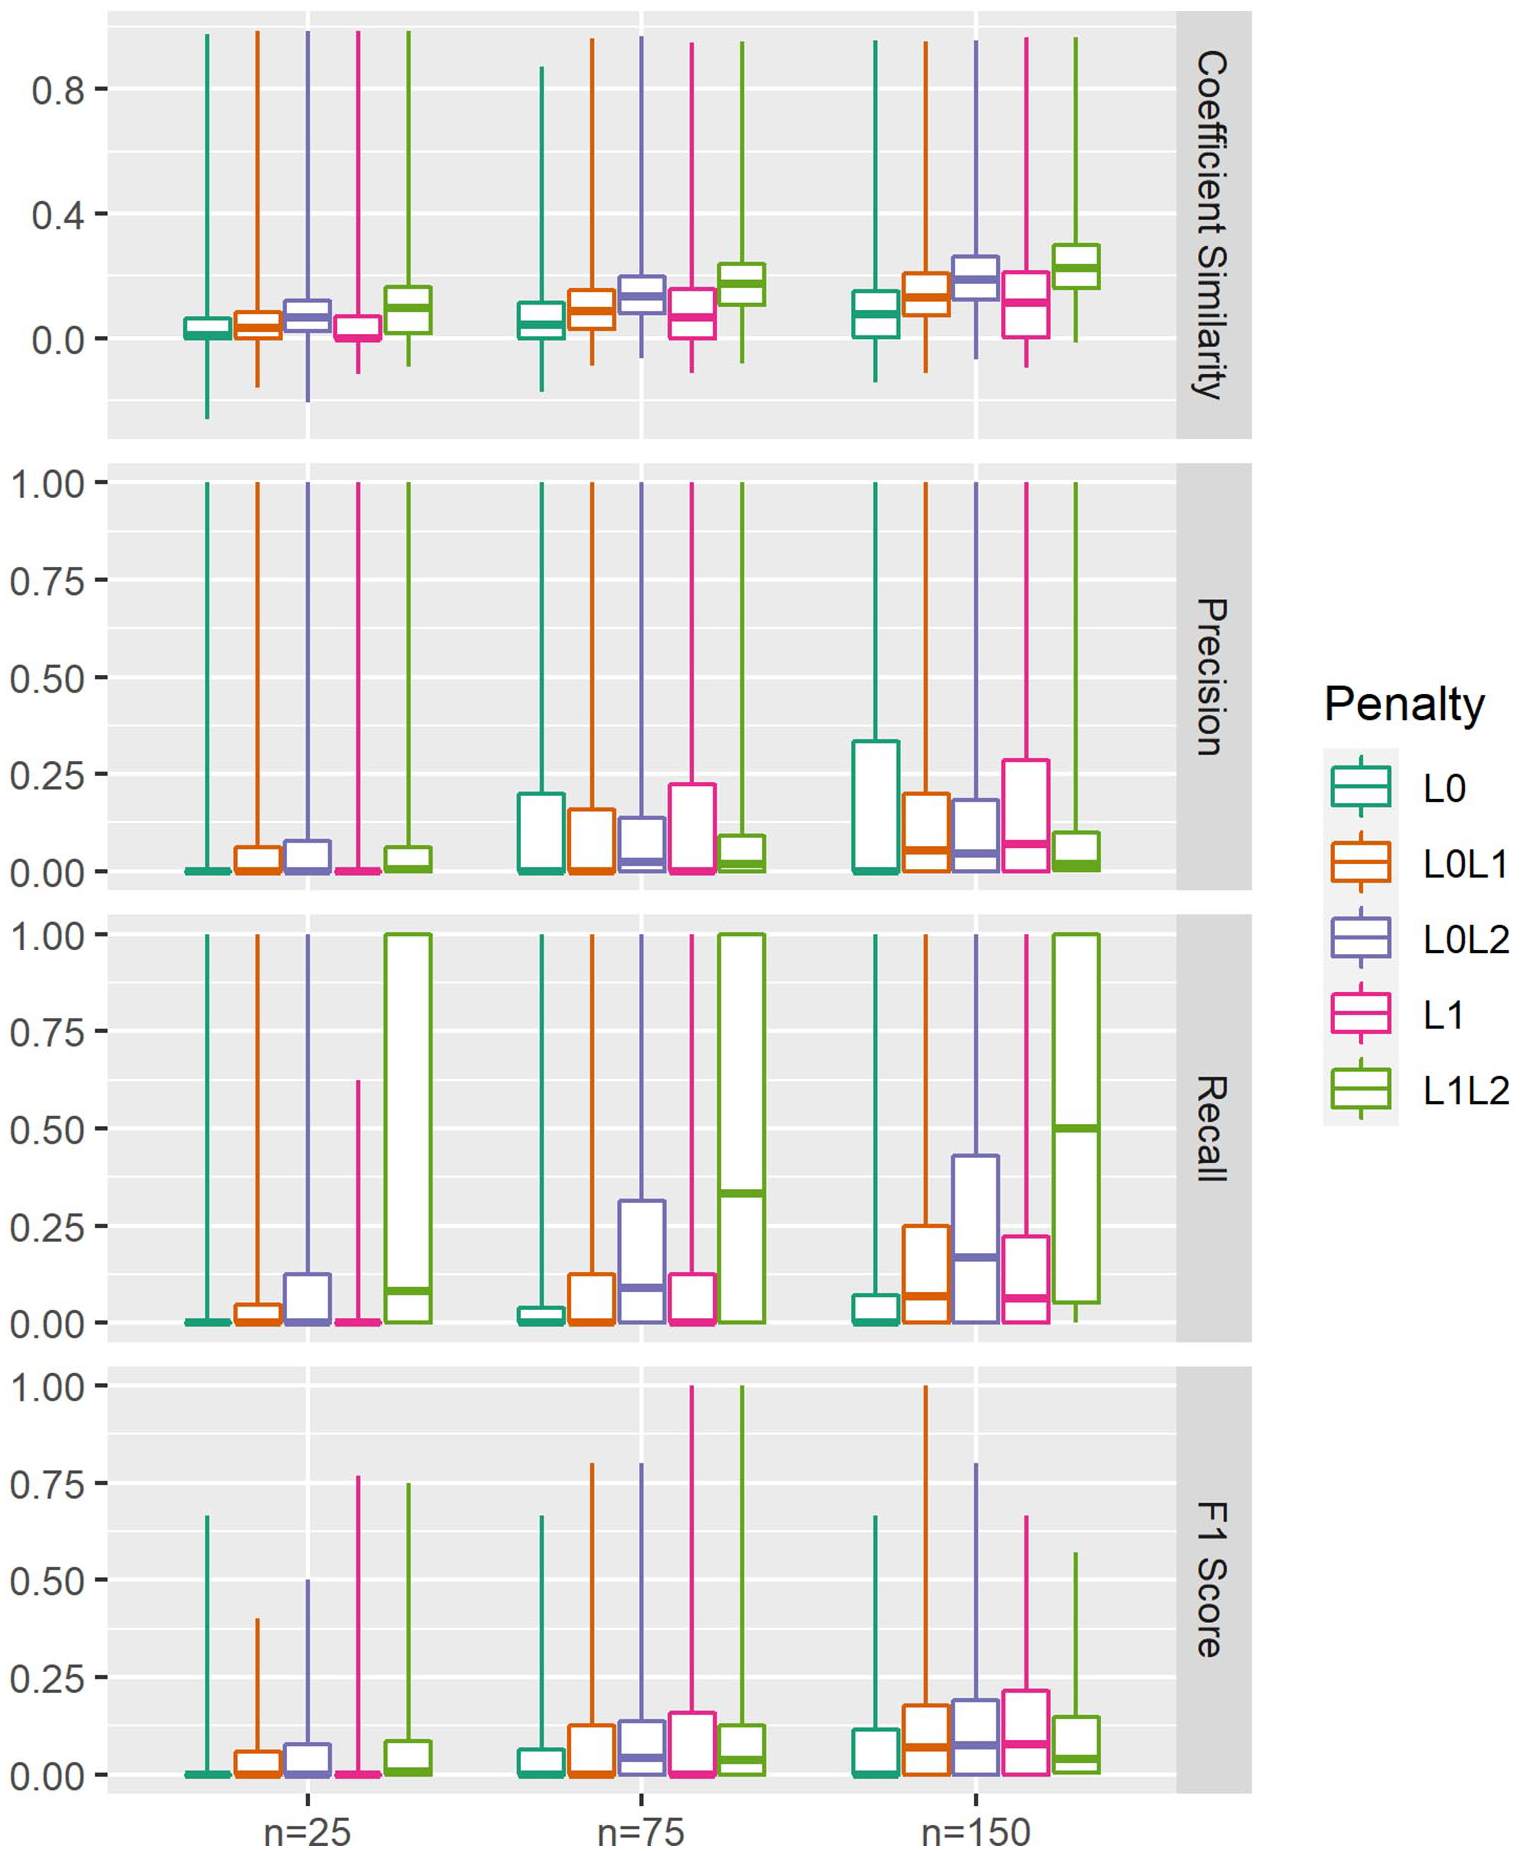
Variable selection performance. Gold standard coefficient vectors were extracted from ordinary least squares regression models fitted to the full dataset
Variable selection performance of each penalisation method.
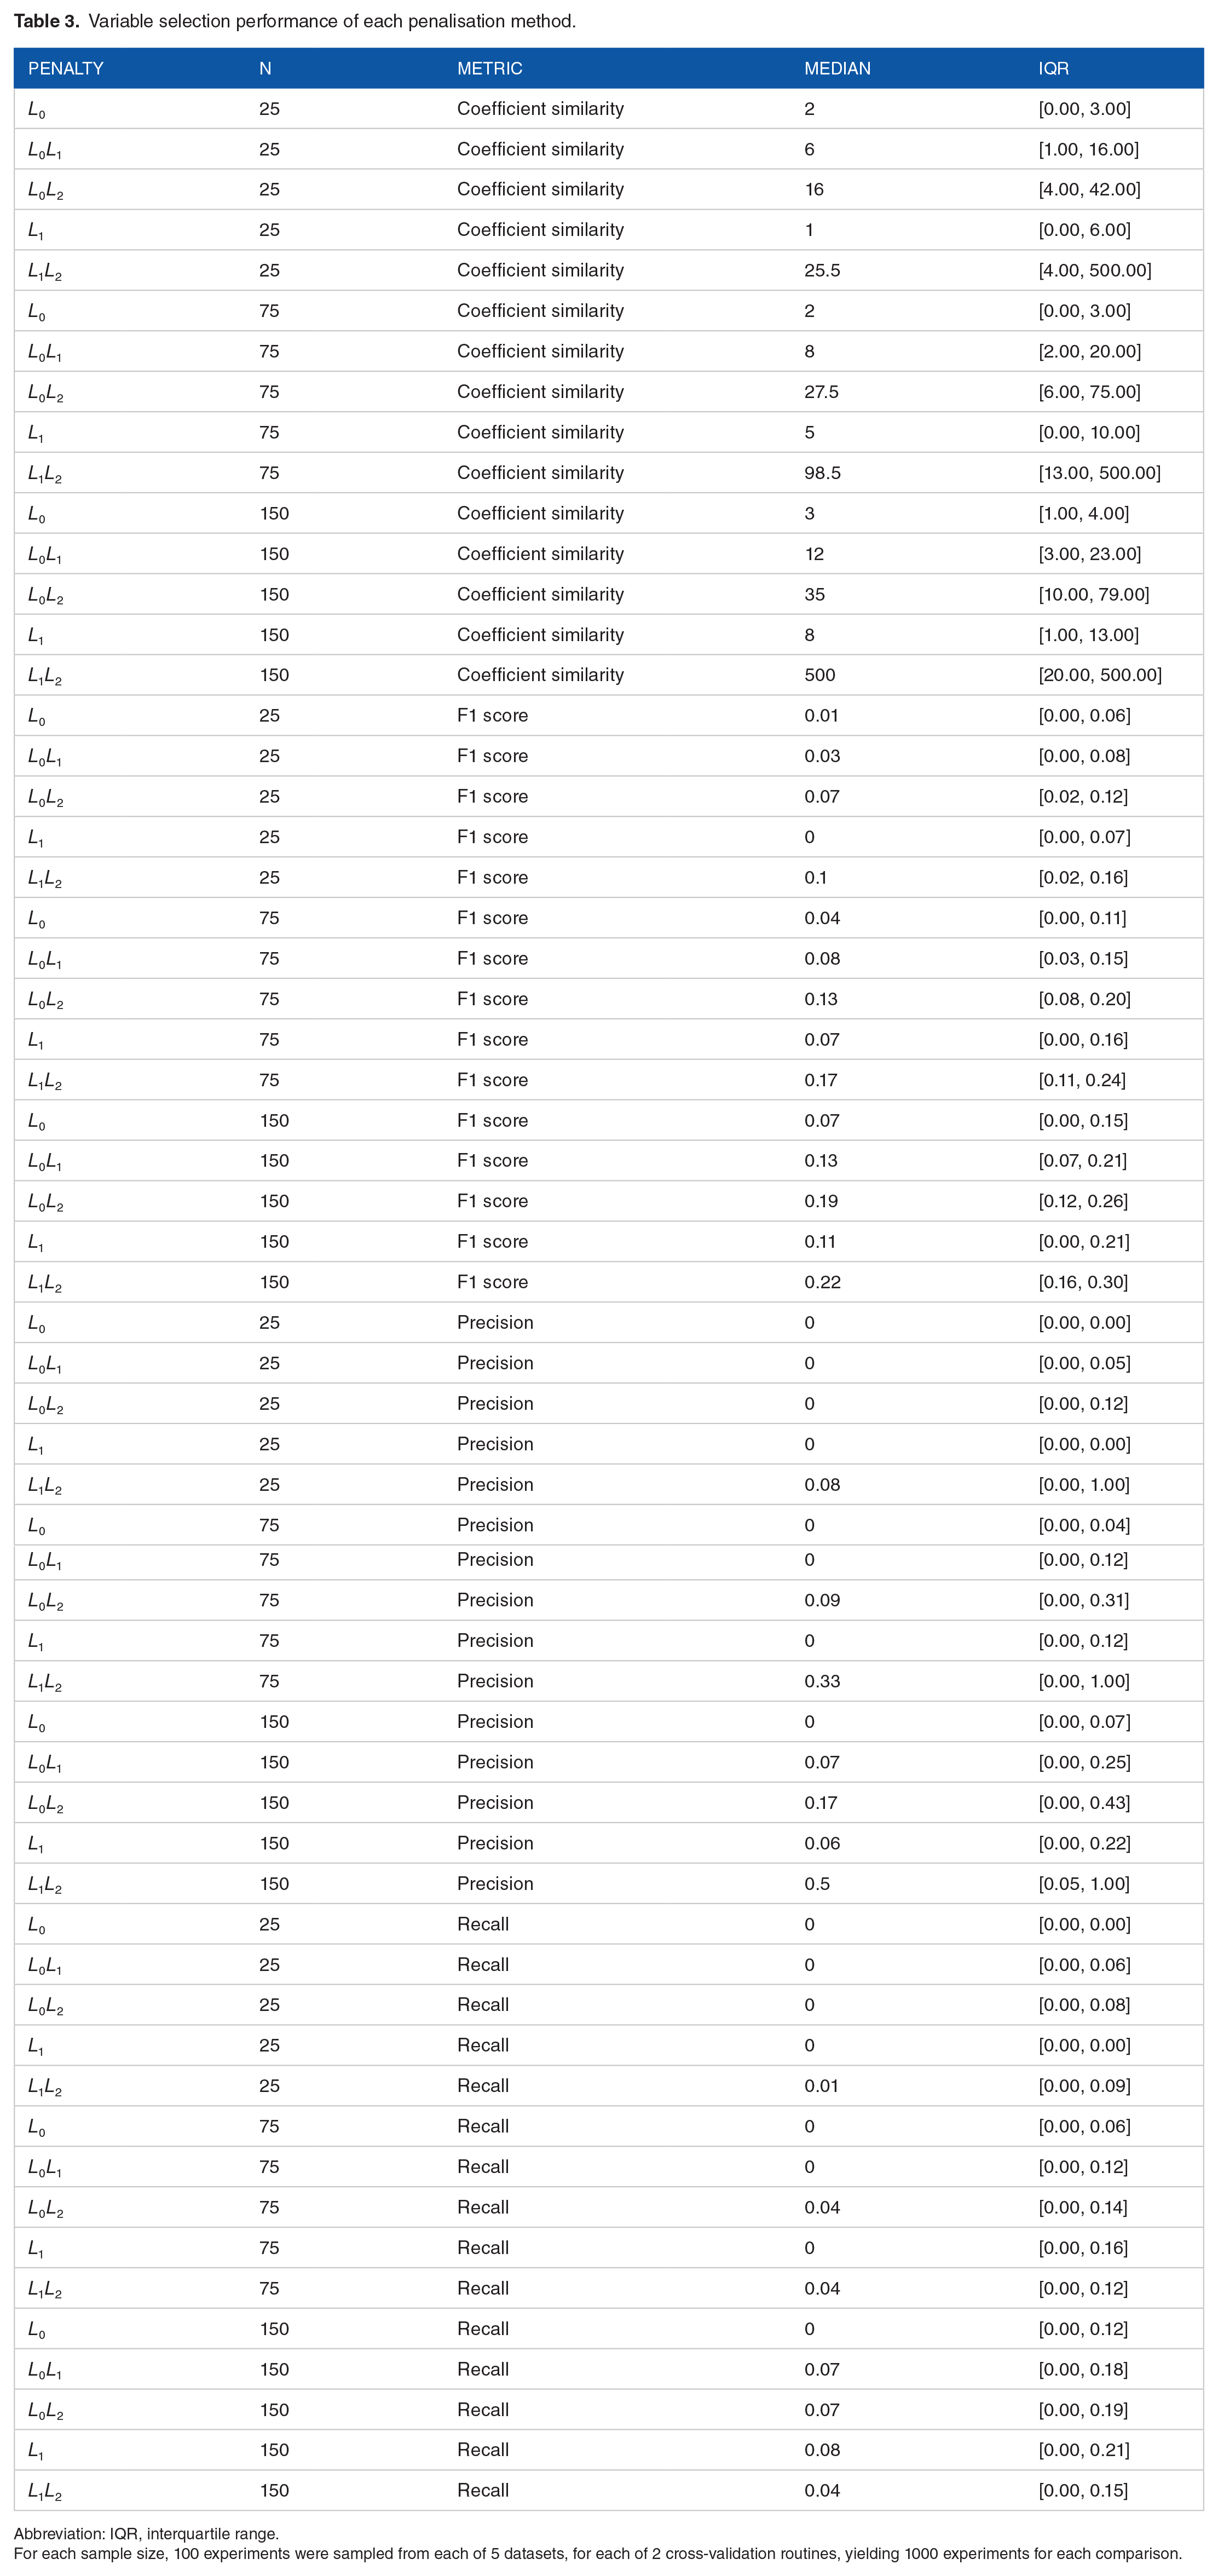
Abbreviation: IQR, interquartile range.
For each sample size, 100 experiments were sampled from each of 5 datasets, for each of 2 cross-validation routines, yielding 1000 experiments for each comparison.
Comparing preselection to internal validation
Penalty preselection led to small, yet significant, performance gains in PVE (
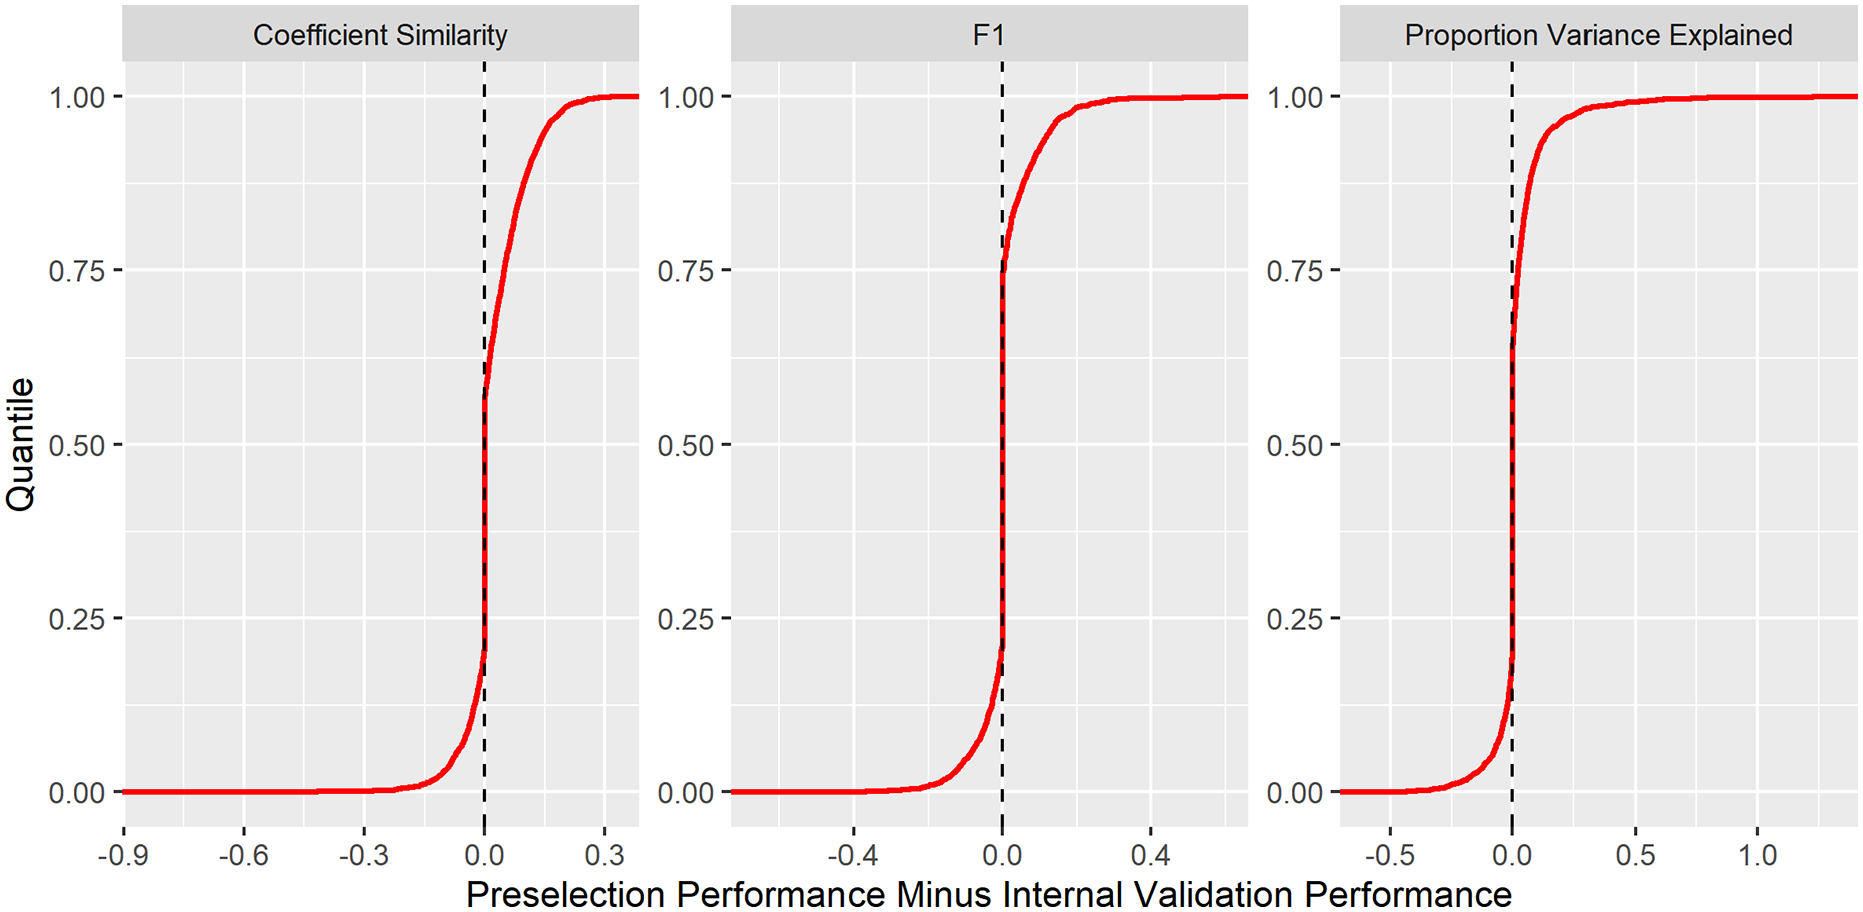
Cumulative distribution functions for performance improvement under penalty preselection compared with comparison to selection by internal cross-validation. For each experiment and each comparison metric, the penalisation method was selected with the best test performance in the other 4 datasets. This ‘preselected’ penalisation method was compared to that which minimised the mean squared error in internal cross-validation. About 3000 experiments were included in the comparison.
Paired-tests of mean performance difference using preselection compared to selection by internal cross-validation. Penalisation routines were ‘preselected’ according to performance in the other 4 datasets. Mean difference refers to preselected performance minus internal cross-validation performance. About 3000 experiments were included in the comparison.

Discussion
The optimal penalisation method for a particular dataset depends upon the project objectives, data distribution and noise levels. In most applications, reliability is paramount – the strong median predictive performance provided by
Penalty preselection yielded small, yet significant improvements over internal cross-validation based selection in each examined metric, demonstrating the value of external data-driven preselection of model learning algorithms for
Related work
Bertsimas et al
10
found that
Limitations
The primary limitation of this analysis is uncertainty regarding the true generating distributions of the datasets. In place of ground truth, a ‘gold-standard’ was set using a much larger number of observations. Thus, our analysis evaluates its capacity to recover the model which would have been found in a much larger study of the same population, a reasonable objective in many clinical studies. As the gold standard models were fitted to a finite number of observations, they were susceptible to some degree of overfitting.
Observations were not strictly partitioned on a patient-disjoint basis. In the typical clinical modelling scenario, estimation of model generalisability to new patients would require patient-disjoint partitioning and validation. 57 However, distributional identicality of the training and test data would not have been guaranteed in such conditions, biassing assessment metrics in favour of underfitted models.
Bertsimas and Hastie both considered which SNR ranges were ‘realistic’; Bertsimas generated tasks with SNR
Discrete variable selection metrics (precision, recall and F1 score) lacked the graduation required to compare penalisation methods at the n = 25 level. This limitation was particularly important in the setting of active variables estimated according to a sharp significance cutoff. The coefficient similarity metric proved useful in this regard, as it was continuous and independent of any significance cutoff. However, coefficient similarity provides little insight into on model complexity, a central aspect of genomic network inference. Indeed, although
Real-world genomic datasets were employed in this analysis. Accordingly, our results are expected to be more representative of actual experimental modelling conditions. Data-driven model assessment was facilitated by the large number of observations available in these datasets. However, our results may not generalise to datasets with incomparably distributed signal or noise. Logistic and Cox regression tasks present addition challenges such as class imbalance and censoring, which are beyond the scope of this analysis.
Conclusions
Supplemental Material
sj-txt-1-cix-10.1177_11769351211056298 – Supplemental material for Sparse Regression in Cancer Genomics: Comparing Variable Selection and Predictions in Real World Data
Supplemental material, sj-txt-1-cix-10.1177_11769351211056298 for Sparse Regression in Cancer Genomics: Comparing Variable Selection and Predictions in Real World Data by Robert J O’Shea, Sophia Tsoka, Gary JR Cook and Vicky Goh in Cancer Informatics
Footnotes
Declaration of conflicting interests:
The author(s) declared no potential conflicts of interest with respect to the research, authorship, and/or publication of this article.
Funding:
The author(s) disclosed receipt of the following financial support for the research, authorship, and/or publication of this article: Authors acknowledge funding support from the UK Research & Innovation London Medical Imaging and Artificial Intelligence Centre; Wellcome/Engineering and Physical Sciences Research Council Centre for Medical Engineering at King’s College London (WT 203148/Z/16/Z); National Institute for Health Research Biomedical Research Centre at Guy’s & St Thomas’ Hospitals and King’s College London; Cancer Research UK National Cancer Imaging Translational Accelerator (A27066).
Author Contributions
Conception and Design – all authors. Administrative support – N/A. Provision of study materials or patients: N/A. Collection and assembly of data: Robert O’Shea. Data analysis and interpretation: Robert O’Shea. Manuscript writing: all authors. Final approval of manuscript: all authors.
Data Availability Statement
Datasets used in this analysis were extracted from Gene Expression Omnibus.42-46 The processed datasets are publicly available at ![]() .YMI6PqhKiUk (DOI: 10.5281/zenodo.4923812). All code required to support the findings of this analysis is publicly available at github.com/robertoshea/sparsifying-penalties-for-high-dimensional-regression.
.YMI6PqhKiUk (DOI: 10.5281/zenodo.4923812). All code required to support the findings of this analysis is publicly available at github.com/robertoshea/sparsifying-penalties-for-high-dimensional-regression.
Ethics Statement
This article does not contain any studies with human participants or animals performed by any of the authors.
Supplemental Material
Supplemental material for this article is available online.
References
Supplementary Material
Please find the following supplemental material available below.
For Open Access articles published under a Creative Commons License, all supplemental material carries the same license as the article it is associated with.
For non-Open Access articles published, all supplemental material carries a non-exclusive license, and permission requests for re-use of supplemental material or any part of supplemental material shall be sent directly to the copyright owner as specified in the copyright notice associated with the article.