
Abstract
Glioblastoma is the most common brain tumor in adults in which recurrence has been attributed to the presence of cancer stem cells in a hypoxic microenvironment. On the basis of tumor formation
Keywords
Introduction
Water transport channel proteins, referred to as aquaporins, primarily facilitate the transport of water across biological membranes in various cell types and organisms.1–5 We have previously compared the tissue expression of aquaporins of mammals (human, mouse, and rat) and chicken using data from expressed sequence tags (ESTs).
4
Here we report a computational evaluation of the expression levels of human aquaporins (AQP0–AQP12) in 92 glioma samples consisting of human glioblastoma stem-like (GS) cell lines, conventional glioma cell lines, and primary tumors.6,7 Based on tumor formation
The motivation for the investigation is the emerging knowledge on the role of cancer stem cells in glioblastoma.7–10 Glioblastoma is the most common brain tumor in adults 11 described as highly invasive; heterogeneous phenotypes; high rate of recurrence after treatment; poor prognosis; and a median survival time of approximately 15 months.12–14 The recurrence has been attributed to the presence of cancer stem cells. 15 We are particularly interested in the expression of aquaporins in neurospheres (glioblastoma clonogenic cells), which are induced by hypoxia and represent the most malignant zones of glioblastomas. 9
We have integrated methods of data transformation, visual representation of data, and statistical analyses to compare the expression levels of aquaporins in a panel of 92 glioma cells. A key finding was a pattern of inverse expression levels of AQP1 and AQP4 probe sets in the datasets from GS cell lines and neurospheres. Interactive visual representation designs for integrating phenotypic features and expression levels revealed that inverse expression levels of AQP1 and AQP4 correlated with distinct phenotypes in a set of cell lines grouped into full and restricted stem-like phenotypes. Our analysis also included expression levels of CXCR4 (the receptor for stromal cell derived factor-1 [SDF-1], a potential glioma stem cell therapeutic target), and PROM1 (prominin-1 gene encoding CD133, the widely used glioma stem cell marker). In the dataset analyzed, discriminant function analysis revealed that AQP1 and AQP4 expression levels are better predictors for tumor formation and growth types in GS cells than are CXCR4 and PROM1. The methods developed included visual representations of statements on the expression levels and phenotypic characteristics of glioblastoma in two articles.6,7 This form of secondary data analysis of statements in publications on glioblastoma could uncover scientific discoveries of therapeutic significance and thus be relevant beyond the scope of this article. Future investigations are needed to characterize the molecular mechanisms for inverse expression levels of AQP1 and AQP4 in the glioblastoma stem-like neurospheres.
Materials and Methods
Gene Expression Data
Gene expression data on glial cancer cell samples were obtained from the BIOGPS dataset 1692 (http://biogps.org/dataset/1692/). 16 The microarray platform was Affymetrix Human Genome U133 Plus 2.0 Array. The BIOGPS provides a gene-centric view across all the 92 samples in the Gene Expression Omnibus (GEO) Series (GSE23806) consisting of human Glioblastoma Stem-like (GS) cell lines’ conventional glioma cell lines, and primary tumors.6,7 This view does not provide a visual representation of the expression of gene sets: for example, all human aquaporin gene family. Such a comprehensive view of the expression data would be useful for developing new hypotheses on the expression and localization of human aquaporins in glial cancers. The Log2 GeneChip Robust Multiarray Averaging (gcRMA) processed signals (expression data) for Affymetrix probe set(s) mapped to the each aquaporin gene were downloaded from BIOGPS for visual analytics.
Data Preparation and Design of Visual Representations
The availability of a wealth of data from biological research on glioblastoma, including expression of genes and localization of proteins as well as heterogeneity of glioblastoma types, presents opportunities for secondary data analytics using visual analytics tools. Visual analytics, the science of analytical reasoning via visual interactive interfaces, can be used to build knowledge from data, make sense of the data, and make decisions from data for future research.17–19 In this study, we used visual analytics to focus the analysis of the datasets.
Gene expression values for the 13 human aquaporins (AQP0–AQP12), CXCR4, and PROM1 in glial cancer cell samples (GSM198765–GSM198781 and GSM587155–GSM587229) were used to construct visual representations of data on expression levels. The expression-level data (Log2 gcRMA processed signal data) for each aquaporin consist of columns of 92 tissue samples (GSM series) and the probe set(s). The dataset for each aquaporin was transformed into three columns (Tissue, Probeset [abbreviation for probe set], and Value) using the Tableau Reshape Tool (Tableau Software) in Microsoft Excel (Microsoft Corporation). The corresponding AQP symbol was then included in the final dataset, which consisted of four columns, namely, AQP, Tissue, Probeset, and Value. The number of rows in a dataset is equal to the number of probe sets multiplied by 92. Therefore a gene with two probe sets will have 184 rows of data following the headers.
All 15 data files were uploaded in an additive manner in Tableau Desktop Professional (Tableau Software) and then used to construct a dataset used for visual analytics. A second dataset consisted of 1) the metadata on the 92 tissue samples that included the title of the sample and cell type,
16
and 2) the metadata on the tumor formation
A visual representation design was developed to display the expression values of the genes in columns and the corresponding glioma samples (GSM198765–GSM198781 and GSM587155–GSM587229) in rows. An interactive box plot representation was also developed to compare the expression levels of the 15 genes. The visual representations were further grouped based on the unsupervised hierarchical cluster analysis (described by Schulte et al. 6 ) into primary tumors, GSf, GSr, conventional cell lines, and monolayer cultures. A heat map representation was developed to compare the GSf and GSr samples. The GS cells GS-3 and GS-7 lineage were selected for analytics since the publication describing CXCR4 as a therapeutic target used clonal sublines from GS-3 and GS-7 to test for phenotypic stability of clones to parental lines. 6 GS-3 had the full stem-like phenotype (GSf), while GS-7 had the restricted stem-like phenotype (GSr). Since neurospheres (glioblastoma clonogenic cells) are induced by hypoxia and represent the most malignant zones of glioblastomas, 9 we compared the expression levels of AQP1, AQP4, CXCR4, and PROM1 in neurosphere samples. Statements in the article by Schulte and colleagues 6 on phenotypes and gene expression profiles of glioblastoma samples were evaluated in the visual representations reported here.
Statistical Analysis of Gene Expression Data
The dataset for statistical analysis consisted of 1) the glioma cell identifier (starting with GSM), 2) title of glioma cell, tumor formation, and 3) gene expression values for AQP0–AQP12, CXCR4, and PROM1. To test for differences of AQP expression between different categories of
Results
Inverse expression levels of AQP1 and AQP4 in glioblastoma stem-like cells
A new dataset on the expression levels of probe sets of the aquaporin genes CXCR4 and PROM1 (CD133) was constructed from raw data downloaded for each gene in the BIOGPS dataset 1692 (http://biogps.org/dataset/1692/). The constructed dataset, available as a tab in the supplementary spreadsheet file, consisted of a total of 2,566 expression values for 28 Affymetrix probe sets encoding 13 human aquaporins (AQP0–AQP12), CXCR4, and PROM1. In Figure 1, a visual representation is shown of the expression values of all the probe sets in glioblastoma stemlike cells (GS-1 to GS-12) grouped by phenotype (full or restricted). A box plot was constructed from the expression levels of the 15 genes in the GS-3 and GS-7 lineages (Fig. 2). The highest levels of expression were found in the probe sets of AQP1, AQP4, and CXCR4. The plot was annotated for potentially interesting expression levels that were outliers or at the extreme levels of the box. Inverse expression levels of AQP1 and AQP4 were observed between the full (GS-3) and restricted (GS-7) GS cells.

Expression levels of all the probe sets in glioblastoma stem-like cells (GS-1–GS-12) grouped by phenotype (full or restricted). Interactive version of figure is available at https://public.tableausoftware.com/views/glioma_aqp/figure1.

Box plot of expression levels for AQP1, AQP4, CXCR4, and PROM1 in two glioblastoma stem-like clonal sublines (GS-3 and GS-7) and their associated passaged parental lines and neurospheres. Interactive version of figure is available at https://public.tableausoftware.com/views/glioma_aqp/figure2.
We found agreement between the statements in the publication on the phenotypic stability of two lineages of glioma stem-like cells (GS-3 and GS-7) and our visual representation. Thus in Figure 3, the visual representation (heat map) shows the expression levels for AQP1, AQP4, CXCR4, and PROM1 in two clonal sublines (GS-3 and GS-7) and their associated passaged parental lines and neurospheres.
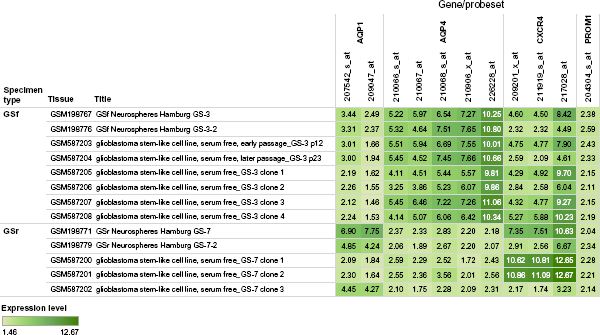
Heat map of expression levels for AQP1, AQP4, CXCR4, and PROM1 in two glioblastoma stem-like clonal sublines (GS-3 and GS-7) and their associated passaged parental lines and neurospheres. Interactive version of figure is available at https://public.tableausoftware.com/views/glioma_aqp/figure3.
The following statements were evaluated in the visual representation: “All GS-3 sublines grew spherically, expressed CD133 and formed invasive tumors in nude mice, phenocopying the parental line. GS-7 subclones behaved more variably: Clone 3 grew semiadherent like the parental line, whereas Clones 1 and 2 grew spherically, a distinction reflected also in the more closely related expression profiles of Clones 1 and 2 versus Clone 3 and parental GS-7 cells.” 6
The heat map visual representation (Fig. 3) revealed an inverse relationship of AQP1 and AQP4 expression levels in the full (GSf, GS-3) and restricted (GSr, GS-7) GS cells. The ranges of expression levels for AQP1 were 1.46–3.44 for GS-3 cells and 1.64–7.75 for GS-7 cells. The average of the expression levels across the 92 glioma samples for the two AQP1 probe sets was 4.55. In the case of AQP4, the ranges were 3.5–11.06 for GS-3 cells and 1.72–3.56 for GS-7 cells. The average expression level for the five AQP4 probe sets across the 92 glioma samples was 4.28. In the GS-7 cells, the expression level of CXCR4 was distinct for clones 1 and 2 compared to clone 3 (Fig. 3).
Another set of statements evaluated using visual representations (Fig. 4) was: “In conclusion, the group of GSf cell lines emerges as a more representative model for human glioblastomas than other GS lines or conventional glioma cell lines, mirroring original tumor gene expression signatures most closely and maintaining highly invasive growth

Comparison of expression levels for selected probe sets of AQP1, AQP4, CXCR4, and PROM1 in glioblastoma neurospheres. GSf, full stemlike phenotype, GS-3; GSr, restricted stem-like phenotype, GS-7. Interactive version of figure is available at https://public.tableausoftware.com/views/glioma_aqp/figure4.
In Figure 4, the expression levels of AQP1, AQP4, CXCR4, and PROM1 probe sets for 17 neurospheres samples (8 GSf and 9 GSr) are compared using a heat map that includes the expression values. The probe set selected for each gene was that with the highest total expression level compared to other probe sets. Therefore, probe sets 209047_at (AQP1), 226228_at (AQP4), 217028_at (CXCR4), and PROM1 (204304_s_at) were selected for comparison (Fig. 4). We used the unpaired two-tailed
The datasets transformed for visual analytics and statistical analysis are available as a Supplementary File to this article. A collection of visual analytics resources for performing complex cognitive activities (such as sense-making and knowledge discovery) on the datasets is available at https://public.tableausoftware.com/views/glioma_aqp/abstract.
AQP1 and AQP4 expression are better predictors for tumor formation and growth types in glioblastoma than are CXCR4 and PROM1
Figure 5 aligns the AQP expression in growth types and tumor formation. For AQP1 and AQP4, Kruskal–Wallis ANOVA retrieved highly significant differences between all categories in both tests as well as differences between AQP1 and AQP4 expression in tumor formation and growth (Table 1). Grouping expression patterns according to group mean showed that AQP1 expression in spherical growth cultures, diffuse tumors, and solid tumors was lower than in semi-adherent and adherent growth cultures, as well as in instances where no tumor was formed. Further, AQP4 expression was lower in semi-adherent and adherent cultures as well as in solid and no tumors than in diffuse tumors and spherical growth cultures.

Predictive inverse expression levels of AQP1 and AQP4 in glioblastoma stem-like cells.
Results of Kruskal–Wallis ANOVA for differences in aquaporin expression between different categories of tumor formation and growth type. Cell numbers refer to the cell lines; KW-H; exact p (bold if significant after Bonferroni correction).

The additionally investigated tumor markers CXCR4 and PROM1 showed low expression in primary tumors. PROM1 was not strongly expressed in all growth types and tumor formation categories, except for medium expression in the “No tumor” category. CXCR4 also had medium strength of expression in this category but uniformly high expression in all others. Discriminant Function Analysis (DFA) showed that growth type and tumor formation could be predicted with low error probabilities by candidate marker expression (Table 2). A plot of the first two canonical roots of the DFA showed that “no tumor”, “spherical”, and “adherent” could be completely discriminated. However, diffuse/solid tumor formation and semi-adherent growth by themselves were not sufficiently predictable from our dataset (Fig. 5, Table 2). The strongest were AQP1 and AQP4, followed by CXCR4. PROM1 was not a significant predictor.
Results of discriminant function analysis for tumor growth and formation using the expression of four marker genes as predictor variables. Overall statistics for tests: Growth type (five groups) Wilks’ Lambda:.04104 approx.

Consequently, the inverse AQP1/AQP4 expression ratio could predict the formation of diffuse tumors with spherical growth form, and no tumor formation/semi-adherent or adherent growth form in cell culture (Fig. 6). AQP1 and AQP4 expression are better predictors for tumor formation and growth types in glioblastoma than are CXCR4 and PROM1.

Discriminant Function Analysis (DFA) identified predictors for growth type and tumor formation in glioblastoma.
Discussion
This report presents, for the first time, combined visual analytics and statistical analysis of gene expression levels of aquaporins in the two publications on the genome-wide gene expression in a large collection (92 samples) of glioblastoma stem-like cells.6,7 The collection of visual analytics resources developed in this study provide an interactive cognitive activity support tool to extend that capability of researchers to perform cognitive activities including knowledge discovery and learning. The strategies in the study could be applicable to datasets from next-generation sequencing (NGS) including exome sequencing data.
The integrated data analytics approach confirmed statements in the previous publication by Schulte and colleagues. 6 Our focus on the 13–member aquaporin gene family revealed that inverse (high/low) expression levels in two of these aquaporin genes could be correlated with two distinct phenotypes of GS cells (Figs. 1—6). Clearly, in the neurosphere cultures (Figs. 3 and 4), low AQP1 and high AQP4 expression was characteristic for the full stem-like phenotype (GS-3 and GS-3–2), while high AQP1 and low AQP4 expression was characteristic for the restricted stem-like phenotype (GS-7 and GS-7–2). Statistical analysis using DFA provided statistical support that AQP1 and AQP4 expressions are better predictors for tumor formation and growth types in glioblastoma than are CXCR4 and PROM1 (Tables 2 and 3; Figs. 5 and 6). The biological significance of these inverse expression levels of AQP1 and AQP4 in the distinct stem-like phenotypes is not clear yet. However, under the hypoxic conditions present in tumor cells, AQP1, AQP4, and AQP9 contribute to motility, invasiveness, and edema formation and facilitate metabolism. 20
Standardized coefficients for discriminant function analysis predictor variables (canonical roots).

Seven of the eight GSf neurospheres follow the pattern of low AQP1 and high AQP4 (Fig. 4). Since the group of GSf cell lines is a more representative model of human glioblastoma, we propose that an index of the expression levels between AQP1 and AQP4 expression levels might be a useful tool to analyze and predict glioblastoma tumor formation and growth type. The relationship is based on the expression levels of Affymetrix probe sets 209047_at (AQP1) and 226228_at (AQP4) in 17 glioblastoma neurosphere samples. The expression levels (Log2 gcRMA) for the eight GSf neurospheres ranged from 2.215 to 11.332 in which a cut-off level of 6.0 was observed to define the inverse relationship. We therefore propose further research in which a human glioblastoma sample that will maintain highly invasive growth
We have used expression levels obtained from Affymetrix probe sets as an indicator of gene expression. Multiple probe sets can be associated with a gene. Therefore, the statistical analysis used the average of the expression levels (Tables 2 and 3). However, there were also some clones or sub-lines of cells that had expression levels in AQP1 and AQP4 that did not fit the inverse relationship. In GS-7, clone 3 expression pattern was different from that of clones 1 and 2 (Fig. 3). The heat map revealed the high expression levels (>10) of CXCR4 probe sets for GS-7 clone 1 and GS-7 clone 2. The difference observed could be due to the difference in CXCR4 signaling. CXCR4 is the receptor for SDF-1, a potential glioma stem cell therapeutic target. 6
The combined data analytics strategy developed in this study starts with the integration of gene expression levels obtained from the BIOGPS dataset 1692 (http://biogps.org/dataset/1692/). 16 A unique contribution of the study is the transformation of the datasets in BIOGPS to formats that permit deeper insights into relationships between probe sets and expression levels. We further determined the agreement between the visual representations and the statements in a publication 6 on the phenotypic stability of two lineages of GS cells (GS-3 and GS-7). The method developed used visual representations to make additional scientific discoveries from the statements in scientific publications. This form of secondary data analytics of statements in publications on glioblastoma could uncover scientific discoveries of therapeutic significance. We have previously used text mining methods to extract statements on genomic polymorphisms in arsenic-induced skin cancer. 21
Conclusions
A combination of visual analytics and statistical analysis techniques was used to uncover previously unknown relationships in a total of 2,566 expression levels from 28 Affymetrix microarray probe sets encoding 13 human aquaporins (AQP0–AQP12), CXCR4 (the receptor for SDF-1, a potential glioma stem cell therapeutic target), and PROM1 (gene encoding CD133, the widely used glioma stem cell marker). Investigations are needed to characterize the molecular mechanisms for inverse expression levels of AQP1 and AQP4 in glioblastoma stem-like neurospheres. A major novel hypothesis developed here that remains to be experimentally verified is that the AQP4/AQP1 ratio could be a diagnostic marker for distinct phenotypes of glioblastoma stem-like cells.
Author Contributions
Conceived and designed the experiments: BG, KN, KWV, RDI. Analyzed the data: BG, KN, KWV, JNS, MP, RDI, UKU. Wrote the first draft of the manuscript: KN, KWV, JNS, RDI. Contributed to the writing of the manuscript: BG, MP, UKU. Agree with manuscript results and conclusions: BG, KN, KWV, JNS, MP, RDI, UKU All authors reviewed and approved of the final manuscript.
Supplementary Material
Supplementary File 1
This file contains additional information on data sets used in the study.