
Abstract
Background:
Glioblastoma multiforme (GBM) is the most common and aggressive primary brain tumor. Previous studies on GBM biomarkers focused on the effect of the biomarkers on overall survival (OS). Until now, no study has been published that evaluates the performance of biomarkers for prognosing OS. We examined the performance of microRNAs, gene expressions, gene signatures, and methylation that were previously identified to be prognostic. In addition, we investigated whether using clinical risk factors in combination with biomarkers can improve the prognostic performance.
Methods:
The Cancer Genome Atlas, which provides both biomarkers and OS information, was used in this study. The time-dependent receiver operating characteristic (ROC) curve was used to evaluate the prognostic accuracy.
Results:
For prognosis of OS by 2 years from diagnosis, the area under the ROC curve (AUC) of microRNAs, Mir21 and Mir222, was 0.550 and 0.625, respectively. When age was included in the risk prediction score of these biomarkers, the AUC increased to 0.719 and 0.701, respectively. The SAMSN1 gene expression attains an AUC of 0.563, and the “8-gene” signature identified by Bao achieves an AUC of 0.613.
Conclusions:
Although some biomarkers are significantly associated with OS, the ability of these biomarkers for prognosing OS events is limited. Incorporating clinical risk factors, such as age, can greatly improve the prognostic performance.
Keywords
Introduction
Glioblastoma multiforme (GBM) is the most common and aggressive primary brain tumor, with an annual incidence rate of 2 to 3 per 10 000 in the United States and 3.19 per 10 000 worldwide. 1 Glioblastoma multiforme is a World Health Organization (WHO) grade IV astrocytoma of poor prognosis even with the best available multimodal therapies including surgical resection, chemoradiotherapy, and radiosurgery. For patients with GBM, worsening of symptoms is often rapid. Glioblastoma multiforme tumors are infiltrative in nature and often cannot be detected until complete resection is impossible. 2 Recently, advances have been made in identifying the genetic profile of glioblastomas. Many proteins produced by genes that are implicated in GBM pathogenesis can now be measured in brain tissues or blood serum. 2 Although GBM biomarker research is still in its early stages, many promising biomarkers have been identified in recent years. In conjunction with other clinical data (eg, clinical risk factors and neuroimaging modalities such as magnetic resonance imaging), these biomarkers could contribute to the clinical management of GBM by helping classify tumors, assess treatment responses, and make better prognoses. The US National Institutes of Health (NIH)-sponsored The Cancer Genome Atlas (TCGA) project has created a comprehensive genetic profile for a variety of cancer types, including brain, lung, and colon. Glioblastoma multiforme was the first cancer to be systematically studied by TCGA. TCGA data set includes not only a vast amount of gene-related biomarkers measurements but also patients’ clinical risk factors and survival status. This data set provides us with opportunities not only to detect new prognostic biomarkers but also to assess prognostic performance of the biomarkers.
To evaluate the prognostic performance of new biomarkers, investigators often apply regression models (eg, Poisson regression, logistic regression, and Cox regression) to relate a biomarker with disease or survival events based on parameters such as relative risk, odds ratio, and hazard ratio. These statistical models can test the association between a biomarker and the risk of a disease or survival event. Most previous studies on GBM biomarkers investigated the biomarker effect on patients’ overall survival (OS). A few of them were trying to establish prediction models for OS using biomarkers as the predictor variables. Although studies of associations are usually adequate in etiologic research, they do not examine the prognostic ability of biomarkers to correctly predict OS in the future. To assess biomarkers for their classification accuracies, a receiver operating characteristic (ROC) curve is commonly used by plotting pairs of sensitivity and specificity across all possible classification thresholds. Traditional ROC curves evaluate biomarkers with a continuous distribution for classifying dichotomous status, such as diseased versus nondiseased or alive versus dead. The Supplemental Method section within the Supplemental Material provides the definition of sensitivity and specificity, as well as a detailed description on how a traditional ROC curve can be generated based on the biomarker distributions among diseased and nondiseased subjects. Because an ROC curve is a plot across all possible decision thresholds within the range of the biomarker values, it does not require specification of threshold values. 3 Area under the ROC curve (AUC) is often used to assess the overall diagnostic performance of biomarkers. 4
For prognosis of future disease or survival events, however, we often need to consider timing of the disease development. A patient with cancer who is currently alive may die in either the near future or the far future. Therefore, prognosis of a disease or disease-related outcomes, such as OS, progression-free survival, and treatment responses, often needs to deal with a time-varying process. Statistical methods for survival (or time-to-event) analysis can evaluate the prognostic importance of a biomarker through its effect on the disease or survival event. For example, Cox proportional hazards models can estimate the hazard ratio associated with one unit increase in the biomarker value if the biomarker value has a continuous distribution or the hazard ratio comparing the positive and the negative test results when marker values are dichotomized. For prognosis of OS, the mortality status for a given patient will vary across the whole follow-up period. For this reason, the prognostic accuracies (sensitivity, specificity, and AUC) of a biomarker will be time dependent. The traditional ROC analysis will no longer be appropriate under this situation. In addition, the OS time is often subject to censoring, and removing censored subjects from the study can often lead to biased estimates of sensitivity and specificity. To accommodate the problem, the time-dependent ROC method was developed to assess the accuracies of a baseline biomarker for prognosing of a future event, such as OS. For instance, to assess the performance of a biomarker for prognosing OS by 24 months after GBM diagnosis, we can plot the time-dependent ROC curves and obtain the AUC as well as the sensitivity and specificity at a given threshold. Hu and Zhou5,6 summarized recent statistical methods in time-dependent ROC analysis, including works by Etzioni et al, 7 Heagerty et al, 8 Heagerty and Zheng, 9 Cai et al, 10 and Song and Zhou. 11
In prognosis studies, patients are monitored until (a) they reach the event of interest (such as disease diagnosis or death), (b) they drop off the study, or (c) the end of the study. The time interval from baseline to event occurrence is called an event time, whereas the time interval from baseline to loss of follow-up or to the end of the study is called a censoring time. For a baseline biomarker Y, Heagerty et al 8 proposed 2 types of time-dependent sensitivity or true-positive rate (TPR), the cumulative TPR and the incident TPR, as well as the dynamic specificity, or true-negative rate. Based on the 2 kinds of time-dependent TPR, 2 types of time-dependent ROC curves are defined as follows: (a) ROC curve of a biomarker Y at time t based on the cumulative TPR and the dynamic specificity, denoted by ROCC/D(Y; t) and (b) ROC curve of the biomarker Y at time t based on the incident TPR and dynamic specificity, denoted by ROCI/D(Y; t). The definitions of time-dependent TPRs, specificity, and ROC curves (Figure S1 in the Supplemental Methods) as well as interpretation of the time-dependent ROC curves can be found from the Supplemental Method section within the Supplementary Material.
Evaluating prognostic accuracies is an important aspect of studying GBM biomarkers that has not been discussed in the literature. In this study, we use both ROCC/D(Y; t) and ROCI/D(Y; t) to evaluate biomarkers for prognosis of cumulative and incident OS events by or at a series of time points (15, 24, 33, and 42 months since GBM diagnosis). The biomarkers that we evaluated in this study were identified by the previous literature, and the values of these biomarkers for patients with GBM can be obtained directly from TCGA data set.
Materials and Methods
Data collection
The Cancer Genome Atlas Project provides data from more than 500 GBM cases as of 2015. TCGA data set can be easily accessed from its Web page: https://gdc.cancer.gov. In this study, we assessed the prognostic performance of the several promising candidate biomarkers and gene signatures reported in the literature.12 –17 Some previous research using TCGA data set reported the results of genomic and transcriptomic analysis of 206 GBM cases with about 600 genes. 18 The SAMSAN1 gene was identified as an important factor for OS among patients with GBM from another study using TCGA data. 12 In addition, by running a Cox regression model using TCGA data, Bao et al 13 found that 4 gene signatures (“5-gene,” “8-gene,” “17-gene,” and “61-gene” signatures) were associated with OS. Mir21 and Mir222 were reported to be significantly associated with OS by Rao et al. 14 In addition, MGMT methylation has also been intensively studied in the recent neuro-oncology literature. Thus, we chose to evaluate 2 microRNAs (miRNAs) (Mir21 and Mir222), 1 gene expression (SAMSN1), 4 gene signatures (gene signature based on 5, 8, 17, and 61 genes identified by Bao et al), 13 as well as the MGMT methylation.
We downloaded the miRNA expression microarray data and the messenger RNA (mRNA) expressions (level 3) of GBM samples without specifying any other conditions. The gene expressions of SAMSN1 (level 3) were based on Affymetrix microarrays (Human gene U133A). Our analytical data set was obtained by merging TCGA survival and clinical data with the patient-level biomarker data.
Statistical analysis
Patients’ characteristics were summarized as mean ± standard deviation for nonskewed continuous variables and as frequency (N) and percentage (%) for categorical variables. The Kaplan-Meier survival function and smoothed hazard rate were plotted. The OS event time is defined as the time interval between GBM diagnosis and mortality and is calculated in terms of months. Overall survival times are censored at either the loss to follow-up or the end of the study (the end of 2015).
Statistical methods have been developed to perform time-dependent ROC analysis. Hu and Zhou 5 reviewed the recent statistical development in this area. The time-dependent ROC approach developed by Song and Zhou 11 was selected (see the “Discussion” section for the reason for this choice). The AUC was used to evaluate the overall prognostic performance of the biomarkers. For Mir21, Mir222, SAMSN1, and MGMT methylation, we evaluated the prognostic accuracy for these biomarkers and the predicted scores that combine each of these biomarkers with either age or Karnofsky Performance Score (KPS), the 2 important clinical risk factors reported in literature. To obtain the predicted risk scores, multivariable Cox regression models were generated, and the predicted scores were calculated using the weighted combination of the biomarker value and one of the clinical risk factors (age or KPS). To evaluate the prognostic accuracy of 4 gene signatures, the risk scores of gene signatures for each patient based on 5, 8, 17, and 61 genes were calculated using the linear combination of the gene expression level weighted by the regression coefficients reported in Table 1 (log of hazards ratios) of Bao et al. 13
Demographic and clinical characteristics of all patients in the analytical data set and by survival status.

Data are reported as count (%) unless otherwise indicated.
Using Fisher’s exact test.
Using two-sample Student’s t test.
The Harrell C statistic 19 was used to estimate overall concordance between the OS time and each of the biomarkers described above. All statistical analyses were performed using statistical package R (www.r-project.org) versions 3.1 to 3.3 (for time-dependent ROC analyses, with code written by N.H.) and Stata (Stata Corp., College Station, TX, USA) version 14 (for all other analyses).
Results
Table 1 reports the demographic features of our study cohort. Our raw data set includes 584 patients with GBM, of which 3 subjects were missing information on OS status and were excluded from all analyses related to survival. The mean age of the 584 patients was 57.9 ± 14.4 years, and their mean KPS was 77.4 ± 14.6. Our analytical cohort includes 581 patients with observed OS status, of which 138 subjects were alive and 443 patients were dead at the end of the follow-up period. Most of the patients (359 patients, 61.4%) were men. About 87% (N = 505) of the patients in our analytical cohort were white, 7% (N = 40) were black, and 2% (N = 13) were Asian. About 94% (N = 545) of these patients had untreated primary (de novo) GBM and 3% (N = 20) had treated primary disease. The median OS time was 14 months (Figure 1). The hazard rate function has 2 local peaks at around 20 and 90 months before it eventually rises toward the end of the study follow-up time (Figure S2 in the Supplemental Results).

Kaplan-Meier product-limit survival curve of overall survival among all patients with GBM in The Cancer Genome Atlas. The median survival time among these patients is about 14 months. GBM indicates glioblastoma multiforme.
MicroRNAs
A total of 565 patients within our analytical cohort had measurements of Mir21 and Mir222. The Harrell C statistic for Mir21 and Mir222 was 54% and 56%, respectively. For both Mir21 and Mir222, when a clinical risk factor (either age or KPS) was included in the predicted risk score (as the classifier), the overall concordance (the Harrell C) rose. The Harrell C statistic of Mir21 increased to 66% and 62% when age and KPS, respectively, were involved. For Mir222, the Harrell C value increased to 66% and 64% when age and KPS were involved, respectively.
Figure 2 shows the time-dependent ROC curves, ROCC/D(Y; t) (panel A) and ROCI/D(Y; t) (panel B), of Mir21 (denoted by Y in ROC curve notations) for prognosing OS events by or at t = 15, 24, 33, and 42 months. The ROC curves for predicted risk scores combining Mir21 with clinical risk factors (age or KPS) were also shown in the plot. The overall accuracy of Mir21 for prognosing cumulative OS events by 15 months was 0.539 and increased gradually to 0.566 by 42 months. When age was included in the predicted risk score, AUC for prognosing cumulative OS events increased to 0.688 and 0.756 by 15 and 42 months, respectively. When KPS was included in the prognosis, the overall performance also improved but not as much as the predicted risk score that included age as a clinical risk factor. When prognosis of incident OS events was considered, AUC for Mir21 was around 0.530 at all of the 4 time points. When age was included in the predicted score, the AUC increased to 0.629, 0.611, 0.602, and 0.598 at 15, 24, 33, and 42 months, respectively. When KPS was included in the predicted score, there was also an increase in AUC, although the improvement was much smaller than when age was incorporated. Figure 3 shows the time-dependent AUC of Mir21 based on ROCC/D(Y; t). The AUCs for Mir21 and the 2 predicted risk scores all increased from baseline toward month 60. For example, for AUC of the age-involved predicted risk score increased from 0.58 at baseline to 0.79 by month 60. The time-dependent AUC curve based on ROCI/D(Y; t) can be found from Figure S3 in the Supplemental Results. Figure 4 plots the time-dependent ROC curves of Mir222. For prognosis of cumulative OS events, the AUC of Mir222 was 0.597, 0.625, 0.648, and 0.664 by 15, 24, 33, and 42 months, respectively. However, the AUC of Mir222 for prognosing incident OS events at these time points was 0.574, 0.574, 0.575, and 0.575, respectively. When age or KPS was included in the classifier, AUC for both ROCC/D(Y; t) (panel A) and ROCI/D(Y; t) (panel B) went up, whereas the predicted risk score incorporating age increased more dramatically. Figure 5 plots the AUC of Mir222 based on ROCC/D(Y; t). When using Mir222 expression as the classifier, AUC for prognosing cumulative OS events increased gradually from 0.550 at the beginning to 0.680 by 60 months. When age was included in the predicted risk score, the AUC increased from 0.660 to 0.760 by 60 months. When KPS was involved in the predicted risk score, the AUC ranged from 0.610 to 0.670. It is interesting to note that, after about 30 months, the AUC of Mir222 expressions was greater than that of the predicted score combining Mir222 and KPS. The time-dependent AUC based on ROCI/D(Y; t) can be found from Figure S4 in the Supplemental Results section.
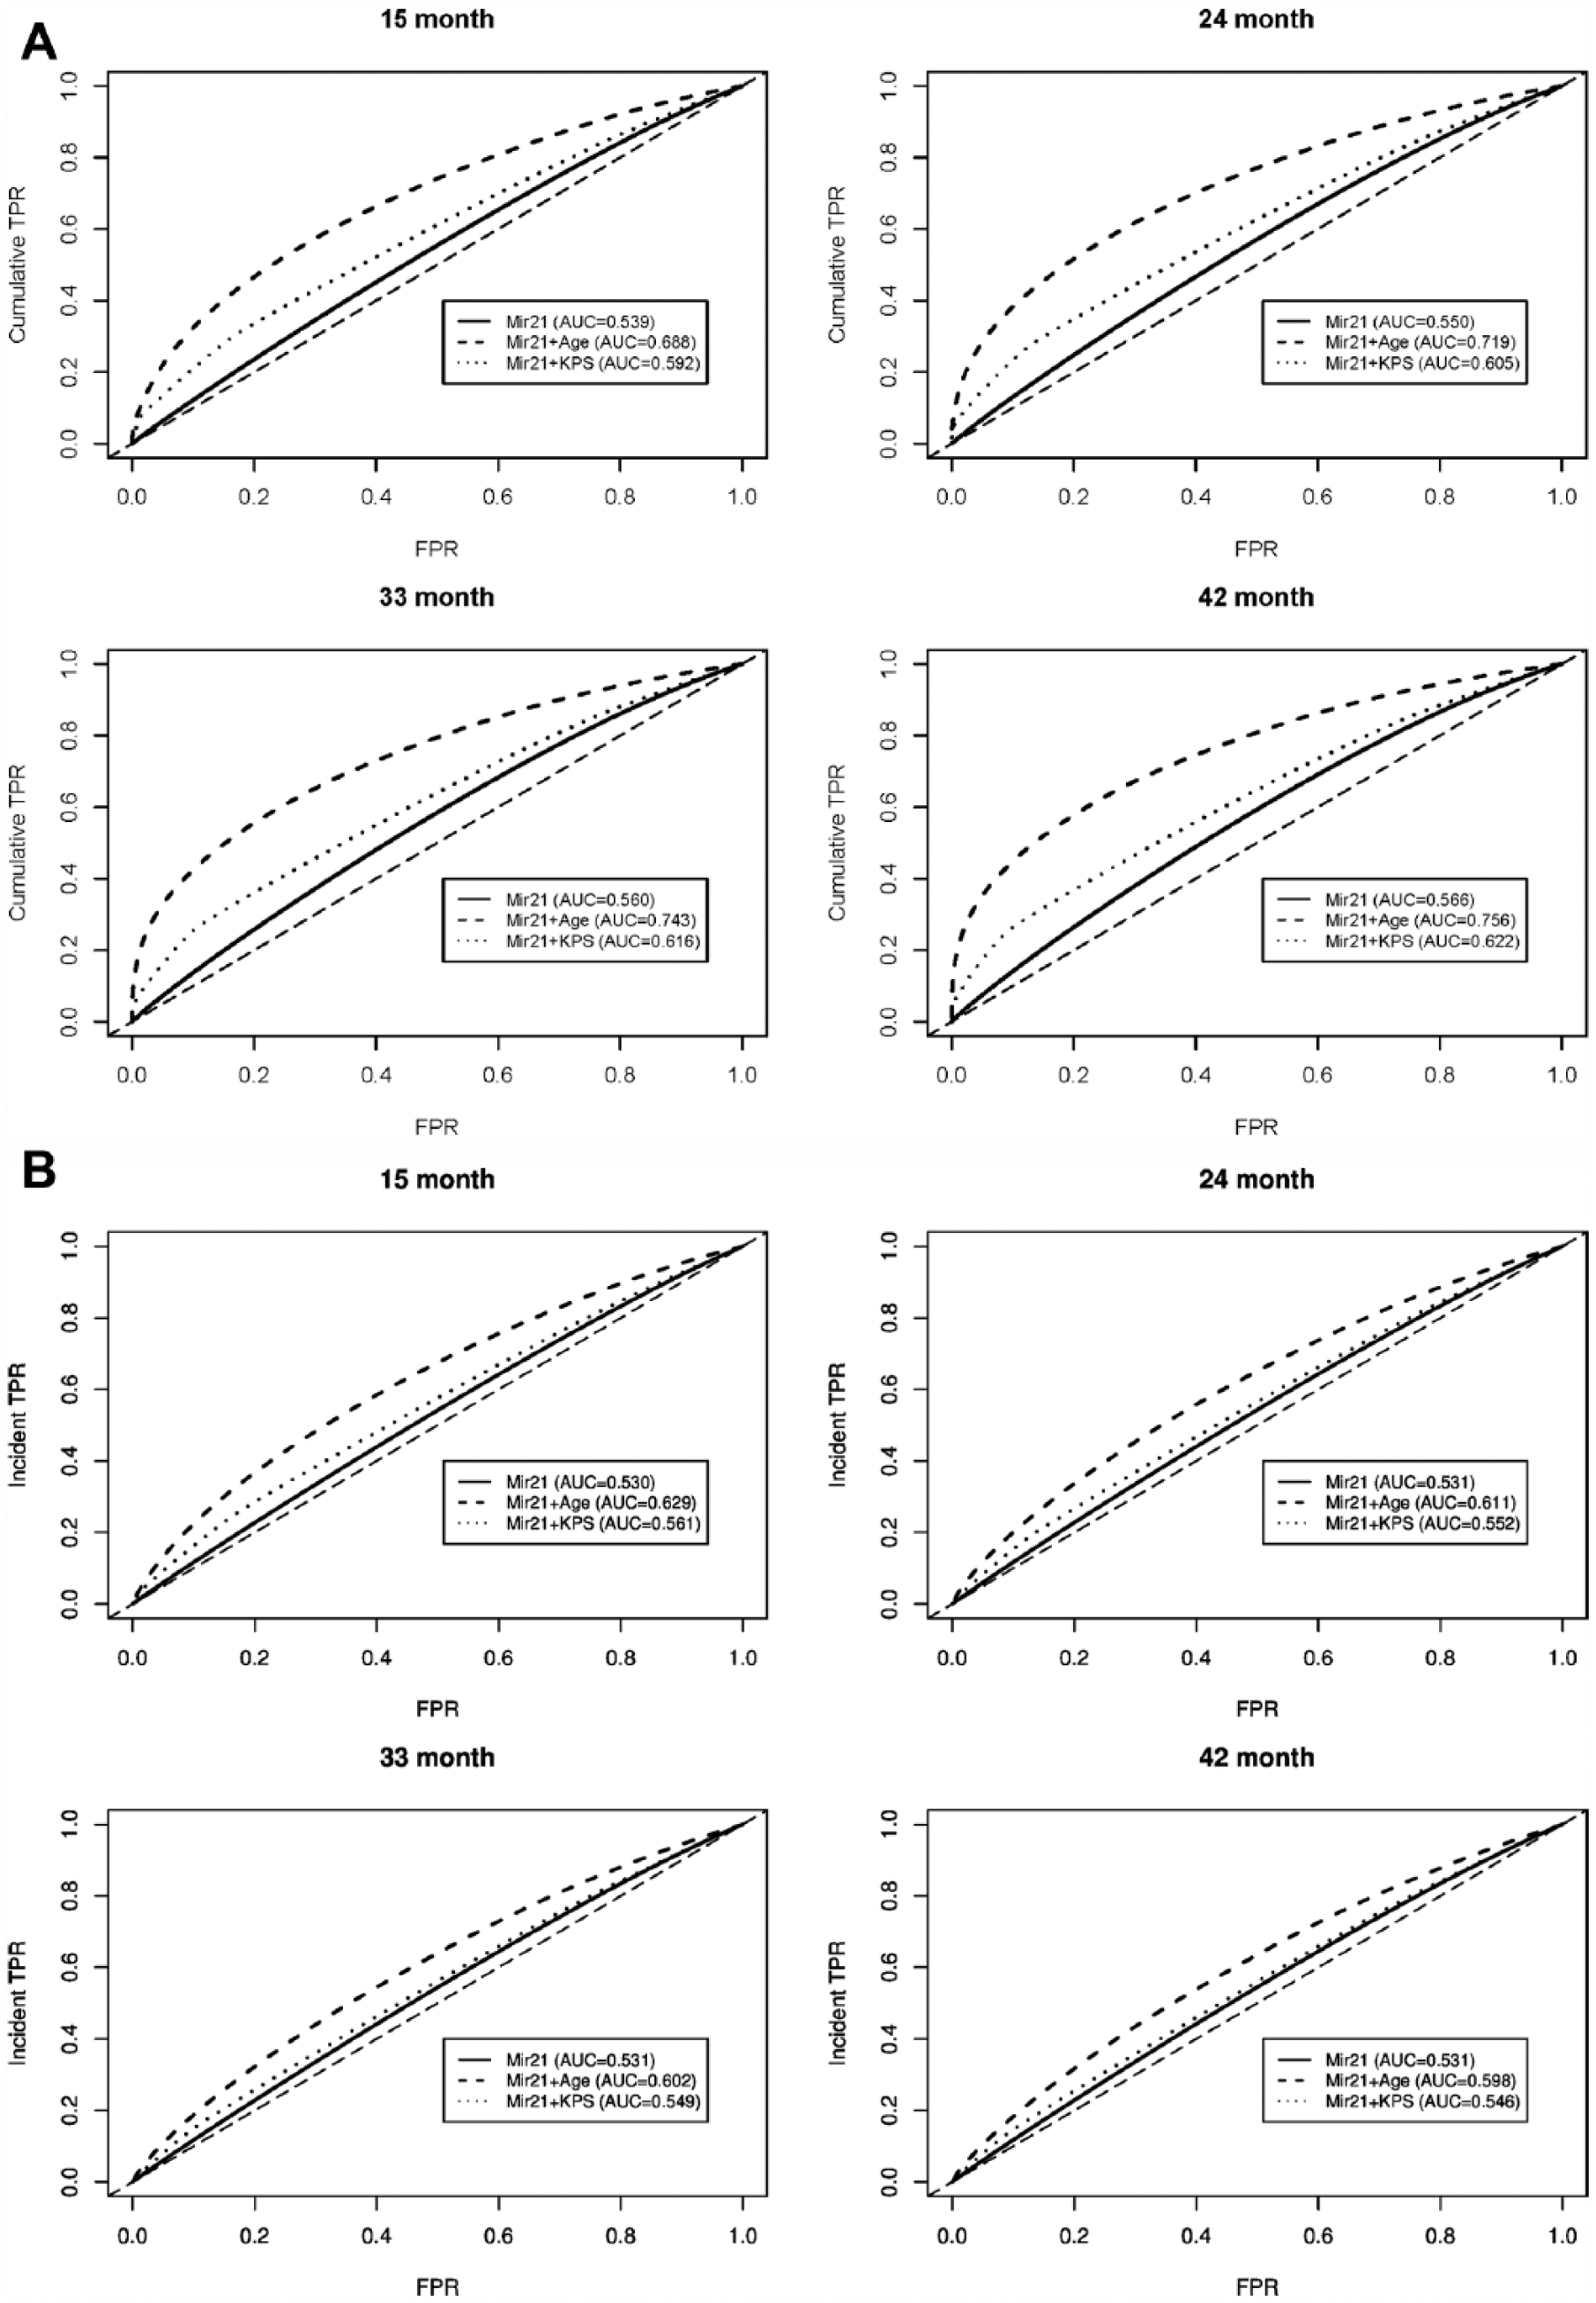
Time-dependent ROC curves of Mir21 based on (A) ROCC/D(Y; t) and (B) ROCI/D(Y; t) by or at 15, 24, 33, and 42 months. AUC indicates area under the ROC curve; KPS, Karnofsky Performance Score; ROC, receiver operating characteristic; TPR, true-positive rate.

Time-dependent AUC of Mir21 based on ROCC/D(Y; t). AUCs were calculated up until 5 years (60 months) after diagnosis. The Mir21 + age classifier has the best overall accuracy (largest AUC) to prognose cumulative overall survival events over the entire 60-month period, followed by the Mir21 + KPS classifier. AUC indicates area under the ROC curve; GBM, glioblastoma multiforme; KPS, Karnofsky Performance Score; ROC, receiver operating characteristic.

Time-dependent ROC curves of Mir222 based on (A) ROCC/D(Y; t) and (B) ROCI/D(Y; t) by or at 15, 24, 33, and 42 months. AUC indicates area under the ROC curve; KPS, Karnofsky Performance Score; ROC, receiver operating characteristic; TPR, true-positive rate.

Time-dependent AUC of Mir222 based on ROCC/D(Y; t). AUCs were calculated up until 5 years (60 months) after diagnosis. The Mir222 + age classifier has the best overall accuracy (largest AUC) to prognose cumulative overall survival events over the entire 60-month period. There is a crossover between the time-dependent AUC curve for Mir222 and Mir222 + KPS. This indicates that during the earlier follow-up period (~<30 months), incorporating KPS in the prognosis will result in better prognostic accuracies than only using the Mir222 expression; however, for prognosis after 30 months, including KPS will not improve the overall prognostic performance. AUC indicates area under the ROC curve; GBM, glioblastoma multiforme; KPS, Karnofsky Performance Score; ROC, receiver operating characteristic.
SAMSN1 expression
A total of 524 patients had SAMSN1 gene expressions recorded in TCGA. We calculated overall concordance (the Harrell C) of OS time with SAMSN1 expression as well as OS time with the predicted risk scores involving SAMSN1. Overall concordance between OS and SAMSN1 was only 51%. When KPS was included in the predicted risk score, the Harrell C increased to 61%. When age was involved in the prognosis, the C statistic increased to 66%.
Figure 6 plots the time-dependent AUCs of SAMSN1 based on ROCC/D(Y; t). The ability of SAMSN1 expression to predict cumulative OS events was very limited, with AUC ranging from 0.54 to 0.60. When age was included in the predicted risk score, AUC for prognosing cumulative OS events increased gradually from 0.66 to 0.80 by month 60. When KPS was involved in the prognosis, the AUC was between 0.60 and 0.65. The time-dependent ROC curve of SAMSN1 expressions is presented in Figure S5 in the Supplemental Results. For prognosing OS by 24 months, the SAMSN1 expression can achieve an AUC of 0.563. When age or KPS was included in the predicted risk score, the AUC was 0.716 and 0.615, respectively.

Time-dependent AUC of SAMSN1 based on ROCC/D(Y; t). AUCs were calculated up until 5 years (60 months) after diagnosis. The SAMSN1 + age classifier has the best overall accuracy (largest AUC) to prognose cumulative overall survival events over the entire 60-month period, followed by the SAMSN1 + KPS classifier. AUC indicates area under the ROC curve; GBM, glioblastoma multiforme; KPS, Karnofsky Performance Score; ROC, receiver operating characteristic.
Gene signatures
A total of 540 patients were included in analysis of the 4 gene signatures reported by Bao et al. 13 All of these 4 gene signatures were statistically significantly associated with OS (log rank test P < .05 for all gene signatures). Our analysis showed that among the 4 gene signatures, the 8-gene signature had the best prognostic performance. For prognosis of cumulative OS events by 24 months, the 8-gene signature attained an AUC of 0.613, whereas the AUCs for the 5-gene, 17-gene, and 61-gene signatures were 0.571, 0.594, and 0.594, respectively (Time-dependent ROC curves are presented in Figure S6 in the Supplemental Results). The time-dependent AUC based on ROCC/D(Y; t) is shown in Figure 7. For prognosis of cumulative OS events by 60 months, the 8-gene signature had the largest AUC (0.670) among the 4 gene signatures. In comparison, the AUC for both the 17-gene and 61-gene signatures was 0.650. The 5-gene signature had an AUC of 0.610.

Time-dependent AUC of 4 gene signatures reported by Bao et al 13 based on ROCC/D(Y; t). The 8-gene signature has the best overall accuracy (largest AUC) to prognose cumulative overall survival events over the entire 60-month period. The performance of the 17-gene and 61-gene signatures is similar as the time-dependent ROC curves for them are close to each other over the 60-month period. AUC indicates area under the ROC curve; GBM, glioblastoma multiforme; KPS, Karnofsky Performance Score; ROC, receiver operating characteristic.
MGMT methylation
A total of 567 subjects from TCGA were included in analysis of MGMT methylation. Figure S7 (in the Supplemental Results) plots the time-dependent ROC curves of MGMT methylation based on both ROCC/D(Y; t) and ROCI/D(Y; t). Similar to other single biomarkers, MGMT methylation had a limited ability to predict both cumulative and incident OS events. For short-term prognosis of cumulative OS events, the AUC was 0.528 and 0.551 by 15 and 24 months, respectively. For long-term prognosis, the AUC increased to 0.562 and 0.567 by 33 and 42 months, respectively. When age was involved in the prognosis, the AUC for prognosing cumulative OS events increased dramatically to 0.704, 0.729, 0.754, and 0.766 by 15, 24, 33, and 42 months, respectively. When KPS was involved, the AUC at all of the above time points was between AUC of MGMT methylation and that of predicted risk score combining MGMT with age. As for prognosis of incident OS events, the performance of MGMT methylation across the 4 time points varied little. However, when age or KPS was incorporated in the prognosis, the short-term prognostic performance at 15 and 24 months was much better than the long-term performance.
Discussion
Glioblastoma multiforme is the most aggressive and malignant type of glioma. Despite improved medical interventions including radiation, chemotherapy, and surgery, the median survival time of GBM is very low. In our study cohort, the median OS time is only 14 months, which is consistent with the 14.6-month median survival reported by Salcman. 20 Detection of new biomarkers or genetic signatures is crucial to improve accuracies for GBM prognosis. In this research, we evaluated the performance of miRNAs, gene expression, gene signatures, and gene methylation for prognosing cumulative and incident OS events using time-dependent ROC curves.
Currently, the role of single miRNAs for prognosis among patients with GBM is poorly understood. MicroRNAs usually function as small noncoding RNAs that potentially increase the instability and may limit translation of target mRNAs. 21 They are significant genetic regulators and play a very important role in pathogenesis, development, and prognosis of GBM as well as of other cancers. 22 It has been proven that miRNAs are expressed differently among patients with GBM. Previous studies have also shown significant prognostic importance of mRNAs on OS. 12 As a single miRNA, Mir21 has been widely involved in the regulation of GBM. 23 Studies have shown that Mir21 is expressed at higher levels in GBM cell lines as compared with normal cells. A high level of Mir21 was found to be significantly associated with shorter survival time. 24 The miRNA Mir222 is directly associated with the grades of GBM and is targeted at the important cell cycle regulator, p27/KIP1. By inhibiting Mir222, researchers have shown that p27/KIP1 expression was upregulated and this resulted in a decline of tumor volume. 23 Our study on prognostic accuracy, however, showed that single miRNAs have a very limited ability for an accurate prognosis of cumulative and incident OS events. For instance, the time-dependent AUC of Mir21 for prognosing cumulative OS was always lower than 0.60 within the first 60 months of follow-up.
The neuro-oncology literature reported that the SAMSN1 gene is overexpressed in glioblastoma tumors when compared with normal brain cells. A high expression of SAMSN1 indicates an unfavorable outcome of GBM in OS. Yan et al 12 reported that the median OS time was 11 months among patients with GBM with high SAMSN1 expression and about 15 months among subjects with low SAMSN1 expression. However, our study showed that when SAMSN1 expression was used on its own as a biomarker for prognosis, its ability is also limited. For prognosing cumulative OS events by 15 months, the AUC for SAMSN1 was only 0.549.
Previous studies reported that certain gene signatures were significantly associated with OS among patients with GBM. Bao et al 13 identified 4 gene signatures using a risk prediction model. Then, a cutoff value (median risk score for each signature) was used to divide patients into high-risk and low-risk groups. The authors showed that the median OS among the high-risk group was significantly shorter than that among the low-risk group. 13 In our study, among the 4 gene signatures, the 8-gene signature performed the best when prognosing both cumulative and incident OS events.
Our study showed that clinical risk factors (such as age and KPS) could play an important role in prognosing OS events among patients with GBM. Age and KPS are 2 strong known clinical risk factors that can influence OS among patients with GBM and are reported in TCGA data. Previous studies showed statistically significant negative relationships between age and the OS of GBM.25,26 That is, older ages are associated with a higher risk of mortality among patients with GBM. Using 40 years as the age cutoff, Walid 26 showed that the 5-year survival rate among patients with GBM younger than 40 years of age was 5.67 times the rate for patients at 40 years of age and older. Previous literature also revealed that patients with GBM with KPS less than 80 and more than 40 years of age had the worst survival rate. 27 This implies that age and KPS may predict OS of patients with GBM. Our study showed that involving age or KPS as a clinical risk factor can improve the prognostic accuracy of biomarkers and gene signatures. When age was combined with Mir21, Mir222, or SAMSN1, the prognostic performance usually improved dramatically. For example, when prognosing cumulative OS events by 24 months, the AUC for SAMSN1 expression was only 0.563, but when age was involved, the AUC increased to 0.716. Our time-dependent ROC results for each biomarker, each biomarker in combination with age, and each biomarker in combination with KPS provide researchers with an easy way to assess how much increment in AUC the clinical risk factors can cause. We also performed time-dependent ROC analysis on biomarkers in combination with both KPS and age. For all of the biomarkers and gene signatures being considered in this study, the prognostic performance is very close to the predicted score with only age included as the risk factor. This indicated that incorporating KPS in the predicted risk score based on age and the biomarker (or gene signature) does not further improve the overall prognostic accuracy. Sex and race are other demographic features recorded in TCGA data. We also investigated the impact of these 2 variables on prognostic accuracies, but none of them further improved the prognostic accuracies for all biomarkers and gene signatures being considered in this study.
Our analytical results showed that time-dependent AUCs based on ROCC/D(t) increased over the follow-up period (Figures 3, 5 to 7), so these AUCs were often greater at later time points than at earlier time points. Theoretically, the number of events is monotone nondecreasing under the cumulative events setting. Hence, there will always be more OS events at the later follow-up stage. When a biomarker is associated with the OS events, there will be a growth in both cumulative event rate conditional on positive test results and the survival rate conditional on negative test results. This, in turn, will elevate both sensitivity and specificity at the same positivity threshold. However, under the setting of incident events, the local estimate of the hazard rate has a large impact on the prognostic accuracies. Hence, even when a biomarker is associated with the OS events, the time-dependent AUC curve will not have a monotone trend over time. Moreover, it may have a drastic local fluctuation (Figures S3 and S4).
Time-dependent ROC analysis provides investigators with a way for prognosing both short-term and long-term survivorship. For prognosis of high-grade brain tumors, such as GBM, 24 months is often used as a threshold to classify the survivorship into short term and long term. The short-term (≤24 months) prognostic performance of biomarkers could be quite different from their long-term (>24 months) prognostic performance. Understanding long-term survivorship in GBM is a critical unmet need in neuro-oncology. Examining the prognostic performance by 33 or 42 months is a way to evaluate potential biomarkers and gene signatures that would predict long-term survivorship.
Time-dependent AUC is a good summary measure to compare the time-dependent prognostic performance among different biomarkers or predicted risk scores. For example, Figure 5 shows an obvious crossover between the time-dependent AUC curve for Mir222 expression and for Mir222 together with KPS. This indicates that at the earlier follow-up period (up until about 30 months), incorporating KPS in the prognosis will result in better prognostic accuracies than using only the Mir222 expression. However, involving KPS cannot improve the overall prognostic performance after 30 months. In addition, the AUC for Mir222 expression increased more dramatically than that for Mir222 expression over the entire 60-month period.
Methodologically, the goal of our study is to demonstrate how to apply the time-dependent ROC analysis to evaluate performance of biomarkers for prognosing cumulative or incident OS events at different time points. Pepe et al 28 suggested that 2 basic statistical approaches can be used to evaluate biomarkers. The first method is to model the risk of disease (or disease outcome such as survival) as a function of biomarkers with other predictors using logistic or Cox regression. Using this approach, the value of a biomarker is measured by its effect on OS conditional on other predictors. Pepe et al 28 pointed out that this method is adequate in etiologic research but does not address the ability of biomarkers to correctly classify or predict risk for the study population. The second method evaluates biomarkers with measures such as sensitivity, specificity, predictive values, and ROC curves. There is controversy about which approach is more appropriate. Moons and Harrell 29 claimed that risk models are much better because ultimately the patients want to know the risk of a disease given their biomarker measurement. Pepe et al 30 argued, however, that the public health value of a biomarker lies in the fraction of diseased subjects being detected (ie, sensitivity) and the fraction of nondiseased subjects falsely identified as diseased (ie, 1—specificity). The difficulty lies in the fact that these 2 approaches frequently yield apparently contradictory results. A biomarker that is strongly related to risk may be a poorly performing classifier. 30 A biomarker that is a strong risk predictor after controlling for other factors may add little to classification performance. Our study showed that both SAMSN1 and MGMT methylation have very limited ability for prognosing OS events, although the literature shows both are highly associated with OS of patients with GBM. For this reason, we believe that it is necessary to investigate the prognostic accuracy for biomarkers in addition to the prognostic importance based on regression coefficients from risk models. This warrants consideration for future studies on prognostic accuracies of GBM biomarkers. In this work, we used the analytical method proposed by Song and Zhou 11 because this approach was shown to be the most efficient among several influential time-dependent ROC methods evaluated by Pepe et al. 31
For assessing concordance of a biomarker with an event time outcome, the Harrell C statistic is often adopted. The Harrell C statistic for right censored time-to-event data is the conditional probability of concordance plus half the conditional proportion of data pairs that are neither concordant nor discordant. The benefit of the time-dependent ROC method over the Harrell C statistic lies in the way the time-dependent ROC method handles censoring. Time-dependent ROC curve methods often use time-to-event models for estimating conditional survival functions, and time-to-event models were developed specifically for dealing with censored time-to-event data. For this reason, time-dependent ROC curves should be more reliable and accurate when evaluating prognostic abilities of biomarkers. In addition, time-dependent ROC curves can estimate sensitivity and specificity at each time point of interest within the study period, whereas the Harrell C can only provide an overall concordance across the entire period.
A couple of alternatives to ROC curves and AUCs have been proposed to evaluate diagnostic tests in a more clinically meaningful way. For example, Halligan et al 32 proposed the net benefit as a measure to evaluate radiologic tests. The primary goal of our study is to introduce the time-dependent ROC analysis in neuro-oncology and apply it to prognostic studies of GBM biomarkers. Our analysis focused on the early stage of biomarker studies (ie, biomarker discovery and validation). At the stage of biomarker discovery and validation, ROC analyses are intensively used to evaluate the performance of the biomarkers; hence, the prognostic accuracy should be established before clinical meaningful measures (such as cost) can be considered. Although Halligan et al 32 claimed that the “net benefit” is more meaningful in evaluating the diagnostic performance of radiological tests, they agreed that ROC and AUC are most useful in the early stages of diagnostic test assessment, especially for tests not requiring subjective interpretation.
Study limitations
One limitation of this study is that our study data set from TCGA lacks treatment information for the patients with GBM. This limits the extrapolation of our findings to all patients, especially those that do not undergo standard-of-care therapy. In addition, this prevented us from performing a subanalysis by treatment to evaluate whether biomarkers perform differently across different treatments. In addition, some known important glioblastoma predictive factors such as extent of resection and postsurgical complications are not included in TCGA data set. Lack of information on these risk factors could limit our findings in the prognostic ability of the biomarkers and gene signatures.
Conclusions
Although some biomarkers and gene signatures are statistically significantly associated with OS of patients with GBM, their ability to accurately prognose cumulative or incident OS events is very limited. Predicted risk scores that combine biomarkers with clinical risk factors, such as age, can greatly improve the prognostic performance of these biomarkers.
Footnotes
Acknowledgements
The authors thank Ms Mingming Zhang, RN, MS, BSN, for assistance with editing tables and figures. They thank all reviewers for their insightful comments and suggestions.
Peer review:
Six peer reviewers contributed to the peer review report. Reviewers’ reports totaled 2311 words, excluding any confidential comments to the academic editor.
Funding:
The author(s) disclosed receipt of the following financial support for the research, authorship, and/or publication of this article: Funding was provided in part by the Huntsman Cancer Institute (HCI), Cancer Control and Population Sciences (CCPS) Pilot Grant CCPS HCI-Hu PI 22255. Partial support for this project through the Cancer Biostatistics Shared Resource within the HCI was provided by the HCI Cancer Center Support Grant (CCSG) P30CA042014 from the National Cancer institute and the Huntsman Cancer Foundation (HCF). Partial support was also provided by the University of Utah Study Design and Biostatistics Center (SDBC), with funding in part from the National Center for Research Resources and the National Center for Advancing Translational Sciences, National Institutes of Health, through Grant 5UL1TR001067-02 (formerly 8UL1TR000105 and UL1RR025764).
Declaration of conflicting interests:
The author(s) declared no potential conflicts of interest with respect to the research, authorship, and/or publication of this article.
Author Contributions
NH conceived and designed the experiments. NH and HC analyzed the data and wrote the first draft of the manuscript. NH, HC, and KZ contributed to the writing of the manuscript. NH, HC, KZ, and RJ agree with manuscript results and conclusions and jointly developed the structure and arguments for the paper. NH and RJ made critical revisions. All authors reviewed and approved the final manuscript.
Disclosures and Ethics
All authors have read and confirmed their agreement with the ICMJE authorship and conflict of interest criteria. The authors have also confirmed that this article is unique and not under consideration or published in any other publication and have permission from rights holders to reproduce any copyrighted material.
References
Supplementary Material
Please find the following supplemental material available below.
For Open Access articles published under a Creative Commons License, all supplemental material carries the same license as the article it is associated with.
For non-Open Access articles published, all supplemental material carries a non-exclusive license, and permission requests for re-use of supplemental material or any part of supplemental material shall be sent directly to the copyright owner as specified in the copyright notice associated with the article.