
Abstract
The objective of this study is to assess standardized histograms of signal intensities of T2-weighted magnetic resonance image (MRI) modality before and after preoperative chemotherapy for nephroblastoma (Wilms’ tumor). All analyzed patients are enrolled in the International Society of Paediatric Oncology (SIOP) 2001/GPOH trial. 1 The question to be answered is whether the comparison of the histograms can add new knowledge by comparing them with the histology of the tumor after preoperative chemotherapy. Twenty-three unilateral nephroblastoma cases were analyzed. All patients were examined by MRI before and after preoperative chemotherapy treatment. T2 modalities of the MRIs were selected, and histogram changes were compared to histopathological data available after surgery. Of the 23 tumors, 22 decreased in volume following chemotherapy (median –57.99%; range 15.65 to –90.82%). The preliminary results suggest that standardized histograms of signal intensities of T2 MRI in nephroblastoma is not predicting histopathological diagnostic information and has no implications for the clinical assessment for further chemotherapy.
Introduction
Nephroblastoma is the most common malignant renal tumor in children. Dramatic improvements in survival rates have occurred as a result of advances in interdisciplinary treatments and prospective multicenter clinical trials and studies conducted by the SIOP (International Society of Paediatric Oncology) in Europe and COG (Children's Oncology Group) in North America. Main objectives of these trials and studies are to treat patients according to well-defined risk groups in order to achieve highest cure rates, to decrease the frequency and intensity of acute and late toxicity, and to minimize the cost of therapy. In that way, the SIOP trials and studies largely focus on preoperative treatment. 1 The concept of neoadjuvant chemotherapy plays an important role in the treatment of most pediatric solid tumors today. 2 The complete surgical removal of a shrunken tumor is facilitated, mutilation caused by surgical procedures is minimized or avoided, and micrometastases, not visible at diagnosis, are treated as early as possible. Besides that, response to treatment can be measured individually by tumor volume reduction and/or percentage of therapy-induced necrosis at the time of surgery in the histological specimen. This gives an early individual prognostic parameter and is used for individualizing postoperative treatment. 1 An open question is whether imaging studies can add new knowledge to the biology of this rare malignant tumor.
Procedures and Methods
DoctorEye platform
DoctorEye 3 is an open access, flexible, and easy-to-use platform for intuitive annotation/segmentation of tumor regions and histograms generation. Its clinically driven development within the context of the European Commission (EC) funded ContraCancrum project 4 followed an open modular architecture focusing on plug-in components. DoctorEye's main advantage is that the end user can quickly and accurately delineate complex areas in medical images offering a number of tools for facilitating the delineation of areas with complicated shapes. Also, it has extended functionalities for histogram analysis for assessing candidate imaging biomarkers.
The DoctorEye platform has advanced segmentation/annotation tools, which allow end users to select any area of interest according to our previously reported results. 5 Most precise is the manual tool, named Pencil tool. The only disadvantage is time-related restriction. Segmentation and annotation of the areas of interest require more time compared to available (semi) automatic Magic Wand and Active Contours (Greedy & Snake) tools. An example output (in red color) of the Pencil segmentation and annotation is presented in Figure 1.

Screenshot of DrEye with annotation of a nephroblastoma.
Ethics
Approval for use of data from a previous study for the research presented here was granted by the Ethics Commission of the Medical Council of Saarland. This research was conducted in accordance with the principles of the Declaration of Helsinki.
Segmentation of nephroblastoma tumor (manual technique)
Using the DoctorEye platform, physicians carefully performed the segmentation of the Wilms’ tumors manually in each magnetic resonance image (MRI) slice in order to annotate the tumor regions of interest precisely. Also, for minimizing the inter- and intra-observer variability, there was a consensus delineation process between clinicians in order to define a commonly accepted region of interest in each case. In addition, DoctorEye enables the user to perform most precise delineation between different areas of interest. The combination of the tools Magic Wand, Pencil and Eraser makes it possible to correct small details while still being effective in terms of time management. In every session, the user is able to set a personal balance between accuracy and processing time, depending on current priorities in the clinical setting. If certain areas are difficult to demarcate because of their structural complexity, it is possible to change from the Stretch mode, which makes the current image fill as much of the screen as possible, to the Zoom In mode. By using this feature, it is possible to magnify the selected area of the image to different degrees and thereby to facilitate the differentiation and segmentation of the investigated structures. 6
Histograms generation method
Acquisition parameters of MRIs are not standardized and can vary widely in changing tumor appearance dramatically. The MRIs in this research project were collected from a multicenter trial without a standardized protocol for imaging parameters. In order to compare different MRI scans, the first step is to rescale the gray scale range of each sequence to [0–255] in a standardized way. The histogram of signal intensities was generated for all images in the available data set. The left side of the horizontal axis represents low signal intensities (black and dark areas), and the right-hand side represents high signal intensities (light and pure white areas) within the tumor. We normalized the histograms such that the histogram entries sum up to 1.
The standardization is needed, as we want to compare histograms of single patients before and after preoperative chemotherapy. In addition, a line according to the location of the center of mass of each histogram is calculated and plotted within the histogram (see Fig. 2). The rescaling does not change the shape of the histogram, and the relative movement of the center of mass stays the same. In this particular study, it was the best that could be done since there was no a priori protocol to ensure that all imaging conditions would remain constant before and after therapy.
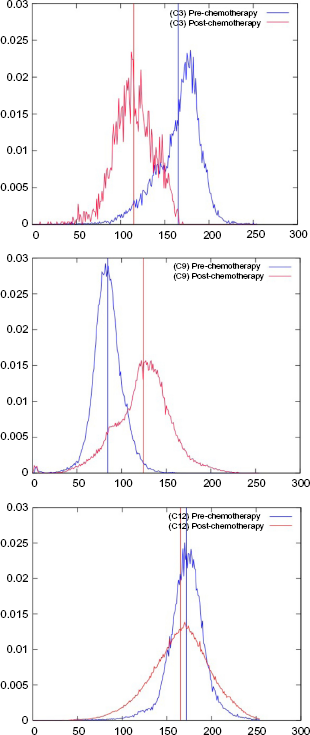
Examples of standardized histograms of signal intensities with center of mass (from top to bottom cases 3, 9, and 12).
Addressing Pre-/Post-Chemotherapy Changes
Nephroblastoma presents as a large, solid tumor of renal origin. The tumor may be homogeneous, but typically appears heterogeneous in MRI with intermediate signal intensity on T1-weighted images and high signal intensity on T2-weighted images. 7 In all our cases, we annotated, segmented, and generated the histograms exclusively for T2-weighted images because of increased signal intensities. Bleedings, fat tissue, necrosis, and cysts can cause highly variable signal intensities. Bleedings into the tumor occur relatively frequently (27%). 8 We tried to minimize the influence of the acquisition parameters on signal intensity by the standardization process.
Size and extent of tumor regions have been precisely identified and annotated/segmented. In general, nephroblastomas are easily delineated from the renal parenchyma because of the presence of the pseudocapsule. This pseudocapsule corresponds to compressed renal tissue at the edge of tumor and appears hypointense in T2-weighted sequences. 8
The main goal of the conducted Wilms’ tumor segmentation activities was to address the pre-/post-chemotherapy changes in MR images. The aim was to identify and to interpret changes of standardized histograms of MRI (T2) signal intensities after chemotherapy in nephroblastoma and to compare these results with the histopathology of the tumor.
Wilms’ tumor regions in MR pre-/post-chemotherapy images of 23 cases/patients have been segmented and annotated (Table 1). In all the cases, the following selection criteria were applicable:
Nephroblastoma tumor shrinkage and the related histopathological subtype with the shift of the center of mass between time at diagnosis and after preoperative chemotherapy (23 cases) (* between standardized histogram at diagnosis and after preoperative chemotherapy).

confirmed unilateral Wilms’ tumor (post-surgery histopathology results);
availability of Wilms’ tumor's histopathology subtype data (post-surgery histopathology);
presence of pre-/post-chemotherapeutic DICOM images (MRI) data sets; and
enrollment in SIOP 2001/GPOH trial (signed informed consent).
Close to annotated and segmented MR images, we calculated the absolute and relative pre-/post-chemotherapy tumor volume change (Table 1) based on imaging data. In addition, the histopathological subtype – taking into consideration necrosis and blastema as two important histological components related to prognosis of the tumor – is correlated with the difference of the center of mass of the standardized histograms of signal intensities between the time of diagnosis and after preoperative chemotherapy (Table 1). Out of 23 patients, three representative standardized histograms with centers are shown including pre- and post-chemotherapeutic histograms (Fig. 2).
In addition, we analyzed the correlation between the shift of the center of mass and volume change and histological parameters (% of necrosis, blastema, epithelia, and stroma) of the resected tumor. These findings are presented in five scatter plots (Figs. 3 and 4). There is a significant correlation (p = 0,03) found between the center of mass shift and the volume change of the tumor after preoperative chemotherapy (Fig. 4). No such correlations exist in the histopathology sub-typing of nephroblastoma (Fig. 3).

Scatter plots between the shift of the center of mass and histopathology subtypes of the resected tumor after preoperative chemotherapy.
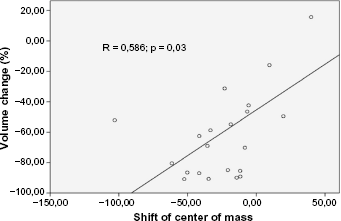
Scatter plot between the shift of the center of mass and tumor volume change after preoperative chemotherapy.
Findings and Preliminary Conclusions
Our findings (Table 1) confirm that most of the Wilms’ tumors do shrink after preoperative chemotherapy. Of the 23 tumors, 22 decreased in volume following chemotherapy (median –57.99%; range 15.65 to –90.82%). Only in one case, there is an increase of tumor volume after preoperative chemotherapy (case C9). In this case, there is also a shift of the center of mass to the right (higher signal intensities) as is shown in Figure 2, which interestingly is the highest shift found in this work. Therefore, the first observation is that significant histogram shift (as described by the center) might be correlated in some cases with response to therapy. In addition, Figure 4 shows the only significant correlation found between the shift of center and the tumor volume change after preoperative chemotherapy. However, to confirm these findings, further research is necessary in larger studies.
In this initial study, there are only four cases with a shift of the center of mass to the right. Taking all 23 cases together, the shift of the center of mass seems not to be useful for categorizing tumors according to their percentage of necrosis or the different vital tumor components. Neither univariate analysis of the center of mass at the time of diagnosis nor at the time after preoperative chemotherapy or the difference of these centers of mass of the standardized histograms do correlate with the histological subtype of the Wilms’ tumor.
Altogether, it was not possible to demonstrate a correlation between the standardized histograms of T2 signal intensities and histological subtypes of Wilms’ tumor. The shift of the center of mass of the histograms of signal intensities between the time of diagnosis and after preoperative chemotherapy was not correlated with histopathology However, the histogram shift seems to be an important marker that could be potentially useful for the trained clinician to observe subtle changes after therapy. This, however, needs to be further researched and elaborated with more advanced statistical analysis in a larger pool of patients possibly considering a number of histogram percentiles separately.
Our approach of analyzing histograms of signal intensities of MRI studies has the benefit to be a low cost and noninvasive source of patient-related new information. Histogram analysis is done also by other groups in cancer and other diseases using also other parameters like the coefficient of variation (CV), skewness and kurtosis, and texture analysis.9, 11 Up to now, no clear benefit could be proven. Solely in renal cell carcinoma, Chandarana et al did show that voxel-based whole-lesion enhancement histogram analysis is feasible and that “these parameters can potentially be used to differentiate clear cell from papillary subtype renal cell carcinoma.” 11
Concluding, further research is needed to define imaging modalities as prospective markers for histopathology in Wilms’ tumor. The addition of other MRI modalities into such an analysis is promising as found in other tumors like glioblastoma. 12 In addition, diffusion-weighted (DWI) MRI might help in distinguishing histological subtypes of Wilms’ tumor as the apparent diffusion coefficient (ADC) is a measure of the magnitude of diffusion of water molecules, and thus inversely correlates with the cellularity of a tissue. 13
Author Contributions
Conceived and designed the experiments: SM, RD, KM, NG. Analyzed the data: SM. Wrote the first draft of the manuscript: RD, NG. Contributed to the writing of the manuscript: SM, RD, KM, NG. Agree with manuscript results and conclusions: SM, RD, KM, NG. Jointly developed the structure and arguments for the paper: SM, RD, KM, NG. Made critical revisions and approved final version: SM, RD, KM, NG. All authors reviewed and approved of the final manuscript.