
Abstract
One of the gravest dangers facing cancer patients is an extended symptom-free lull between tumor initiation and the first diagnosis. Detection of tumors is critical for effective intervention. Using the body's immune system to detect and amplify tumor-specific signals may enable detection of cancer using an inexpensive immunoassay. Immunosignatures are one such assay: they provide a map of antibody interactions with random-sequence peptides. They enable detection of disease-specific patterns using classic train/test methods. However, to date, very little effort has gone into extracting information from the sequence of peptides that interact with disease-specific antibodies. Because it is difficult to represent all possible antigen peptides in a microarray format, we chose to synthesize only 330,000 peptides on a single immunosignature microarray. The 330,000 random-sequence peptides on the microarray represent 83% of all tetramers and 27% of all pentamers, creating an unbiased but substantial gap in the coverage of total sequence space. We therefore chose to examine many relatively short motifs from these random-sequence peptides. Time-variant analysis of recurrent subsequences provided a means to dissect amino acid sequences from the peptides while simultaneously retaining the antibody-peptide binding intensities. We first used a simple experiment in which monoclonal antibodies with known linear epitopes were exposed to these random-sequence peptides, and their binding intensities were used to create our algorithm. We then demonstrated the performance of the proposed algorithm by examining immunosignatures from patients with
Introduction
Cancer is a dangerous disease that presents numerous challenges for diagnosis and treatment. Because cancer cells are technically foreign, the host immune system is often slow to respond to tumor antigens,1,2 or the immune system can be evaded or suppressed in numerous ways. 3 In addition, the patient may not experience symptoms for months or years after tumor initiation. 4 The quiescent time between tumorigenesis and diagnosis is a window of opportunity for intervention. Unfortunately, until tumors are large enough to be detected by standard clinical methods, subclinical or presymptomatic detection is challenging. Biomarker molecules that are specific to the tumor are still very rare and become diluted in the bloodstream. 5 Clearly, then, some form of amplification must be done to increase the tumor signal over biological noise.
DNA or RNA may present a biological molecule that can be amplified outside the host. By isolating a sufficient quantity of blood, one might capture enough tumor-specific nucleic acid molecules to amplify a signal. However, one must know target sequences, and nucleic acids are notoriously unstable, especially in historical samples. In contrast, antibodies are amplified by the body itself, are stable in blood, and are self-renewing. If a B-cell is stimulated, it will continue to produce its antibody in amounts up to 1% of the total circulating immunoglobulins. Therefore, it is quite possible that antibodies may provide a solution to the biomarker dilution problem.6–8 However, as with nucleic acids, the question remains: what antibody is the most predictive, sensitive, and accurate for a given disease?
There are 109 different antibodies circulating at any given time. Which antibody or group of antibodies is informative? There must be a way to interrogate antibodies in an unbiased way. Previously, immunosignatures have been shown to provide a “snapshot” of the humoral immune system.9–12 Although these examples demonstrate the diagnostic potential of the “signature,” there is no biological understanding conveyed, at least not directly. These demonstrations of immunosignatures as diagnostic agents ignored the wellspring of information contained in the sequences of the signature peptides. Although not required for diagnosis, the sequences must convey some information about the antibodies that make up the signature. Previous experiments with a relatively low-density peptide microarray of 10,000 (10K) different 20-mer peptides showed that epitope identification from these few random-sequence peptides was extremely difficult. 13 Recently, we developed a 330,000(330K)-peptide microarray that greatly enhances identification of informative sequences. 12
Immunosignature Technology
Immunosignatures may provide a link between the genetic alterations that occur within tumor cells and the way in which the immune system responds to aberrant cells. 14 Immunosignatures represent the pattern of binding between serum antibodies and random-sequence peptides attached to a microarray surface. Technically, this interaction would be considered “off-target” or “nonspecific” because no actual epitopes or protein sequences were intentionally included as part of the peptide library. Statistically, in 330K short random-sequence peptides, there would be little homology to existing proteins. Perfect matches to full epitopes are thus extremely rare. One might therefore expect little-to-no binding between these peptides and a monoclonal antibody. However, binding between antibody and peptide is enhanced when peptides are packed at a particular density, enabling local avidity to increase the apparent affinity by lowering the off rate. 11 Low-affinity interactions that would normally be dissociated during awash step are instead retained, generating reproducible patterns of binding between peptides and antibodies. Three general classes of signatures are typically seen when serum is processed on these immunosignature peptide microarrays: 1) signals that are person specific, with little-to- no population-specific disease information; 2) signals that are invariant regardless of person or disease state; 3) signals that change according to disease and are common within a disease cohort. This third class represents antibodies that are raised against a pathogen or against an aberrant cell, such as a tumor, commonly across persons with the same disease. The peptides that bind these antibodies become the “immunosignature” for that disease. 10–12,15 This implies that a disease, whether chronic,9,16,17 autoimmune,18,19 or infectious,12,15,20 has some immunological stimulus that can be diagnostic or even prognostic.
Immunosignatures are composed of “features,” or peptides, which define the diagnostic pattern. To date, very little has been done with the sequence information, mostly because early immunosignature arrays had only 10K peptides. 13 Computer lithography techniques have enabled logarithmic increases in peptide density; now, hundreds of thousands of peptides can be synthesized in smaller spaces. 12 With this increase in peptide number comes an increase in the ability to recognize epitope motifs within the feature peptides. 21
A challenge faced when analyzing random-sequence peptide microarrays is how to integrate peptide sequences and mean fluorescence intensity (MFI) measurements to identify epitope sequences. Although mimotopes can be abundant, they do not help in tracking of an eliciting antigen. NNAlign is an algorithm that attempts to solve this problem by generating neural network models from subsets of the peptide array data and then combining those multiple models into a single motif. 22 This algorithm provides a representation of amino acid probabilities at each position in the estimated motif. Another method for motif/epitope estimation uses regular expressions to estimate epitopes and includes a dependence on the position of the subsequence within the peptide sequence. 21
Random-sequence peptide microarrays differ from panning methods (phage display, mRNA display) and focused arrays containing only the proteome of interest23,24 in fundamental ways. Respectively, these methods require either biochemical selection with potential bias, possibly leading to loss of ancillary information, or assumptions about specificity within and between pathogen proteomes, which may prove too optimistic.
In this manuscript, we propose and explore a signal-processing-based method to estimate epitope and mimotope sequences using random-sequence peptide microarrays. We then explore an example of finding epitopes of predicted frameshift antigens in serum samples from patients with brain cancer.
Methods
Immunosignature Random-Sequence Peptide Microarrays
The proposed algorithm is first validated using immunosignatures obtained from eight different monoclonal antibody samples. The immunosignature assay is performed by incubating antibodies on a microarray of random-sequence peptides. The peptides are synthesized on silicon dioxide wafers and diced into standard 25 mm by 75 mm slides. The 330K random-sequence peptide microarrays have 330,034 probes. The sequences are sufficiently long such that binding occurs between an antibody and a subsequence of the peptide, but probably not to the entire peptide sequence. The average length of the peptide sequences on the 330K microarray is 11.2 amino acids, with a standard deviation of 1.3; 95% of the peptides are between 5 and 14 residues long, the maximum length being 22. From among the 20 different natural amino acids, cysteine, isoleucine, methionine, and threonine are excluded. These lengths do not include the constant C-terminal sequence glycine-serine-glycine, which links the peptide to the array substrate.
Processing of the microarrays was done as published by Stafford et al. 11 , with the exception that the arrays were first washed in dimethylformamide for 1 hour. The solvent phase was transitioned to an aqueous phase over a 6-hour period using a phosphate-buffered saline incubation buffer before incubating in the presence of antibodies or serum. To enable binding of the antibodies to the arrays, the arrays were washed in distilled water and then loaded into a multiwell 24-up gasket. Each well received an incubation buffer and diluted antibody, typically at a final concentration of 500 pM. A secondary fluorescent detection antibody was applied to the array at 500 pM and allowed to bind to the primary antibody. After incubation for 1 hour, the arrays were washed using an enzyme-linked immunoassay plate washer. When using patient serum, a primary dilution of 1: 1500 was done, but all other steps remained the same. The arrays were dried, scanned at 1 μm resolution, and the resulting images were processed to provide raw microarray image data using GenePix Pro (Molecular Devices, Santa Clara, CA, USA). The antibody binding strength was measured by the fluorescence; stronger binding results when more antibodies bind to the peptide and thus more secondary antibodies bind to the primary antibodies. A calibrated picture was taken of the fluorescing array, where in pixels in the image had been associated with specific peptides.
The problem of identifying motifs from relatively short, random-sequence peptides is substantial. In a study conducted by our group 21 , we demonstrated several successes, but we were unable to correlate failures to any known mathematical or biochemical source. We also did not examine samples where the target epitope is not a naturally occurring protein. We therefore wished to approach the problem using time-frequency (TF) mapping rather than multiple alignment methods, and we examined cancer rather than infectious disease. The approach that follows describes one possible path for using TF transformations, which might enhance the precision of motif identification, and we apply this method to an analysis of brain cancer. The description of the algorithm is provided in the context of the immunosignature data of monoclonal antibodies against known, linear, contiguous peptide targets. We first describe how the peptides are dissected into subsequences and then explain how those subsequences are fed into a time-variant transformation.
Forming Peptide Subsequences
Our objective is to detect and identify subsequences from the peptides obtained from the 330K random-sequence microarray. The peptides we examine are identified (down selected) by a feature-selection method described in the study by Stafford et al.
10
Subsequences are partial sequences within the peptides selected. Note that the selected peptides from a given monoclonal antibody could correspond to the actual linear epitope or the peptides could be mimotopes, sequences with no homology to the cognate antigen. We consider an immunosignature microarray consisting of 
Here,
To achieve our objective, we find the number of times each unique subsequence of length Λ is repeated on the microarray. We form all possible unique subsequences as the union of all subsequences from the 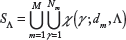
In practice, it is uncommon for a single peptide to contain repeated subsequences. Even when this occurs, it is only for the smaller length subsequences of Λ = 4 or Λ = 5 amino acids at most. It is much more common that different peptides share the same subsequences.
TF Mapping of Peptide Subsequences
The proposed peptide subsequence estimation algorithm is based on first mapping the peptide amino acids to unique signals and then using TF signal-processing techniques to detect recurring patterns. The mapping uses the basic Gaussian signal, 
The time-shift parameter 

TF representations: (
Note that we denote 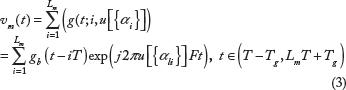
Peptide Subsequence Estimation Algorithm
Once the set
Estimation of Subsequences with Single Amino Acid Substitutions
Subsequences formed by replacing a single amino acid with another amino acid are called point mutations or single amino acid substitutions. Although substituting one amino acid can significantly change the peptide structure and binding characteristics, sometimes the effect is unimportant to structure or binding. Silent mutations occur when the substitution is by an amino acid with similar properties as the original amino acid, resulting in no significant change in functionality. As a result, single substitutions of amino acids with similar properties are important to consider for estimating specific types of subsequences such as epitopes and mimotopes.
Equation (1) can be modified to estimate subsequences with single amino acid substitutions at a time. In particular, the design of the proposed algorithm is inherently matched to handle substitutions with computational ease. This is because the algorithm only needs to find subsequence matches with identical mapped time shifts, as they represent the position of an amino acid in the sequence; all frequency shifts are allowable as they represent the amino acid type. Note, however, that we need to keep track of the exact amino acid substitution to determine the OCRC of a silent mutation. The resulting approach for estimating silent mutations is described in Equation (2).
Peptide Sequence down Selection and Bias Normalization
Although the 330K peptide microarray has a large number of unique peptides, not all peptides are applicable for detecting antibody subsequences that bind to specific antigens. To avoid unnecessary processing, we down select the peptides using two different schemes. The first scheme down selects peptides with high MFIs; this is because only a small fraction of the peptides binds strongly and specifically to the monoclonal antibody samples. The remaining peptides bind weakly and nonspecifically, and thus do not provide sufficient information on the sample antibodies. Antibody peptides that bind specifically, but only somewhat strongly, to antigens are not down selected. These peptides can be down selected by the second scheme that is based on the Pearson's correlation coefficient (PCC). The PCC down selects peptides that bind strongly to only one of the monoclonal antibody samples. It is calculated between a vector of MFIs and a reference vector, and it measures the similarity between the two vectors. PCC values of −1, 0, and 1 imply negative correlation, no correlation, and positive correlation, respectively. For each of the 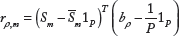

The MFIs in (
Results
The data analyzed consisted of 330K peptide microarrays for eight monoclonal antibody samples. Algorithm 1 provides the steps for estimating epitopes and identifying mimotopes based on finding unique subsequences and their OCRC. The most frequently occurring subsequences in the down-selected peptides are selected as the estimated epitopes. The algorithms also provide a list of additional subsequences that do not occur as frequently as the epitope estimates but still occur a sufficiently large number of times to warrant further investigation. These subsequences are proposed as potential antigen mimotopes as they appear to have readily permissible substitutions of the true epitopes.
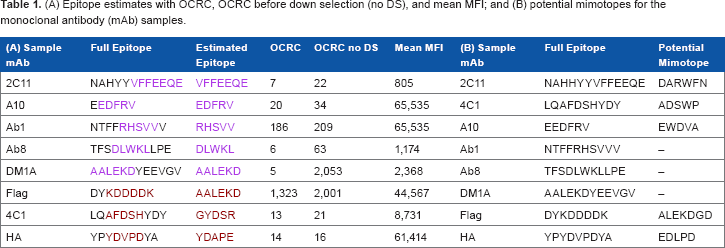
Using the proposed algorithms, we estimated epitopes for the eight monoclonal antibody samples listed in Table 1A, together with their corresponding OCRC, OCRC (before down selection), and mean MFI. The estimate for each sample corresponds to the subsequence that occurred most frequently on the sample microarray after peptide down selection. As shown, the algorithms estimated exact subsequences for the full epitopes for five monoclonal antibodies, 2C11, A10, Ab1, Ab8, and DM1A; close matches were obtained for 4C1, FLAG, and HA. The expanded results for monoclonal antibodies 2C11, A10, and HA are provided in Tables 2, 3, and 4, respectively, listed in descending order by OCRC. The tables provide details, further considered in the Discussion section, on how Algorithm 1 was applied to provide the final estimated epitopes in Table 1A. These results demonstrate both the diversity of the peptides on the microarray, spanning enough of the possible sequence space to bind all eight monoclonal antibodies, as well as the high performance of the epitope estimation algorithm in finding relevant epitopes. We also used the algorithms to identify potential mimotopes for the monoclonal antibody samples, as listed in Table 1B. Although these mimotopes do not match the amino acid subsequences of the full epitopes, they can potentially act as subsequences that uniquely bind to the monoclonal antibodies, without matching the amino acid composition of the epitope. We deduced the following considerations for potential mimotopes when analyzing random-sequence peptide microarrays: mimotopes are (i) distinctively different from the epitope of a specific monoclonal antibody sample; (ii) distinct across all eight monoclonal antibody samples; (iii) notably different from other peptide subsequences when comparing binding strength and/or OCRC. From these considerations, we developed the following four criteria to identify potential mimotopes. A mimotope subsequence of a monoclonal antibody sample
(A) Epitope estimates with OCRC, OCRC before down selection (no DS), and mean MFI; and (B) potential mimotopes for the monoclonal antibody (mAb) samples.
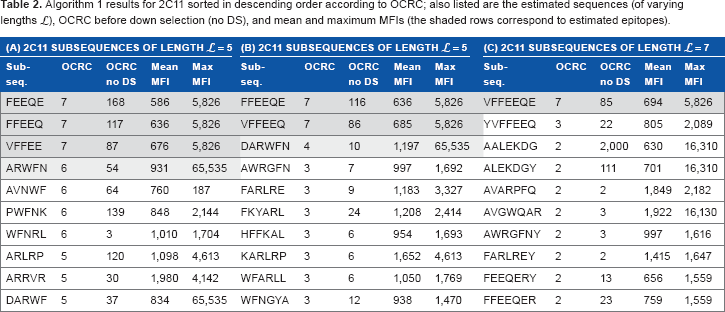
Algorithm 1 results for 2C11 sorted in descending order according to OCRC; also listed are the estimated sequences (of varying lengths £), OCRC before down selection (no DS), and mean and maximum MFIs (the shaded rows correspond to estimated epitopes).
Algorithm 1 results for A10 sorted in descending order according to OCRC; also listed are the estimated subsequences (of varying lengths £). OCRC before down selection (no DS), and mean and maximum MFIs.

Algorithm 1 results for HA sorted in descending order according to OCRC; also listed are the estimated subsequences (of varying lengths £), OCRC before down selection (no DS), and mean and maximum MFIs.

C1: is not an exact or a single substitution match to a full or an estimated monoclonal antibody epitope.
C2: is not sufficiently similar to high-occurring peptide subsequences of other monoclonal antibody samples
C3: has a sufficiently large MFI
C4: has a large OCRC, obtained using the down-selected monoclonal antibody peptides.
By following these criteria, we were led to potential mimotopes for the monoclonal antibody samples 2C11, 4C1, A10, FLAG, and HA shown in Table 1B. Subsequences of the remaining monoclonal antibody samples did not meet all of the aforementioned criteria, and thus they were not identified as potential mimotopes. The expanded results that demonstrate the choice of identified mimotope for samples 2C11, A10, and HA are also provided in Tables 2, 3, and 4, respectively. Given these results, we examined data generated using the same 330K peptide microarrays.
Discussion
Herein, we examine a method by which antigen motifs may be estimated from very short random-sequence peptides. The peptides were obtained from a process known as “immunosignaturing,” a process by which sera or monoclonal/polyclonal antibodies are exposed to random-sequence peptides in a microarray format. Disease diagnosis can be made without the need to determine epitope information9–12,14,15,17−22 from the peptides. Early low-density 10K-peptide microarrays provided almost no legible motifs, even when examining peptides from monoclonal antibodies against known linear targets. 13 However, the 330K-peptide high-density arrays 12 have provided far more precision in motif identification. 21 We therefore attempted a signal-processing method to extract epitope information from hundreds or thousands of short, random-sequence peptides. We tested the concept using monoclonal antibodies and then present a use case where sera from patients with GBM were used to generate an immunosignature, from which peptide sequences are compared to a translated mRNA library from GBM tumor lysate. We show that motif finding in short random-sequence peptides is possible and, in some cases, can offer details about eliciting epitopes.
Epitope Estimation Performance Analysis
The epitope estimation performance is analyzed in Tables 2–4 for monoclonal antibody samples 2C11, A10, and HA. We first obtain estimates using Algorithm 1 as the subsequences that occur most frequently within the down-selected peptides for varying subsequence lengths
Factors Affecting Algorithm Performance
As the microarray peptides are typically much longer than the estimated epitopes, the monoclonal antibodies must bind to only a fractional portion of a peptide. It is therefore possible to infer that a particular subsequence contributed to the binding if that subsequence is present on multiple peptides with large mean MFIs. The success of the estimation algorithm also depends on the diversity of the microarray peptides; this is achieved using the sufficiently large 330K random-sequence peptide microarray – the earlier 10K printed microarray had longer 20-mer peptides but did not perform well enough to estimate epitopes.
13
In particular, many of the shorter-length subsequences were found to repeat numerous times throughout the 330K library. As a result, this increased the robustness of the estimation algorithm and also allowed for an analysis of single amino acid substitutions based on binding strength. To determine how well subsequences of different lengths are represented, we list the number of potential subsequences on the microarray in Table 5. On the 330 K-peptide microarray, approximately 90% of Length = 4 and 50% of Length = 5 subsequences occur on the array. Moreover, many of these subsequences are repeated multiple times, as shown in Table 6. As observed, most of the
Number of possible and unique subsequences of varying lengths on the microarray.

Percentage of subsequences of varying lengths that are repeated on the microarray at least G times.

The performance of the epitope estimation algorithm is tightly coupled to the frequency and diversity of the subsequences in a microarray. By “frequency,” we mean how often a specific subsequence (of fixed length) occurs in the whole microarray. This is important because it affects the total number of peptides to which the antibodies bind. As a result, the number of down-selected peptides containing an epitope subsequence increases. Those subsequences are at the top of the OCRC. “Diversity” implies the variety of peptide subsequences that are included in the entire 330K library. As it is not possible to provide the details of every selected epitope, to demonstrate the effect of these factors and the data trends on algorithm performance, we next discuss specific subsequences for monoclonal antibody samples Ab1, 4C1, FLAG, and HA.
Our analysis demonstrated that it is possible that the full epitope does not correspond to the subsequence with the highest binding strength. This is demonstrated for the monoclonal antibody sample Ab1, with full epitope NTFFRHSVVV. Table 7A lists the matched subsequences, their OCRCs, and the corresponding mean MFIs for Ab1. Although the residue T occurs in the full epitope, we do not consider this residue in our estimation as it was not used to generate the peptides.33 Furthermore, when computing the OCRC of a short subsequence whose identical amino acid pattern appears in a longer subsequence, we do not include the OCRC of the longer subsequences. For example, when computing the OCRC of HSVV, we did not include the peptides that contain RHSVV, RHSVVV, or any other higher-length subsequences of NTFFRHSVVV. This is because we wanted to ensure that the OCRC metric for HSW is not influenced by the binding strength of longer subsequences. From Table 7A, we can conclude that although RHSW has the highest binding strength, the smaller HSW also has a high binding strength when compared to other subsequences. No conclusions can be made from the single occurrence of RHSVVV because some variability exists in the MFI measurements and because multiple subsequence occurrences are required to disambiguate which subsequence on a peptide caused the antibody binding. Moreover, longer subsequences such as FFRHS, FRHSV, and HSVVV have very low binding strength. Thus, the results for Ab1 are apparently typical for other samples in that not all sub-subsequences of the epitope bind strongly to the antibody. Typically, the longest subsequence was estimated and is listed in Table 1A. This often corresponded to the most dominant subsequence – the subsequence with the highest binding strength. For Ab1, the dominant subsequence was RHSW (shaded in Table 7A). Note that not only RHSW but also HSW occurred more frequently than the other
Subsequences of varying lengths Λ for (A) Ab1 and (B) HA1, and (C) HA2 subsequences that do not occur as often or that have lower binding strength.

The exact epitope was not estimated for the monoclonal antibody HA. The full epitope of this monoclonal antibody is YPYDVPDYA. The estimated epitope YDAPE appears to be a substitution (at positions 3 and 5) of the exact epitope YDVPD. We thus selected this nonexact epitope as our estimate because the exact subsequence occurred very infrequently on the array. Tables 7B and 7C show the occurrences of different epitope subsequences and the mean MFIs for the antibody epitope subsequence YDVPD and the estimated epitope sequence YDAPE, respectively. Although the antibody epitope sequence YDVPD occurred on the array with a high binding strength, the estimated epitope subsequence YDAPE occurred more frequently and with almost as high binding strength. The exact epitope was also not estimated for the monoclonal antibody FLAG. The nonexact estimate for FLAG was ALEKDGD. The similarity of this estimated epitope for FLAG, and the true epitope of DM1A, maybe due to the similarities between their true epitopes and the scarcity of sufficiently long true epitope subsequences of FLAG. The important overlap between these two epitopes is the KD amino acid pair and the permissive binding of FLAG antibodies, which may reflect its unusual highly charged epitope.
The sparse distribution of true epitope subsequences of FLAG on the array is seen in Table 8A. The only true epitope subsequence with high binding strength was DYKDD; however, this subsequence only occurred twice on the array, which is not very frequent for a length

Scatter plots of the MFIs of FLAG compared to the MFIs of (
(A) Subsequences of varying length Λ for FLAG and (B) identified mimotopes for five monoclonal antibody samples with corresponding OCRC, OCRC without down selection (no DS), mean MFI, and maximum MFI.

Substitution Analysis
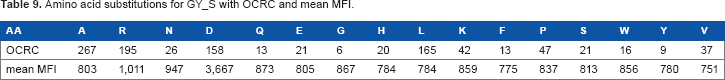
The epitope estimates are derived from the array peptides that contain that specific epitope subsequence. In addition to that specific subsequence, there are other peptides on the array that contain that same subsequence, but with a single amino acid substitution. Our proposed algorithm for detecting subsequences using single amino acid substitutions is provided in Algorithm 2. Using this algorithm, we can analyze how these single residue substitutions affect the binding strength. In so doing, we see that antibody: peptide binding is not exact, but that some of the amino acids in the epitopes can be substituted without much of a loss in binding strength. In some cases, these substitutions increase the binding strength. We have previously reported on this phenomenon.11,28 However, specific residues in the epitope subsequence are also absolutely required for the binding. Substituting them with different amino acids can dramatically decrease the binding strength. One example of this is seen in Tables 9 and 10, which show amino acid substitutions at positions that are tolerant of substitutions and intolerant of substitutions, respectively. Figure 4A and B contains plots of the MFIs listed in the tables; the plots clearly show how much more tolerant of substitutions 4C1 is for epitopes in the first amino acid of the subsequence YDS than it is for substitutions in the third amino acid of the subsequence GYS. The tolerance for amino acid substitutions is particularly helpful when trying to estimate an epitope whose exact subsequences do not appear frequently on the array. This is true for FLAG, where the third residue of the exact subsequence KDDD is substituted to form subsequence KDGD. This subsequence appears more frequently on the microarray.

The mean MFIs for two different substitutions of GYDS: (
Amino acid substitutions for GY_S with OCRC and mean MFI.
Amino acid substitutions for _YDS with OCRC and mean MFI.

Mimotope Identification Performance Analysis
The proposed approach identified some potential mimotopes in Table 1B, for five of the monoclonal antibody samples we analyzed. As discussed in the Results section, we provide selected criteria that we developed using mimotopes to monoclonal antibodies. Although our mimotope analysis is only theoretical, we found that our criteria seem to match mimotope identification approaches in recent publications.20,29,30 More specifically, in the study by Roche et al. 8 , mimotopes were identified from peptide sequences by T cells with common receptors as they resulted in increased antigen-specific immunity. As the authors discuss, optimizing the identification of mimotopes can lead to improvements in antigen-specific vaccines. Mimotopes were identified for a monoclonal cancer antibody using phage display screening of random peptide libraries. 6 Similar to our findings, the mimotopes were selected based on their strong binding to the original peptides. It was also noted that stronger binding was obtained with single residue substitutions. In the study by Reineke, et al. 30 , mimotopes for monoclonal antibodies were investigated for biomarker assay development. It was found that the diversity of mimotopes is inversely correlated with binding strength. 31
Tables 2–4 contain information about the potential mimotopes for monoclonal antibody samples 2C11, A10, and HA. For example, the potential mimotope for 2C11 is the lightly shaded subsequence DARWFN in Table 2B. This subsequence meets the four criteria C1–C4 listed for mimotopes in the Results section. Furthermore, some of its subsequences, ARWFN, ARWF, and WFN, are seen in the
Applications
As seen in Figure 5, the 330K-peptide microarray is capable of identifying peptides for disease-specific antibodies even through the milieu of nondisease antibodies that compose the humoral immune repertoire. For each disease in Figure 5, there are hundreds of peptides that specifically bind to patient sera for a given cancer type, but not to sera from patients with other types of cancer. The peptides selected in this way probably have reasonably high selectivity for the disease of interest, in this case GBM, a grade IV astrocytomal brain cancer. Peptides are shown on the top right of Figure 5, and simple alphabetical sorting illustrates a strong tendency to common motifs that extend to the N-terminus of these peptides. Deeper searches reveal common motifs buried within the peptides, and some found near the C-terminal linker. A simple alignment against a three-frame translated mRNA tumor library reveals numerous “hits” when the brain cancer peptides are aligned to the brain cancer mRNA library but not when aligned to esophageal, breast, or ovarian cancer mRNA libraries. In fact, when these GBM samples were processed on the 10K-peptide low-density arrays, some overlap was seen between the 10K library and the 330K library, although there was no intentional overlap in these libraries. To ensure that the RNAs thus identified were actually generated in diverse tumor samples and were not an artifact of the RNA library construction, a tumor lysate from multiple GBM patients was used as the source for extracting RNA. These RNA molecules were amplified using flanking primers to the predicted frameshift mutations. In every case, the predicted frameshift was amplified. Although there are probably many nonlinear or nonprotein, or even wild-type, autoantigens generated by tumors, this experiment demonstrates that the principles espoused in this manuscript may enable deciphering of the eliciting antigens produced by tumor cells in the same way that the monoclonal antibodies were deciphered.
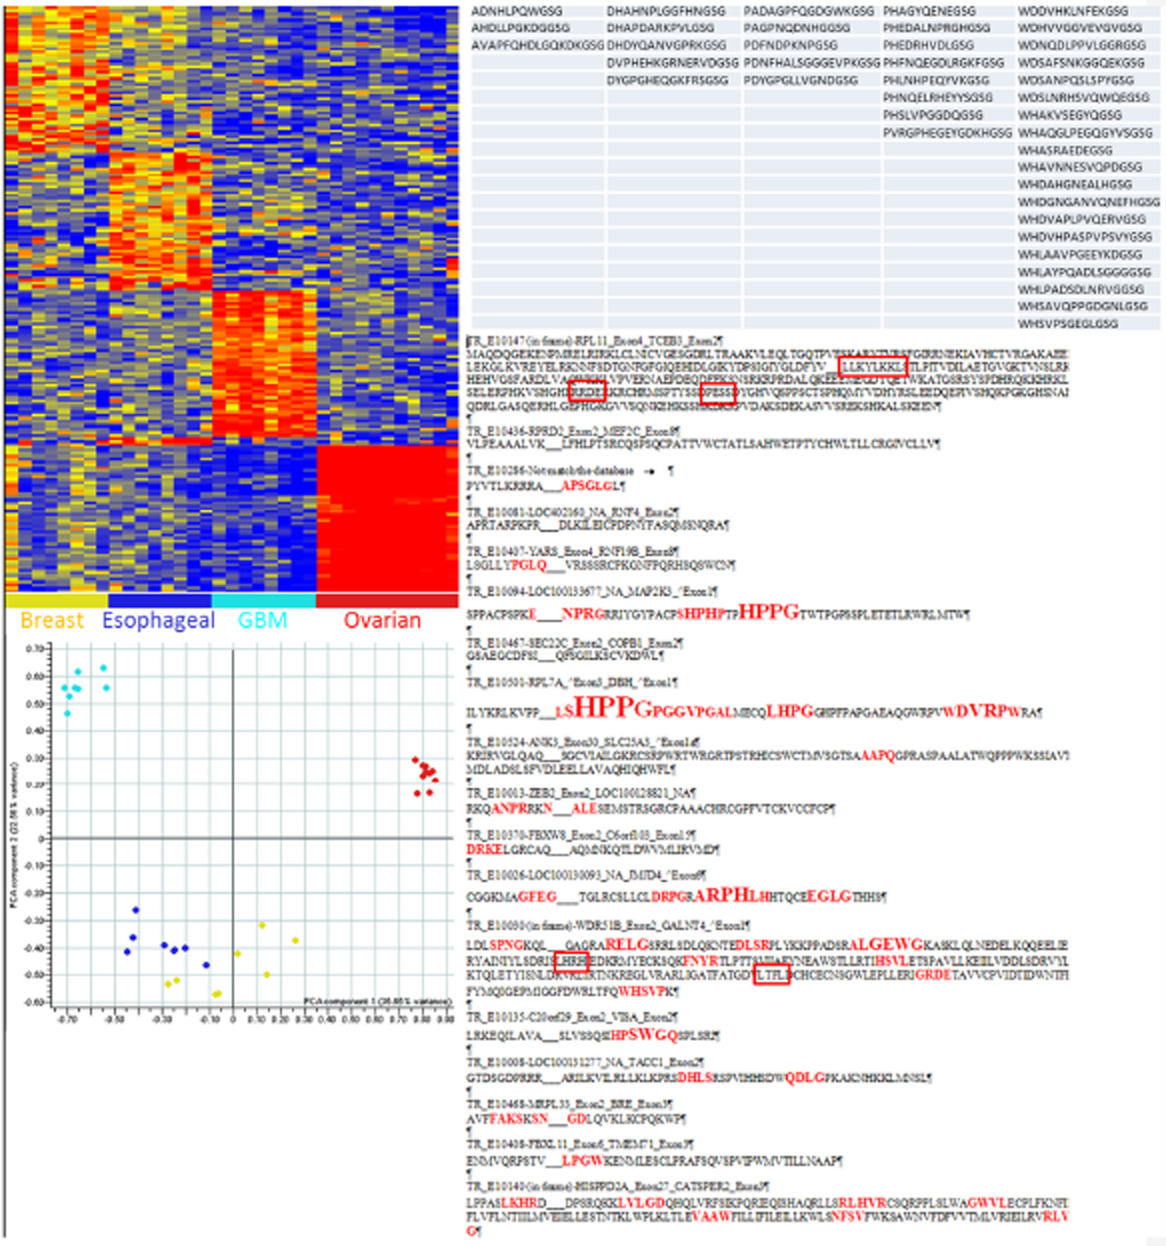
Specificity of immunosignatures (left) and mapping of
Conclusion
We propose an advanced signal-processing technique for detecting unique subsequences from microarray peptide sequences. The technique combines a unique mapping of the peptide amino acids to highly localized Gaussian signals and a time-frequency processing method that iteratively extracts Gaussian signals undergoing the same time and frequency shifts. We use the technique with the immunosignature of random peptide sequences to effectively estimate epitope antigen subsequences. We demonstrated this result by analyzing eight monoclonal antibody samples, for which we estimated the exact (or close-to-the-exact) epitope subsequence matches. As our approach inherently allows mapping and processing of amino acid substitutions in peptide sequences, we were also able to analyze the effect of substitutions on the binding strength of the estimated subsequences. In particular, we showed that shorter subsequences, with lengths of four or five amino acids, resulted in many single amino acid substitution subsequences on the peptide array. We also applied the technique to identify plausible mimotope antigen subsequences, and we found a number of potential mimotopes for the monoclonal antibody samples. Using actual human serum samples from patients with advanced brain cancer, we demonstrated that subsequence epitope identification can work even within the complex mix of nondisease immunoglobulins. Immunodiagnostics and immunotherapeutics are possible results from this research. Although mimotopes as vaccines and therapeutics may not have been the panacea once envisioned, this method enables a rapid screen on inexpensive microarrays with fair-to-high resolution of both natural and mimotope targets.

Molecular evidence of frameshift RNA sequences in brain cancer tumor samples: samples are listed on the left (ME, MER, TX, and TK). Only seven of the frameshifts from Figure 5 are tested. Each frameshift is listed along the top and uses the same designation as in Figure 5. Actin is provided as a control (far right). Arrows indicate the correct size of the predicted frameshift product.
Author Contributions
Conceived and designed the Experiments: PS. Analyzed the data: PS, BO, AM. Wrote the first draft of the manuscript: BO. Contributed to writing the manuscript: BO, AM, PS, AP Agree with manuscript and conclusions: BO, AM, PS, AP Jointly developed the structure and arguments for the paper: BO, AM, PS, AP. Made critical revisions and approved the final version: PS. All authors reviewed and approved the final manuscript.
Footnotes
Acknowledgments
We thank Dr Adrienne Scheck for her collaboration on the immunosignature studies of brain cancer. Dr Scheck kindly provided valuable resources, including serum samples, molecular marker data, tumor tissues, and RNA libraries. Without her encouragement and support, immunosignature research of brain cancers would be greatly impaired.