
Abstract
Background:
The Regional Basis of Solid Tumor (RBST), a clinical data warehouse, centralizes information related to cancer patient care in 5 health establishments in 2 French departments.
Purpose:
To develop algorithms matching heterogeneous data to “real” patients and “real” tumors with respect to patient identification (PI) and tumor identification (TI).
Methods:
A graph database programed in java Neo4j was used to build the RBST with data from ~20 000 patients. The PI algorithm using the Levenshtein distance was based on the regulatory criteria identifying a patient. A TI algorithm was built on 6 characteristics: tumor location and laterality, date of diagnosis, histology, primary and metastatic status. Given the heterogeneous nature and semantics of the collected data, the creation of repositories (organ, synonym, and histology repositories) was required. The TI algorithm used the Dice coefficient to match tumors.
Results:
Patients matched if there was complete agreement of the given name, surname, sex, and date/month/year of birth. These parameters were assigned weights of 28%, 28%, 21%, and 23% (with 18% for year, 2.5% for month, and 2.5% for day), respectively. The algorithm had a sensitivity of 99.69% (95% confidence interval [CI] [98.89%, 99.96%]) and a specificity of 100% (95% CI [99.72%, 100%]). The TI algorithm used repositories, weights were assigned to the diagnosis date and associated organ (37.5% and 37.5%, respectively), laterality (16%) histology (5%), and metastatic status (4%). This algorithm had a sensitivity of 71% (95% CI [62.68%, 78.25%]) and a specificity of 100% (95% CI [94.31%, 100%]).
Conclusion:
The RBST encompasses 2 quality controls: PI and TI. It facilitates the implementation of transversal structuring and assessments of the performance of the provided care.
Introduction
A revolution within French hospitals started with the computerized recording of almost all data (administrative and medical) concerning patients, resulting in a massive amount of data generated by many hospital sources. From these data the establishment of clinical data warehouses (CDW) constitutes a key element in optimizing the opportunity for clinical and translational research.1,2
Generic frameworks and components for CDWs are available, such as I2b2, a data mart used by more than 200 hospitals worldwide.3,4 However, it does not currently provide the level of detailed analysis necessary for clinical and translational cancer research.
Because cancer evolves over time, a cancer CDW must integrate electronic health record (EHR) data with temporal information. Some existing cancer warehouses consist of enterprise-wide databases across multiple cancer types, while others are focused on particular tumor types.5-14
Only medical data warehouses with multiple sources of patient data allow the pathways of cancer patient care.
We have created a targeted clinical research real-word warehouse for cancers (the Regional Basis of Solid Tumor [RBST]) that centralizes information related to cancer patient care in 5 health establishments of 2 French departments.
The retrospective and prospective collected data were heterogeneous in their nature and semantics, including structured, partially structured, and unstructured clinical data of various data types and different levels of granularity. A web Application Programming Interface has been created and hence only data with a patient agreement are extracted. The RBST database by its capacity to automatically embend standardized data from multiple sources creates a critical mass of knowledge and expertise.
Two major challenges have hindered the establishment of CDWs, related to patient identification (PI) and tumor identification (TI). However, 2 specific quality programs permitted accurate PI (https://www.identito-na.fr) and the matching of clinical data to “real” patients and “real” tumors. The RBST integrates data from health institutions that do not share a common patient identifier and hence the first step was the creation of a centralized PI management system. The challenge in TI was to link all tumor characteristics to the actual tumor, considering that multiple primary malignancies can be diagnosed concomitantly or not to the same patient and that the clinical and biological parameters of the primary tumor can evolve over time. Moreover, sequential or multiple recurrences may occur in the same patient and tumors may spread locoregionally to organ or contiguous organs and/or metastasize to distant organs.15,16
In this study data quality in a cancer-specific CDW was assessed based on PI (using multiple sources) and TI (depending on the time of occurrence). The quality program was assessed by a multidisciplinary team composed of a clinical team and technology staff. The group was formed by medical oncologists, mathematicians, radiation oncologists, breast surgeons, organ specialists and computer scientists.
Materials and Methods
Materials
Description of the RBST
The RBST, a graph database programed in Java (Figure 1), is composed of 2 modules: RBST-Evaluation, which permits the recording and visualization of data related to patient care and follow-up, and RBST-Research, in which de-identified data permit the development of translational research and clinical projects following the use of a complex queries tool.

Description of the RBST. The graph database programed in JAVA is composed of 2 modules: RBST-Evaluation, which permits the recording and visualization of patient care and follow-up data, and RBST-Research, corresponding to de-identified data allowing the development of translational research and clinical projects following the implementation of a complex queries tool.
The working group defined essential criteria for tumors and validation process repeated during program development. The data were classified as defined data automatically extracted, structured data requiring classification or modification and unstructured data requiring natural language processing.
Data extraction (from 2005 forward) and data integration in the RBST are automated by the implementation of extract, transform, and load (ETL) tools. Depending on the source software, the RBST can be updated weekly or monthly in delta- or full-mode extraction. Data extraction involves data from homogeneous or heterogeneous sources; data transformation involves cleaning data and transforming them into a format appropriate for analysis and querying.
Data stored on the platform are annotated with standard vocabularies (such as SNOMED CT, ICD-10, CCAM, and LOIN), synonyms to allow the analysis of associations or using data repositories.17,18
Thus far, the RBST has accumulated health data for more than 20 000 cancer patients followed at 5 health institutions. This CDW is hosted by the French public interest group GIP OKANTIS which is certified for hosting health and personal data.
Technical management of the servers is carried out by OKANTIS (backup, supervision, and network control). Development and application management are carried out by the Advanced Schema Co.
Approval for this study was obtained from the French National Commission on Informatics and Liberty (1884667 v 1) and the Limoges Ethics Committee (avis-200-2016-14). Informed consent was obtained from the patients for extraction of all medical and administrative data from the health facilities’ sources and the integration of the data in a trust file.
Datasets
All file formats are accepted (csv, json, xml, txt, and pdf). Those collected by the platform are listed in Table 1.
Detailed data sets in the 6 areas depicting evolution of cancer patients.

Methods
Patient identification
The objective of PI is to match the patient’s trust data identity to the patient’s software data identity.
Health establishment partners follow the regional rules for patient identification. 19 These rules use strict patient identifiers for all of the collected medical data (birth surname, given name, birth date, and sex) and possible extended traits, such as married name, given name, and place of birth. Despite these rules, mistakes can occur.
In French healthcare institutions, a numerical key called the Patient Permanent Identifier (PPI) is created after a medical file is produced. The PPI remains the same for the rest of the patient’s life. In addition, each French healthcare establishment has a unique identifier, called the FINESS number. The RBST integrates data from 5 institutions. Furthermore, private health institutions have multiple electronic health information systems (administrative billing systems, consultations, and hospitalization) that assign multiple patient identifiers.
The PI algorithm was developed in 2 steps; in the first one, matching of the PPI/FINESS couples was checked. In case of an absence or error in the PPI/FINESS couple, the second step, based on patient traits, was triggered. Here, the Levenshtein distance was used to measure the difference between 2 words. 20
Different weights were assigned to each of the PI characteristics using a heuristic method which can be possibly improved in the future. The influence of the weights was tested by comparing extracted data with the real data for more than 1000 randomly selected patients.
Tumor identification
The TI algorithm was built step by step using data from the first 12,376 included patients. Three main features define a tumor: (1) location and laterality, (2) first diagnosis date and the evolution date of the tumor events, (3) tumor histologies.
Given the heterogeneity of the terms used to describe, for instance, tumor location or histology, 2 repositories (organ and synonym) were created by a multidisciplinary group.
Laterality was resolved by detecting the words: left, right, bilateral, and not applicable in the text and by using anatomical descriptions, such as right for the cecum location and left for the sigmoid location. Segmentation rather than laterality was preferred for some organs, such as the liver, with segments I to VIII, and the pancreas, with a head, body, and tail.
If the CIM10, tumor location, and the laterality of the source did not correspond to the 2 repositories (organ and synonym), as required, an algorithm based on the Dice coefficient 21 was run to detect the similarities of sequences between the source and the synonym repository.
The 3 steps above were followed by the development of an algorithm aimed at matching tumors from different sources. As for PI, different weights were assigned to each of the tumor characteristics.
The computation of the score allowing to identify matching tumor data was performed for each item: localization in12 126 tumors, diagnosis date in 17 527 tumors, and pathology in 7693 tumors.
Statistical methods
The outcome of the algorithm is binary (match or mismatch). To validate these classifiers, their accuracy was estimated using statistical analysis based on standard performance measures, including sensitivity, specificity, positive predictive value (PPV), and negative predictive value (NPV). These indicators were computed as TP/(TP + FN), TN/(TN + FP), TP/(TP + FP), and TN/(TN + FN), where TP, FN, TN, and FP were the numbers of true positives, false negatives, true negatives, and false positives, respectively. To estimate these indicators, their 95% confidence intervals were computed as well, using the Clopper-Pearson method 23 and based on a simple random sampling for both PI and TI.
All computations were conducted using the R programing language. 24
Results
Patient identification
The first step in PI was to detect duplicate or multiple records in the trust file, which led to the detection of 310 possible duplicates over 20 000 actual patients. These records were manually analyzed and removed if a duplicate was confirmed by the RBST administrator.
In case of absence or error of the PPI/FINESS couple (55.4% of patients), the second step was triggered.
As shown in flowchart (Figure 2), patients were considered matched if there was a complete agreement of the given name, surname, sex, and year/month/day of birth. These parameters were assigned with weights of 28%, 28%, 21%, and 23% (with 18% for year, 2.5% for month, and 2.5% for day), respectively.

PI and TI algorithm flowcharts: (A) Patient identification and (B) tumor identification.
A score of 100% permitted automatic integration of the patient data. Manual linkage by the RBST administrators was required when the global score was 80%-99% (Figure 3). This reconciliation was automatic for the subsequent integration of the data from the patient. Patient data with a score strictly less than 80% were rejected.
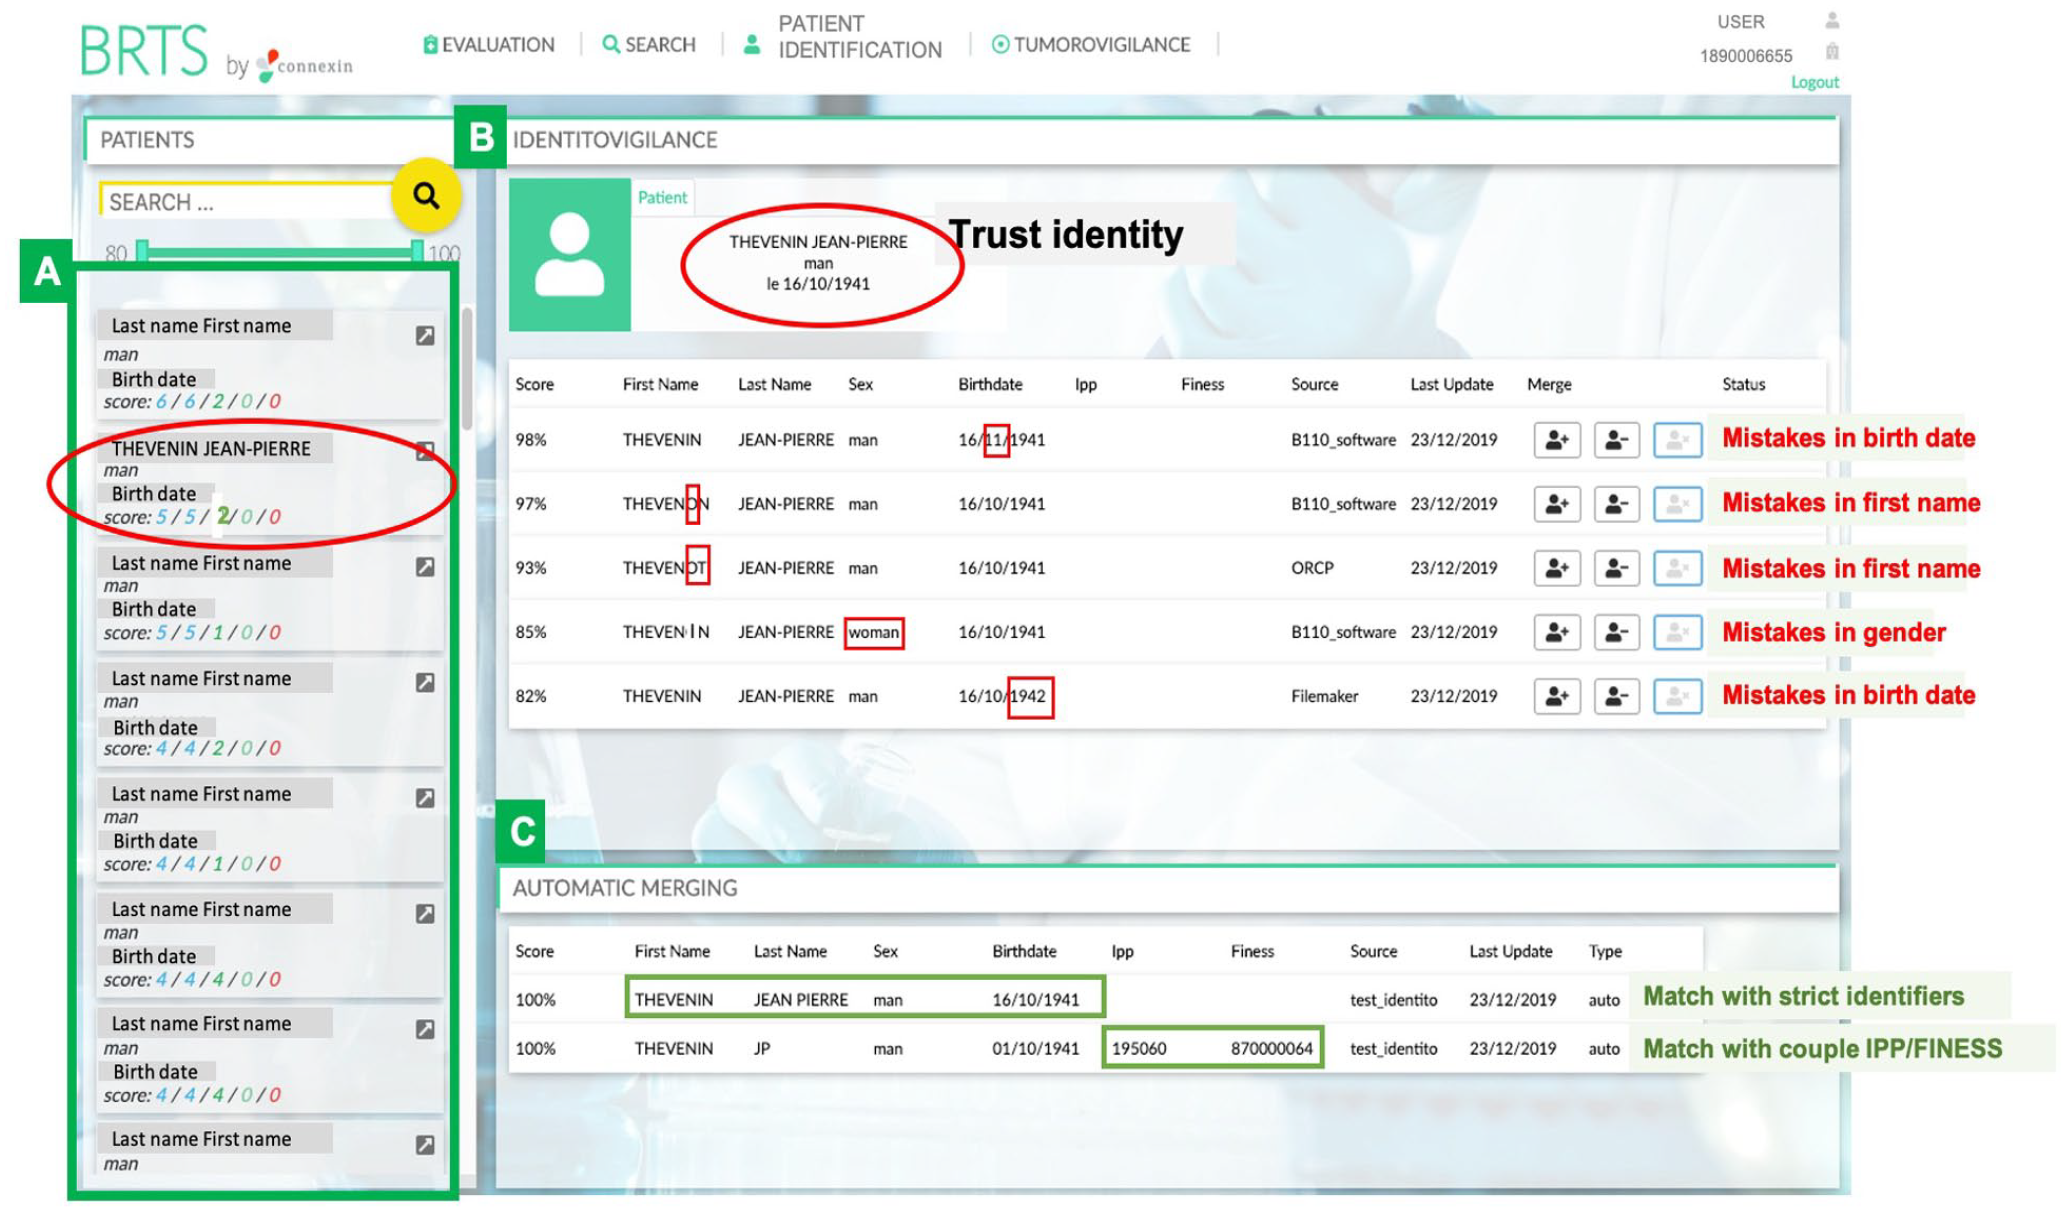
Manual patient identification interface. Trust file with a list of patients whose data required reconciliation (A). In the example framed in red (5/5/2/0/0), the RBST administrator flagged 5 cases, with the mistakes shown in red (B), 5 cases with a suggested match (B), 2 cases with an automatic match (C), 0 manual matches realized, and 0 duplicates. Only the name and surname were changed to hide identity.
The most common causes of mismatches in the trust file were:
Missing and false values in the PPI field: 1% and 40%-70% respectively;
Mismatches due to a blank entry in one field;
Mismatches in the given name field that were a result of initials having been entered in one record and the complete given name in the other record;
Mismatches due to typographical errors in the birth surname, given name, birth date, sex, or married surname;
These mismatches were automatically or manually corrected.
Using this algorithm, 91% of 20 000 (95% CI [90.59%, 91.39%]) patients were automatically integrated and 9% were reconciled by the RBST administrator.
The algorithm indicators controlled by manual observations are presented in Table 2. To calculate PI algorithm performance measures, we have performed a manual validation over 1996 randomly selected records: 644 automatic matches (all true positive), 233 rejected matches (all true negative), and 1129 records requiring manual verification (1127 true negatives and 2 false negatives).
Statistics of the patient identification (PI) and tumor identification (TI) algorithms.

Abbreviations: NPV, negative predictive value; PPV, positive predictive value.
In total, there were 644 (100%, 95% CI [99.42%, 100%]) correct automatic matches with a score of 100%; 287 of the 644 (44.57%, 95% CI [40.68%, 48.49%]) matches in the PPI field were considered valid and 357 of the 644 (55.43%, 95% CI [51.50%, 59.31%]) matches with patient traits were considered valid. For automatically rejected matches based on a score of strictly less than 80%, 223 (100%, 95% CI [98.35%, 100%]) observations were considered valid. For a PI score of 80%-99%, 1129 controls were performed: for a score of 80%-85%, 975 (100%, 95% CI [99.62, 100%]) were negative and thus considered valid; for a score of 86%-89%, 73 (100%, 95% CI [95.07%, 100%]) were negative and valid, and for a score of 90%-99%, 79 of 81 (97.53%, 95% CI [91.36%, 99.70%]) were negative and valid. Among 1129 controls, 2 observations were negative and invalid (0.18%, 95% CI [0.02%, 0.64%]). The sensitivity was 644 true positives among 646 positives (99.69%, 95% CI [98.89%, 99.96%]); the specificity was 1350 true negatives among 1350 negatives (100%, 95% CI [99.72%, 100%]); the PPV was 644/644 (100%, 95% CI [99.42%, 100%]); and the NPV was 1350/1352 (99.85%, 95% CI [99.47%, 99.98%]).
Tumor identification
Before the repositories were used,
Difficulty persisted for tumors encoded as “malignant (primary) neoplasms, unspecified or unknown.” The primary origin of these tumors may have been characterized later, leading to the recording of 2 tumors.
After these 3 steps, an algorithm was manually established using the results of each one to match 2000 tumors from different sources. A different weight was assigned to each of the tumor characteristics: 75% for diagnosis date and associated organ (37.5% for diagnosis date and 37.5% for organ), 16% for laterality, 5% for histology, and 4% for status (primary or metastasis). In detail, for the date of diagnosis, 1% of this item score was subtracted from 37.5% for each 1-day difference between dates. In situations in which the date of diagnosis was strictly identical but the organ was not indicated, a score of 75% was assigned. A difference in each characteristic between 2 tumors was counted as 0. If no information was given for some characteristics, the percentages corresponding to those characteristics were removed and an intermediate score was calculated. In summary, 2 tumors with a score greater or equal than 85% were matched automatically. Manual linkage by the RBST administrators was required when the global score was 75%-84% (Figure 4). Two different tumors had a matching score strictly less than 75%.

Manual tumor identification interface. A list of patients with tumors requiring reconciliation (A) is shown on the left. In this example, encircled in red (4/3/1), the patient had 4 tumors: 3 were directly proposed for reconciliation after treatment by the 3 tumor identification steps (B) and the fourth tumor was not reconciled automatically and had to be reconciled manually (C). The organ repository used to select the organ where the tumor was located (D) is shown on the right. Only the name and surname were changed to hide identity.
Discussion
A major challenge in the establishment of the RBST oncology specific CDW was that the data were collected in the context of patient care rather than systematically for research purposes (“secondary use”).25-27 As the RBST requires the integration of data from multiple health institutions, patient identification is of the highest priority for quality control.
In the establishment of the RBST’s PI algorithm, only patients with an identification score of 100% were matched, which involved manual controls in 9% of the cases. The PI algorithm matched most of the cases using traits (55.43%) rather than the PPI/FINESS couple (44.57%). However, trait-based identification is inherently more error prone because it relies on multiple fields (such as surname, name, date of birth), which, unlike PPI/FINESS matching, is often more vulnerable to human error and/or partial data insertion (eg, name abbreviations).
The second challenge in the establishment of the RBST involved matching tumors from different software programs, given the different formats of data collection from the different sources and classical tumor evolution over time. 28 Indeed, as described previously, 26 the data presented mistakes and missing information.
In a CDW, temporal information must be well defined. It includes, for example, the date of birth or the date of an event such as the date of a treatment or a biopsy, but also an interval between 2 dates, such as the beginning and the end of an event.
Tumor location must be correctly defined, which requires consideration of the following: (1) tumor location is designated differently according to the software, such as a designation of hepatic versus liver tumors. (2) Other information in the free-text field regarding the location of the tumor, such as laterality, is associated with the word used to express the organ; for example, a tumor may be described in the “right lung,” “the superior lobe of the right lung,” or “the lung with right laterality,” resulting in different terms that describe the same tumor. (3) Some data sources have inconsistencies in their listing of standard terminology because of updates to these standards over time. These parameters explain the different results obtained at the beginning of the CDW installation without specific repositories were used.
The process of cancer evolution despite treatment explains the challenge of linking all tumor characteristics to the actual tumor. Moreover, multiple primary malignancies can be diagnosed in the same patient (7% in our sample). The primary tumor evolves over time. Furthermore, tumors characterized by different methods (surgery or biopsy) may not have the same characteristics.
The number of patients with several primary tumors described in this CDW demonstrates the importance of creating a multiple cancer CDW. Complete tumor identification is not always possible because it dependents on the quality of the data source. In this context, repositories are essential to reconcile different unstructured data, such as the metadata repository described by Juárez et al. 29 The actual RBST tumor algorithm, based on weights attributed to tumor characteristics, including date of diagnosis, organ, laterality, histology, and status (primary or metastasis), can be adapted to all cancer-affected organs and permits quality control of heterogeneous data.
The success of our approach to the RBST will provide permanent multidisciplinary communication and allow iterative prototyping. 28
Conclusion
An effective assessment of data quality constitutes the first step in data improvement in a CDW. This work on TI and PI provides guidance for an oncological-specific CDW creation and quality control.
Footnotes
Acknowledgements
The authors thank the industrial compagny Connexin (Advanced Schema Co) and OKANTIS GIP.
Funding:
The author(s) received no financial support for the research, authorship, and/or publication of this article.
Declaration of conflicting interests:
The author(s) declared no potential conflicts of interest with respect to the research, authorship, and/or publication of this article.
Author contributions
Study conception and design: Karine Pallier, Sophie Leobon and Nicole Tubiana-Mathieu
Data collection: Karine Pallier, Thierry Denis, Olivier Giry, Sophie Leobon, Elise Deluche and Nicole Tubiana-Mathieu
Analysis and interpretation of results: Karine Pallier, Olivier Prot, Simone Naldi, Francisco Silva and Nicole Tubiana-Mathieu
Manuscript writing: Karine Pallier, Olivier Prot, Simone Naldi, Francisco Silva and Nicole Tubiana-Mathieu
All authors contributed to the manuscript, critically revised it and approved its final version.
Protection of Human and Animal Subjects
No human subjects were involved in the project.