
Abstract
In this paper, we present a new approach for mining weighted networks to identify densely connected modules such as quasi-cliques. Quasi-cliques are densely connected subnetworks in a network. Detecting quasi-cliques is an important topic in data mining, with applications such as social network study and biomedicine. Our approach has two major improvements upon previous work. The first is the use of local maximum edges to initialize the search in order to avoid excessive overlaps among the modules, thereby greatly reducing the computing time. The second is the inclusion of a weight normalization procedure to enable discovery of “subtle” modules with more balanced sizes. We carried out careful tests on multiple parameters and settings using two large cancer datasets. This approach allowed us to identify a large number of gene modules enriched in both biological functions and chromosomal bands in cancer data, suggesting potential roles of copy number variations (CNVs) involved in the cancer development. We then tested the genes in selected modules with enriched chromosomal bands using The Cancer Genome Atlas data, and the results strongly support our hypothesis that the coexpression in these modules are associated with CN Vs. While gene coexpression network analyses have been widely adopted in disease studies, most of them focus on the functional relationships of coexpressed genes. The relationship between coexpression gene modules and CNVs are much less investigated despite the potential advantage that we can infer from such relationship without genotyping data. Our new approach thus provides a means to carry out deep mining of the gene coexpression network to obtain both functional and genetic information from the expression data.
Introduction
With the fast advances in high-throughput technologies during the past 15 years, the bottleneck for advances in biomedical research has shifted from data collection to data analysis as the scientific research community moves into the “BIGDATA” era. The massive amount of biomedical data is not only challenging in terms of its large size but it is also heterogeneous and complex as characterized by high dimensions and complicated relationships. Because of such challenges, network analysis is receiving more and more attention as network is an effective way to represent complex relationships among a large number of entities. Numerous theoretical (often based on graph theory) and computational tools have been developed for analyzing, visualizing, and mining large networks. 1 5 In biomedicine, networks are commonplace such as the gene coexpression network (GCN),6,7 regulatory network, 8 metabolism network, 9 and protein-protein interaction (PPI) network, 10 just to name a few.
Among the biological networks, GCNs have been widely studied and utilized for predicting new gene functions,7,11,12 discovering new disease biomarkers,13,14 identifying PPIs, 15 and detecting genetic variants in cancers. 16 Given the gene expression profiles of a set of samples, a GCN can be established by treating each gene as a node, and the correlation between the expression profiles of two genes (nodes) is often used to annotate the edge between them. 17 With the nodes and correlation values between each pair of nodes, there are generally two ways to define the GCN. First, a threshold can be applied to the correlation coefficient values to determine if there is an edge linking the nodes. If the correlation between two nodes is higher than the threshold, an edge exists between the two nodes; otherwise the two nodes are not connected. With this approach, an unweighted GCN can be developed. While mining an unweighted network is relatively easy and can take advantage of many existing algorithms in graph theory, the results are often sensitive to the choice of the threshold on the correlation coefficients. 17 19 Thus weighted GCN (WGCN) is a more commonly adopted strategy. In a WGCN, an edge exists between every pair of nodes, while the weight for each edge is defined based on the correlation values. One of the widely used WGCN analysis tools is the WGCNA package developed by Horvath's group. 17
In analyzing a WGCN, there are two major issues. The first is how to define the weights. Given the expression profiles of genes, there are many ways to calculate the correlation. Besides the commonly used Pearson correlation coefficient (PCC), which is based on a linear model, nonlinear metrics such as Spearman rank correlation and mutual information have also been used. 18 In addition, sometimes the correlation values need to be transformed. For instance, in the WGCNA package, the PCC values are first transformed by taking their fourth or sixth power and then a generalized topological overlap measure (TOM) is computed based on the power of the PCC values. 19 Another issue is how to identify densely connected components from the WGCN. In network analysis, the dense subnetwork modules include many different types such as cliques (fully connected), quasi-cliques (densely connected), and k-core (each node has at least k edges). Many algorithms have been developed for mining such network modules.6,20,21 In the well-known WGCNA package, hierarchical clustering is used to identify the densely connected subnetworks.17,19,22 While it is an effective method, hierarchical clustering prevents overlaps between subnetworks even though a gene may participate in different functions and thus appear in multiple subnetworks. To address this, we have previously developed the edge-covering quasi-clique merger (eQCM) algorithm for directly mining weighted networks 6 based on a greedy algorithm called QCM. 21 Both algorithms were proven mathematically to be able to generate high-density subnetworks.6,21
With the development of these algorithms, many cancer datasets have been examined and important gene network modules have been identified. Genes in these network modules often share common functions and many of them are coregulated by the same transcription factors. An important discovery is that different cancers share common modules of coexpressed genes. 7 These common modules are usually enriched with functions related to the “hallmarks of cancers” such as cell cycle control, genome stability, immune and inflammatory responses, and extracellular matrix and stroma organization. Our previous study has shown that these common modules are not prevalent in normal tissues, suggesting that they play important and unique functions in cancer development. 7
Despite these advances, GCNs contain rich information waiting to be discovered. For instance, recently we found that there are GCN modules in colon cancer associated with metastasis that are not enriched with common functions. 16 Instead, the genes in these modules concentrate on certain regions of the chromosomes (eg, a specific chromosome band), suggesting that these regions are potential “hotspots” for cancer metastasis and that the transcription levels of these genes are correlated with the copy number variations (CNVs) of these regions. This provides a means of identifying functional CNVs from functional genomics (ie, gene expression) data instead of structural genomics data. However, since the correlation of gene expression profiles due to these activities are usually not very strong, they tend to be ignored by traditional GCN or WCGN analysis, as the global weight threshold or transformation (eg, fourth power) will suppress these signals.
In this paper, we present a weight normalization process followed by a revision of the original eQCM algorithm called lmQCM (standing for
Methods
Local Maximal Quasi-Clique Merger
Given an undirected weighted network

Our goal is to find network modules that are subgraphs of G with high densities. In Ref. 21 , the original QCM algorithm exploits a greedy approach starting with the edge of highest weights and then adding nodes that contribute most to the network module density one by one. This process is terminated when the module density falls below an adaptive threshold, which is a function of the size of the module. It can be shown that the density of the network modules identified through this process has a lower bound and thus the algorithm is superior to typical heuristic algorithms, which cannot guarantee the density of the outcome modules. Since the identified dense modules often have overlaps, a merging process is then applied to merge highly overlapped modules. While, in theory, the merging process may significantly reduce the density of the merged network, our empirical results on WGCN mining suggest that it will not affect the consistency of the enriched functions of the network modules while keeping a much smaller set of modules allowing deep analysis. In our recent work, a revision of the original QCM algorithm called eQCM was presented with improvement in the initiation criterion for each module that enables users to detect a more comprehensive set of dense modules. 6 This algorithm has been shown to be able to effectively identify GCNs as potential cancer prognostic markers. However, an issue with the eQCM is that it usually leads to a large number of network modules with big overlaps. Thus the merging process can take a very long time.
In this paper, we further improve eQCM with the goal of identifying dense modules that are reasonably separated. Our improvement is based on an intuitive assumption: If a network module is dense and relatively separated from other dense modules, it is reasonable to assume that it contains at least one edge that is a “locally maximal”; ie, the weight of an edge connecting two nodes i and j is the maximal one among all the edges connecting these two nodes. This is a reasonable assumption, as such edges should be preferred by dense modules during the greedy search process. In addition, this requirement can be used to avoid the possibility that the module is only a peripheral component of another denser module and thus the modules can be reasonably separated. Mathematically, given the adjacency matrix W of the network, this assumption implies that wij must be the maximal element in both the ith column and jth row. In addition, since wij = wji, this value is also the largest in the ith row and jth column. Therefore, the possible number of modules to be detected is limited to N/2, which greatly improves the efficiency of the search process.
Just like that of the QCM and eQCM algorithms, execution of our new algorithm is based on input for four parameters: γ, Λ, t, and β. Among them, γ controls the threshold for the initiation of each new module, Λ and t define the adaptive threshold of the module density to ensure proper stopping criterion for the greedy search for each module, and β is the threshold for overlapping ratio for merging (ie, two modules U and V will be merged if
Algorithm 1: lmQCM (local maximal Quasi-Clique Merger, a revised version of eQCM. Input G = {V,E, W}, γ, Λ, t, and β, Output: C)
Let Elm be the set of local maximal edges as described above which are sorted in descending order based on their weights
for i = 1:μ [eμ is the last edge in the above sorted list Elm with
if ei is an edge in any network module in C
continue;
endif
C = V(ei);U = V \ V (ei) :
while max
C = C ∪ {v}; U = U\ [v};
endwhile
C = C ∪ {C}
endfor
Merging highly overlapped modules in C with respect to β;
Output C.
Here contribute(v,C) is defined as the ratio of the edge weight increase of G(C) on adding the vertex v, over the size of C. Note that the Line 3 of the algorithm determines whether a new module is to be initiated. This process loops through all the “local maximal” edges that are in O(|V|) and is significantly faster than eQCM that searches through O(|V|2) edges. In addition, this reduction leads to significantly fewer overlapped modules that need to be merged as described in Line 13, which is the major time-saving step.
Weight Normalization for Weighted Networks
Currently, in most dense module mining algorithms, the threshold on the density is a global one. If the threshold is set too high, only highly dense modules can be detected and many locally dense modules will be missed. If the threshold is set too low, either too many modules will be identified or only a few very large modules will dominate the output. To overcome this issue, many approaches have been developed. For unweighted networks, recently an adaptive graph sparsification scheme was proposed to adaptively remove edges based on the degree of the nodes. 23 However, this approach does not guarantee the connectivity of the graph. For weighted networks, the WGCNA package uses the TOM measure instead of the original transformed PCC values to balance the weights. However, since the high power for the PCC values effectively boosts the edges with high PCC values and suppresses the ones with low PCC values, the adoption of TOM still cannot help in recovering the locally dense modules.
The issue with the unbalanced edge weight is not unique to mining GCNs. A similar issue also plagues the data clustering problem in machine learning. In spectral clustering algorithms, the distance matrix is first converted into the adjacency matrix, and then the adjacency matrix is normalized.
24
Specifically, let W be the n x n symmetric adjacency matrix with wii = 0 (i = 1,2,…,n); define a diagonal matrix D = [dij] (i,j, = 1,2,…,n) such that

Then the normalized adjacency matrix is

This process ensures that the norm of each row and column is 1. Since the weight matrix can be considered an adjacency matrix, this normalization process effectively suppresses the high weights while boosting the low weight edges.
Gene Expression Data
Two large gene expression datasets were obtained from the NCBI Gene Expression Omnibus (GEO). The first dataset is GSE18842, a lung cancer dataset with 45 pairs of matched non-small-cell lung cancer (NSCLC) tumor and nontumor tissue samples. The second dataset is GSE20711, a breast cancer dataset with 90 patients. These datasets enable us to compare the GCNs generated using the lmQCM and normalized lmQCM algorithms under different conditions. Both datasets were generated using the Affymetrix HU133 2.0 Plus Genechip with more than 54,000 probesets. The normalization of the datasets was confirmed by checking the boxplots for the samples in each dataset.
Since the weight matrix requires a relatively large memory of the computer, preprocessing of each dataset was carried out to select highly expressed genes. First, only probesets for known RefSeq genes were selected based on the annotation file (GPL570 from GEO). If multiple probesets correspond to one gene, only the probeset with the highest mean expression value was retained for further analysis. Next, the genes with low mean expression values (bottom 20%) and low variance (bottom 10%) were removed using functions from the MAT-LAB Bioinformatics Toolbox.
Analysis of WCGN
In our analysis, we computed the PCC between every pair of genes and took the absolute values of the PCCs to form the weight matrix W (the diagonal of W is set as 0) and then generate the normalized weight matrix
The biological relevance of the network modules is obtained by carrying out enrichment analysis using the online tool TOPPGene (https://toppgene.cchmc.org/enrichment.jsp). TOPPGene not only conducts the gene ontology (GO) enrichment analysis but also carries out enrichment analysis for other possible items such as pathways, human and mouse phenotypes, chromosome bands, transcription factor binding sites, and public gene lists from the literature. Given the large number of modules, we focused on the results from the tumor samples of the lung cancer study (GSE18842) in the enrichment analysis and the validation analysis below.
Cross Validation Using Pan-Cancer Studies and TCGA Lung Adenocarcinoma Dataset
Since our results were obtained using public lung adenocarcinoma and breast cancer datasets from microarray experiments, we tested whether a similar clustering can be observed in other cancer studies. However, the comparison of networks is a complicated process and beyond the scope of this work. Instead, we focused on cross-validating a key observation using multiple datasets. Specifically, a major finding using our approach is that many of the gene modules detected are enriched on specific chromosomal bands. This observation suggests that the variation of gene expression levels for these genes in these modules may be largely due to the CNVs in cancer cells. Therefore, we first compared the identified chromosomal bands with a recent pan-cancer study with a list of commonly observed CNV regions in multiple types of cancers.
Secondly, we chose specific gene modules and tested them using the TCGA LUDA datasets. Since the LUDA gene expression data were generated using the RNA-seq technology, this test not only determined whether the CNV-associated gene expression changes could be repeatedly observed on the TCGA dataset but also provided insight into whether the coexpression analysis on microarray could be carried out similarly on RNA-seq data even though full-fledged comparison was beyond the scope of this paper.
Comparison with WGCNA Package
One of the most commonly used gene coexpression network analysis tools is the WGCNA package, as described in Refs 17 19 . As we discussed earlier, WGCNA is based on hierarchical clustering and thus the gene modules are exclusive. The publicly available WGCNA tool is implemented in R. We tested the lung tumor sample data using the default settings with the WGCNA package in R.
Results
Weight Normalization and the Choice of γ
While the final outcome of the lmQCM algorithm is affected by four parameters of the lmQCM algorithm, the parameter γ has the largest impact on the outcome. We first examined the effects of different choices of γ on the number output modules. As shown in Figure 1, the number of output modules (with at least five genes) is clearly affected by γ when using the normalized weights, while it remains relatively stable over a large range of γ values for the unnormalized lmQCM. Here we point out that the insensitivity to γ is not a preferred property, as it implies the potential issue of not being able to detect smaller but functionally important modules, as will be shown later. In all cases, the “knee point” of γ for normalized weights is ∼0.3–0.4 (the number of modules attains a stable number when γ is reduced below this number), while the “knee point” is reached at ∼0.6 for tumor samples in lung cancer and the breast cancer samples with unnormalized weights. The number of modules is relatively stable for control samples in the lung cancer study with unnormalized weights. Given the observations, for the following analysis we choose γ = 0.4 for lung cancer samples and γ = 0.3 for breast cancer samples with normalized weights and 0.6 and 0.8 for samples with unnormalized weights for comparison purposes.

Comparison of the number of output modules between normalized and unnormalized weights with respect to different choices of the parameter γ, which all show similar trends.
Weight Normalization Leads to Modules with Balanced Sizes and Functional/structural Enrichment
Figure 2 shows the sizes of the detected modules under different conditions, while Table 1 summarizes the size of the largest modules for different values of γ. It can be seen from Figure 2 that the variation of the module sizes is much smaller when normalized weights are used even for smaller γ in the lung cancer tumor samples. In contrast, for unnormalized weights, the output tends to be dominated by a few large modules. The same results are also observed in the breast cancer samples (data not shown). One of the implications of the highly unbalanced module size is that the dominating modules usually contain gene groups with different functions.
Number of modules and size of the largest modules for different choice of weight normalization and values of γ


Comparison of the module sizes between normalized and unnormalized weights.
To illustrate this, we have summarized the highly enriched biological process (BP) terms in GO for network modules of size 15 or larger for three settings for the lung tumor samples in Table 2 (the enriched GO BP terms and chromosomal bands for all such networks are shown Supplementary Tables S1—S3). When an unnormalized weight matrix was used, high γ value (0.8) ensured the discovery of network modules consisting of highly correlated genes and the functional enrichment analysis showed the modules were highly enriched with major cancer-related biological processes such as mitotic cell cycle, immune responses, and extracellular matrix organization. These biological processes are highly consistent with previous findings as well as the hallmarks of cancers. 7 However, when the γ value was decreased to 0.6, many of the modules merged into a large module with 1,904 genes. While the above-mentioned key biological processes can still be detected using enrichment analysis, they are all concentrated in the same module. This is not preferred, as the potential common regulatory mechanisms cannot be effectively inferred from so many genes. Instead, it is more desirable to have smaller modules for which in-depth analysis can be carried out. As shown in Figure 2, the lmQCM with normalized weights can potentially achieve this goal. This can be observed in the results shown in Table 2. For normalized weights with γ value selected according to Figure 2 (0.4), the major biological processes are all identified. In addition, some modules are divided into finer modules (eg, four modules are enriched with extracellular matrix organization instead of only one), allowing potentially more focused analysis on regulatory mechanisms.
Significantly enriched GO BP for modules with at least 15 genes for lung tumor samples using three settings (P < 10−5).

Weight Normalization Leads to Subtle Modules with Structural Genome Variance Information
Besides the fact that the normalized weighting scheme can lead to more balanced and finer clustering of genes, they also lead to the discovery of more modules that are significantly enriched with genes locating the proximal chromatin regions. Table 3 summarizes the modules with at least 15 genes that are enriched with specific chromatin regions for the same settings as in the previous section. For unnormalized weights with γ = 0.8, gene modules significantly enriched with chromosome bands such as 8q24, 3q26–28, 15q14–26, and 22q11–23 are detected. This suggests that the coexpression of genes on these chromosomal regions could be due to CNV. While this cannot be confirmed without genotype data for this specific lung cancer patient cohort, genetic variations of these four regions have been previously shown to be related to multiple cancers.16,25–29 However, traditional studies on CNV cannot confirm whether the genes with amplification indeed have changes in their gene expression levels, but our coexpression analysis suggests a method for identifying functional CNVs. Therefore it is of great interest to further explore coexpression modules associated with specific genomic regions. Since genes in these modules are usually not as strongly coexpressed as the ones sharing common functions, we need to decrease the γ value to detect such regions. Table 3 shows the output when γ is reduced from 0.8 to 0.6. As expected, many more such regions have been detected, including 8q24, 19q13, 6p21, 17p13, 5p13, 6q25, 12p13, 16p13, 1q21–23, 9q34, 5q31, and 7q11. However, these discoveries are at the cost of losing functionally enriched modules. In fact, the important cancer-related modules highlighted in Table 2 have been merged into a large module with 1,904 genes (module 1 in Table 2). Clearly, there is a need for a balanced approach. Fortunately, the normalized weights allow the algorithm to reach a balance of detecting both functionally and structurally enriched modules. As shown in the last (third) column of Table 3, a much larger number of modules with enriched chromosomal bands are identified including all the ones detected in the first setting (unnormalized lmQCM with γ = 0.8 highlighted in yellow) and a large portion of the ones identified in the second setting (unnormalized lmQCM with γ = 0.6 highlighted in cyan). These discoveries are obtained without losing balanced, functionally enriched modules, as shown in the last column of Table 2. Similar observations are made for the breast cancer data, as shown in Supplementary Table S4.
Significantly enriched chromosomal bands for modules with at least 15 genes for lung tumor samples using three settings (P ≤ 10−5).

Comparing the Identified Chromosomal Regions with Pan-cancer Studies
The lmQCM algorithm combined with the weight normalization approach led to the discovery of many coexpressed gene modules that are enriched in specific chromosomal bands or regions. This suggests that the variation of gene expression levels for these genes in these modules may be largely due to the CNVs in different cancer patients. Recently, with the availability of a large number of cancer genomics datasets, pan-cancer studies have been carried out to identify common genetic variants among multiple types of cancers. Here we compare our results from normalized lmQCM (γ = 0.4) with the significant copy number alteration (CNA) regions detected in multiple cancers in a recent pan-cancer study 30 (from Supplementary Table S2 in Ref. 30 ). In the last (third) column of Table 3, we use boldface font to highlight the regions that have overlaps with the regions listed in Ref. 30 and italic font to highlight the regions that are close to those in Ref. 30 . Interestingly, out of the 36 regions we detected, 32 have overlaps with pan-cancer CNA regions, while the remaining four are close to some of the CNA regions reported in Ref. 30 . For the breast tumor samples, as shown in Supplementary Table S4, all regions but one are reported in Ref. 30 , and the only one that was not reported is in close proximity of a reported region. These results strongly support our conjecture that these chromosomal regions are associated with cancers and demonstrate the capability of the normalized lmQCM algorithm in discovering such regions from functional genomic data.
Cross-validation of Selected Gene Modules Using TCGA LUDA Dataset
For the detected gene modules with enriched chromosomal regions, we wanted to know whether 1) some of the lung cancer patients indeed had CNV in these regions; 2) the gene expression level was correlated with the CNV; and 3) the genes on the detected chromosomal bands or regions coexpressed. To answer these questions, we needed a dataset with both gene expression and CNV data. The TCGA LUDA project fitted this requirement very well, as it contained gene expression profiles (using RNA-seq technology) and CNV data for 230 patients. 31 Here we randomly selected two modules for our test.
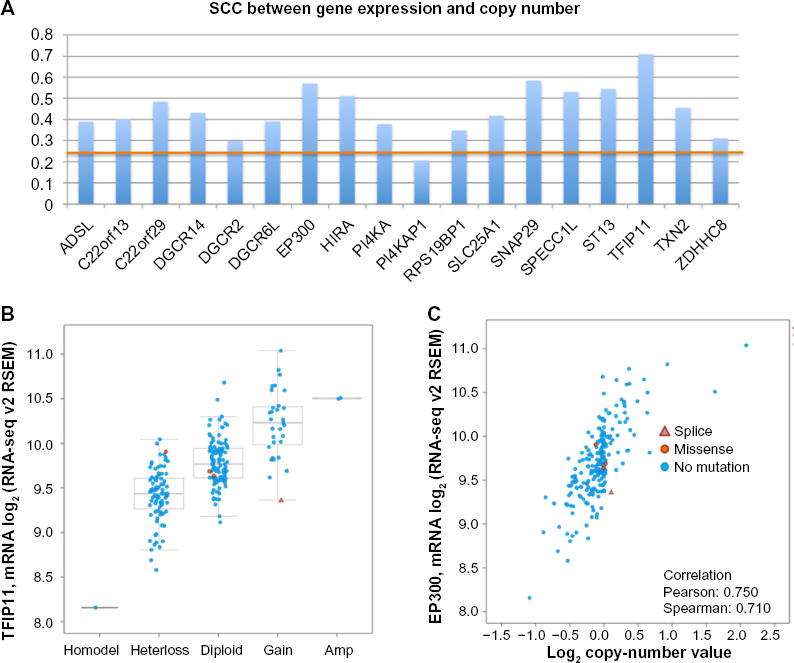
The first module contains 29 genes, with 21 of them located on chromosomal bands chr17p11-p13. To confirm the coexpression of the genes in this module, we downloaded the gene expression data (RNA-seq RMES) for these 29 genes from the cBioPortal (http://www.cbioportal.org/). Out of the 29 genes, expression levels of the two of genes were missing. Since the data were obtained using RNA-seq technology and the normal distribution requirement could be applied, we calculated the pairwise Spearman-rank correlation coefficients (SCCs) instead of PCCs. We applied Bonferroni corrections to identify significantly correlated gene pairs so that only gene pairs with the two-tailed P-values for SCC less than

Left: The OncoPrint visualization of the LUAD patients with genetic mutations including CNV for the 29 genes in the selected module. Two of the genes do not have data available (marked with red line striking through). The genes that are not on chr17p are marked with red boxes.
To check whether the lung cancer patients had CNV in the selected genes, we used the OncoPrint visualization provided by cBioPortal. As shown in Figure 3 (left), it is clear that the genes on the enriched chr17p bands have similar CNV patterns, while the genes on the other chromosomes do not share the same CNV pattern across the patient cohort.
To verify the relationship between CNV and the gene expression (mRNA levels), we calculated the SCC values between the CNVs and the mRNA levels for the 29 genes. Among the 27 genes with values available, except for the gene TBC1D1, the remaining 26 genes all showed significant positive correlations (SCC ranges between 0.2645 and 0.7081 with P-values ranges between 0.0000486 and 2.6099 × 10−36). These observations suggest that our hypothesis that the coexpression among the genes in this module is strongly associated with the CNV is highly likely
We also carried out the same tests on a second module containing 21 genes with 18 of them located on chromosomal bands chr22qll,12, and 13. The coexpression among the genes was verified by comparing the pairwise P-values for the SCC with the Bonferroni-corrected threshold
(
Comparison with WGCNA-like method. As we discussed previously, the WGCNA method is one of the most commonly used gene coexpression analysis tools. We tested the lung tumor data using the default parameter settings of the R package. We obtained 25 clusters ranging from 38 to 1,661 genes. Among them, 10 clusters showed significantly enriched on nine chromosomal bands including chr8q11–24, chr19q12–13 (two clusters), chr6p12–25, chrXp22, chr17p11–18, chr5p12–15, chr15q14–25, chr12p11–13, and chr7q11–21. Out of the nine regions, eight (except for chr19q12–13) had overlaps with enriched regions in Table 3 from the normalized ImQCM algorithm, even though the latter suggested a much large number such regions.
Discussion and Conclusion
In this paper, we presented a new approach for mining a weighted network to identify densely connected modules such as quasi-cliques. This approach made two major improvements upon previous work. The first was to use local maximum edges to initialize the search in order to avoid excessive overlaps among the modules, thereby further greatly reducing the computing time. The second was to include a weight normalization procedure to enable the discovery of “subtle” modules with more balanced sizes. Biologically, this approach allowed us to identify a large number of gene modules with enriched chromosomal bands, suggesting potential roles of CNVs involved in the cancer development. While gene coexpression network analyses have been widely adopted in disease studies, most of them focused on the functional relationships of coexpressed genes.7,13,32–36 The relationship between coexpressed gene modules and CNVs are much less investigated depite the potential advantage of inferring such relationships without the need for genotype data. While we did not confirm the CNVs experimentally, our tests on the TCGA data strongly support the hypothesis that the coexpression of genes in these modules is associated with CNVs. Our results on the breast cancer dataset are consistent with the observations from lung cancer, suggesting the universality of such phenomena in cancer. However, it is important to point out that the detected CNVs, though being functional, may not be markers for different clinical outcomes.
Despite the advantages of our approach shown in this paper, the choice of normalized weights versus unnormalized ones still requires careful analysis of the requirement of the final goal. If strongly correlated gene modules are desired, unnormalized weights with a high γ value may still be desired. Or a combination of both normalized and unnormalized output may be needed, as they can complement each other to identify highly correlated or locally correlated modules.
Since the normalization of weights is inspired by spectral clustering in machine learning, it can be conceived that other types of transformation of weights, such as kernel methods, may be also useful. This can be explored further, as it can potentially combine the advantages of both machine learning and data mining. Such approaches will not only be useful for biomedicine but also can be applied to general problems in network mining.
Author Contributions
Conceived and designed the experiments: KH. Analyzed the data: JZ. Wrote the first draft of the manuscript: JZ, KH. Agree with manuscript results and conclusions: JZ, KH. Jointly developed the structure and arguments for the paper: JZ, KH. Made critical revisions and approved final version: JZ, KH. Both authors reviewed and approved of the final manuscript.