
Abstract
The effects of copy number alterations make up a significant part of the tumor genome profile, but pathway analyses of these alterations are still not well established. We proposed a novel method to analyze multiple copy numbers of genes within a pathway, termed Test for the Effect of a Gene Set with Copy Number data (TEGS-CN). TEGS-CN was adapted from TEGS, a method that we previously developed for gene expression data using a variance component score test. With additional development, we extend the method to analyze DNA copy number data, accounting for different sizes and thus various numbers of copy number probes in genes. The test statistic follows a mixture of X 2 distributions that can be obtained using permutation with scaled X 2 approximation. We conducted simulation studies to evaluate the size and the power of TEGS-CN and to compare its performance with TEGS. We analyzed a genome-wide copy number data from 264 patients of non-small-cell lung cancer. With the Molecular Signatures Database (MSigDB) pathway database, the genome-wide copy number data can be classified into 1814 biological pathways or gene sets. We investigated associations of the copy number profile of the 1814 gene sets with pack-years of cigarette smoking. Our analysis revealed five pathways with significant P values after Bonferroni adjustment (<2.8 x 10⁻⁵), including the PTEN pathway (7.8 x 10⁻⁷), the gene set up-regulated under heat shock (3.6 x 10⁻⁶), the gene sets involved in the immune profile for rejection of kidney transplantation (9.2 x 10⁻⁶) and for transcriptional control of leukocytes (2.2 x 10⁻⁵), and the ganglioside biosynthesis pathway (2.7 x 10⁻⁵). In conclusion, we present a new method for pathway analyses of copy number data, and causal mechanisms of the five pathways require further study.
Introduction
In the United States, lung cancers, 85% of which are non-small-cell lung carcinomas, are the second most common type of cancer and the leading cause of cancer-related death. 1 A well-documented and heavily studied risk factor for lung cancers is cigarette smoking. 2 Tobacco usage has been shown to mirror mortality rates caused by lung cancer. 3 Although there has been observation of carcinogens from cigarette smoking causing damage to the lungs via direct DNA interference, the exact mechanism through which smoking causes genomic damage is not completely understood. 4
Copy number alteration is one of the leading causes of the variation in genomic DNA between humans. 5 Similar to single-nucleotide polymorphisms (SNPs), the alterations result in repeated or deleted sequences, although, unlike SNPs these repetitions or deletions can code for entire genes instead of individual bases. There is existing evidence to suggest that copy number alterations have a significant effect on the body's ability to regulate and combat tumor gene expression. 6 We have reported the effects of smoking on copy number alterations, 7 but have focused on probing copy numbers by the genomic location rather than by its biological function as a gene or a pathway. This study aims to incorporate more biological relevance to our study of copy number alterations by using pathway analysis. Pathway analysis has largely been used as a means of testing for expression data, but the use of the technique to study copy number variations is novel and is the main motivation behind this study.
The objective of this study was to use variance component tests on a gene set to analyze the methods through which smoking may cause tumorigenesis. Pack-years was chosen as the means of quantifying smoking habits, as it was a reliable measure of the total dose in the patient that accounted for both frequency and total time. The information is then analyzed using a proprietary statistical model called the Test for the Effect of a Gene Set with Copy Number data (TEGS-CN), which was adapted from our previous method, TEGS, a testing procedure for a multivariate linear regression model using permutation and scaled X 2 approximations. 8
Methods
Lung Cancer Dataset
As reported in our previous study, 7 264 snap-frozen tumor samples from non-small-cell lung cancer patients were collected from Massachusetts General Hospital, Boston, MA, and the National Institute of Occupational Health, Oslo, Norway. Detailed information regarding cigarette smoking and other demographic information was collected by trained research assistants following a modified version of the American Thoracic Society's standard respiratory questionnaire. Written consent was obtained from all patients and the study was approved by the institutional review boards from Massachusetts General Hospital, the Harvard School of Public Health, the Norwegian Data Inspectorate, and the Local Regional Committee for Medical Ethics. From these 264 subjects, genome-wide DNA copy numbers were measured using Affymetrix 250 K Nsp SNP array. From the array, copy numbers from a total of 262,264 probes were recorded. The raw copy numbers were preprocessed and normalized using dCHIP algorithm 9 with a reference panel consisting of blood DNA or DNA from adjacent normal tissues collected from lung cancer patients. The preprocessed copy numbers were then standardized for the analysis of TEGS-CN.
Molecular Signature Pathway/Gene Set Database
Pathways were compared with the existing data curated by the Broad Institute Gene Set Enrichment Analysis Molecular Signatures Database (MSigDB) for matching and gene identification purposes. 10 We required a cutoff of at least 15 valid probes per gene pathway from our dataset in order to consider a given pathway in our analysis. This cutoff served as a means of avoiding excessively short pathways that would potentially bias our results. In total, of the 1892 pathways in our dataset, a total of 1814 underwent analysis and 78 failed to reach the cutoff threshold.
Test for the Effect of a Gene set with Copy Number Data
Model. Suppose that there are n subjects (n = 264 in the lung cancer dataset) and subject i has P DNA copy numbers of J genes, Yi1, Yi2, …, YiJ, where each gene j has pj copy number probes,

where i=1,…,n, j=1,…,J; and k=1,…,pj; the errors

Where

Multi-locus Copy Number Analysis: a Variance Component Score Test
Testing procedure for pj copy numbers in gene j We have developed an algorithm termed TEGS for pathway analyses of multiple gene expressions from mRNA expression array data. 8 In the following, we show how to adapt the TEGS to analyze copy number data. For testing the effect of cigarette smoking on copy numbers of a gene, the null hypothesis of interest is that cigarette smoking x has no association with the pj copy numbers of gene j in a pathway, or equivalently,

It has been shown that the traditional multivariate tests such as likelihood ratio tests have limited power because the number of copy numbers (ie, pj) in a pathway is large and copy numbers nearby share high correlation. To overcome this problem, we resort to an empirical Bayes approach by assuming the regression coefficients for the gene j, β j follow an arbitrary common distribution with mean 0 and variance τ j . The resulting model (2) hence becomes a linear mixed model. 11 The null hypothesis H0 : β j = 0 is thus equivalent to the null hypothesis for the variance component,

To test for the null (3), one can develop a score test for the variance components. 12 Specifically, it can be shown that the score for variance component τj has the expression:

where

As the number of copy numbers in a gene, pj can be large, the true covariance matrix for ∊ij, Σj may not be easily estimated. We have shown in Huang and Lin
8
that one can replace the true covariance matrix by a working covariance

where αj can be estimated from the null model:
For implementation, we regressed DNA copy numbers and pack-years of cigarette smoking on the covariates, including age and gender, and the residuals of the regression models then became the input of our test statistic as the adjusted DNA copy numbers
Testing procedure for P copy numbers from all J genes in a pathway
We have shown above that the TEGS can be adapted to perform joint analyses of multiple copy numbers in a gene j. But it requires additional development prior to analyzing all P copy numbers from J genes in a pathway. Model (1) can be written in matrix notation by stacking data of u subjects and total P copy numbers from J genes as:

where

We may follow the same development for the gene j by assuming that all elements in β follow the same arbitrary distribution with mean 0 and variance τ:

This is a valid test, but has the disadvantage that the gene with more copy numbers is more likely to dominate the test. Therefore, we have to adjust for the fact that genes have various number of copy number probes and make the signals from genes with different sizes comparable. To achieve this, we modify the above null hypothesis as:

One can choose different weighting schemes to up-weight the gene with less copy numbers and down-weight the gene with more copy numbers. For example, wj can be the inverse of the number of copy number probes within gene j; or with equal weighting, the null reduces to the hypothesis (5). We propose to weight by the variability of Qj, with wj being the inverse of the variance for Qj.

As discussed above, the estimation for the covariance for Pj copy numbers may not be stable. We approximated Σ nj by only taking the diagonal component of the sample covariance matrix or adding the fifth percentile of the variances to the diagonal elements to stabilize the covariance matrix. The resulting test statistic follows a similar expression as (4):

where
Examples of working covariance Vn include (1) working independence, which assumes that the genes are independent in a gene set and (2) unstructured sample covariance. The unstructured sample covariance is estimated using the residuals obtained by performing separate simple linear regression of individual copy numbers on smoking pack-years in (1). When the total number of copy number probes in a gene set, P, is large and the sample size, n, is small, the standard empirical unstructured sample covariance estimator is unstable. We hence stabilize it using a ridge estimator by adding the fifth percentiles of sample variances to the diagonal of the empirical covariance estimator. Other working covariance structures have been compared and discussed in TEGS. 8
Simulation Studies
To mimic the real copy number data, we based our simulation on the copy number data of the 264 lung cancer tumors. We simulated the data from a gene set, type 3 secretin system, which contained 22 genes and 58 copy number probes. We then randomly selected a proportion π of the 58 copy numbers to be causal copy numbers

where
We conducted three sets of simulation studies to evaluate the performance of TEGS-CN. In the first set of simulation, we fixed the proportion of causal copy numbers, π to be 0.2 and varied the magnitude of the CN-smoking association β from 0 to 5 (Fig. 1A). For each parameter configuration, we simulated 1,000 datasets, and estimated the size and the power of TEGS-CN as the proportion of 1000 P < 0.05. We studied tests using both the working independence and the sample correlation, and P values were calculated using permutation and scaled χ 2 approximation. In the second set of simulation, we fixed the magnitude of non-zero β's to be 1 and varied the proportion of causal ones among the 58 copy numbers, π from 0 to 1 (Fig. 1B).
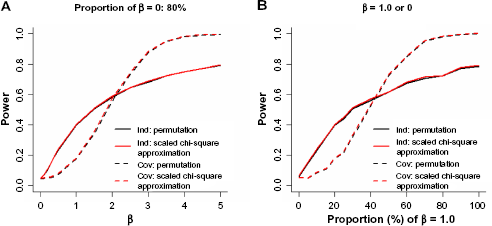
Power curves of TEGS-CN varying the magnitude of associations β (A) and the proportion of non-zero associations (B).
In the third set of simulation, we fixed the proportion of causal copy numbers, π, to be 0.2, similar to the first set of simulation. However, instead of randomly assigning the causal copy numbers, we assign them to smaller genes (Fig. 2). As a result, the proportion of causal genes was 0.36 (8 genes) among the 22 genes, although the proportion of causal copy numbers was 0.2 among the 58 probes. In this setting, we compared the size and the power of TEGS and TEGS-CN, both with working independence, to illustrate the importance of weighting in TEGS-CN.
Results
Simulation Studies
The size of TEGS-CN was well protected at P < 0.05 under both working independence and unstructured sample correlation: 0.047 (0.049 using scaled χ 2 approximation) for working independence and 0.043 (0.049) for sample correlation. The power increased with the magnitude of CN-smoking association (Fig. 1A) as well as the proportion of non-zero CN-smoking association (Fig. 1B). The statistical powers from permutation and scaled χ 2 approximation were very similar. TEGS-CN with working independence performed better when the signals were weak or sparse, whereas TEGS-CN with working sample correlation performed better when the signals were strong or dense. We noted that the difference between the two working correlation structures is that TEGS-CN with sample correlation is able to borrow information from the neighbor copy number probes. When the CN-smoking association is weak or sparse, the additional information from neighbor copy numbers may introduce unnecessary noises rather than significant signals. For the genome-wide scan, we chose to use working independence since the overall signals across the genome may not be strong. However, one can use sample correlation for candidate gene sets if strong or dense signals for certain gene sets are plausible assumptions.
To illustrate the importance of weighting in TEGS-CN and its novelty over the original TEGS, we compared their performance when the association signals are sparse but enriched in eight smaller genes out of the total 22 genes within a gene set. In Figure 2, the numerical simulation revealed that TEGS-CN were consistently more powerful than TEGS. Through weighting in (7), we were able to account for the number of copy number probes within a gene and to make the effects contributed from genes with different sizes comparable. In contrast, TEGS treated each copy number probes equally, which implicitly up-weighted the larger genes and down-weighted the smaller genes. Despite the different performance under the alternative, it is noteworthy that both TEGS-CN and TEGS had well-protected type I error under the null, 0.053 (0.053 using scaled χ 2 approximation) for TEGS-CN, and 0.058 (0.058 using approximation) for TEGS. As mentioned in the Methods section, both are valid tests without inflation of type I error under the null; however, TEGS is likely to be subject to bias due to various sizes of the genes within a gene set.

Power curves of TEGS-CN and TEGS, with CN-smoking associations occurring in small genes.
Analysis of Cigarette Smoking and Copy Numbers in Non-small Cell Lung Cancer (NSCLC) Tumor Genome
As discussed in the Methods section, we applied our proposed algorithm to analyze the genome-wide copy number data of non-small-cell lung cancer, studying the association of copy number profile with cigarette smoking. The demographic and clinical characteristics of 264 patients are presented in Table 1. We divided the total participants into 132 heavy smokers and 132 light- or non-smokers by the median value (35.6) of the pack-years of cigarette smoking collected by a modified standard American Thoracic Society questionnaire.
Characteristics of the 264 non-small-cell lung cancer patients.

Heavy smokers are defined as pack-years of cigarette smoking ≫35.6 (the median of the smoking pack-years in 264 subjects), and light- or non-smokers are those with ≤35.6 smoking pack-years.
Different pathways contain different numbers of genes that DNA copy numbers were measured from the array. The distribution of the number of genes in a pathway is shown in Figure 3A. The average number of genes per pathway was 39.7, while the median was 19 (interquartile range (IQR): 10–39.8). The smallest pathway was one gene long, while the largest (STEMCELL_NEURAL_UP) was 1201 genes long. Genes also contain different numbers of copy number probes: the largest number of probes per gene is 600 (CSMD1) and the smallest is 1, with average number being 8.8, median being 3, and IQR being 1–8. We also present the distribution of the number of copy number probes per pathway in Figure 3B.

Distribution of numbers of genes (A) and copy number probes (B) in pathways. Note that the number of genes (A) and copy number probes (B) per pathway was truncated at 500 and 4000, respectively, due to skewness of the distribution, and the entire range was described in the text.
The average number of probes per pathway was 365.5, and the median (IQR) was 146 (60–344.8). The largest pathway (ALZHEIMERS_DISEASE_DN) includes 10,060 copy number probes, whereas the smallest includes one probe. The large number of genes or copy number probes and the modest sample size (n = 264) represented the nature of large P and small n for the analytic problem. Moreover, the various numbers of copy number probes per gene demonstrated the necessity of weighting the signals from different genes with various sizes, as the null hypothesis (6).
We utilized the TEGS-CN algorithm to investigate the association of copy numbers of non-small-cell lung cancer with the pack-years of cigarette smoking. After running the pathways through the TEGS-CN analysis tests, it was found that of the 1814 pathways, 53 pathways had P values less than 1 X 10⁻³, 14 pathways had P values less than 1 X 10⁻⁴, and 5 pathways were under the Bonferroni cutoff at 0.05/1814 = 2.8 X 10⁻⁵. Because of the large number of copy number probes per pathway, we introduced a working independence structure to save computation burden. Table 2 shows the top five pathways, including the PTEN pathway (PTENPATHWAY: P = 7.8 X 10⁻⁷), the gene set up-regulated in heat shock experiment (HEATSHOCK_YOUNG_UP: P = 3.6 X 10⁻⁶), the gene set down-regulated in rejection of kidney transplantation (FLECHNER_PBL_KIDNEY_TRANSPLANT_REJECTED_VS_OK_DN: P = 9.2 X 10⁻⁶), the gene set involved in transcriptional regulation of leukocytes (SCHRAETS_MLL_TARGETS_UP: P = 2.2 X 10⁻⁵), and the ganglioside biosynthesis pathway (GANGLIOSIDE_BIOSYNTHESIS: P = 2.7 x 10⁻⁵).
The five pathways with P value <0.05 after Bonferroni adjustment.

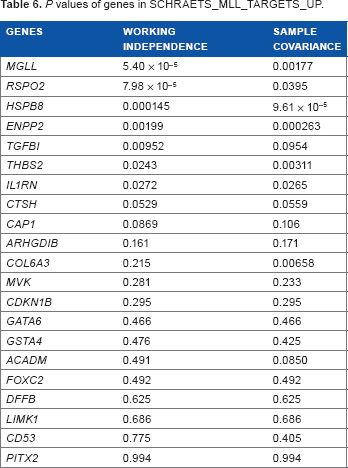
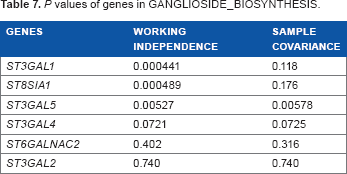
For the top five pathways, we further performed gene analyses where we analyzed multiple copy numbers in a gene to study the association with cigarette smoking (Tables 3–7). Among the 10 genes in PTENPATHWAY, the association of PTK2 copy numbers with cigarette smoking was highly significant; the association of MAPK1, SOS1, and PIK3R1 were marginally significant (P < 0.1). For the gene sets for heat shock up-regulation (HEATSHOCK_YOUNG_UP), DYNLL1 seemed to drive the significance of the gene set. Of the 31 genes involved in kidney transplantation rejection, there were five significant genes with P < 0.05 and three marginally significant genes with P value between 0.05 and 0.1. Of the 21 genes involved in transcriptional regulation of leukocytes (SCHRAETS_MLL_TARGETS_UP), there were seven significant genes with P < 0.05. Finally, there were three highly significant genes out of the six involved in ganglioside biosynthesis.
P values of genes in PTENPATHWAY.

P values of genes in HEATSHOCK_YOUNG_UP.

P values of genes in FLECHNER_PBL_KIDNEY_TRANSPLANT_REJECTED_VS_OK_DN.

P values of genes in SCHRAETS_MLL_TARGETS_UP.
P values of genes in GANGLIOSIDE_BIOSYNTHESIS.
Discussion
Copy number alterations have been reported to correspond to the majority of the variation in gene expression of tumor genome. 6 There is a pressing need to understand copy number alterations in relation to phenotypic trait such as cigarette smoking or clinical outcome in the context of biological pathway or gene set. Thus, in this study, we develop a new method for pathway analyses of copy number data, TEGS-CN. The method is adapted from our previous algorithm TEGS, a testing procedure for gene set or pathway analyses. Although TEGS has been developed for pathway analyses of gene expression data, it may not be readily applicable to copy number analysis due to the various numbers of copy number probes in genes. Without proper adjustment in TEGS, larger genes with more copy number probes may dominate the signal for the gene set and bias the results. Therefore, we extended the algorithm by introducing a general weighting scheme to make the information from genes with different sizes comparable. We showed in simulation that with proper weighting for each copy number probes to make each gene comparable, TEGS-CN outperformed TEGS in terms of the statistical power (Fig. 2). The general weighting is not only limited to adjusting for gene size but can also be used to incorporate other parameters, for example, prior information of a gene in relation to the phenotypic trait of interest. Moreover, the TEGS-CN can also be used to analyze other genomic data such as DNA methylation array.
Our method (TEGS-CN) analyzes the copy number as a continuous measure. If either amplifications or deletions of copy number have a significant relation to the phenotypic trait, our method is able to detect the association. If one would like to analyze the copy number by categorizing into discrete classes (amplified, neutral, and deleted copy numbers), additional development is required to incorporate such a kind of analyses. However, collapsing the continuous copy numbers into categorical classes loses information and therefore decreases the statistical power. On the other hand, TEGS-CN is an omnibus test, which can detect if there is any effect of a gene set (see null hypothesis (6)) but cannot distinguish where the effect is and the directionality of the effect. Once identifying candidate gene sets or genes, one can study the dose-response relationship for each copy number, to further investigate which kind of alterations is related to the phenotype. 7
The top pathways have been shown to be biologically significant in cancer. The PTEN pathway, which gave us the highest P value among all the pathways, is a well-known cancer-related pathway. Typically, PTEN suppresses tumors by inducing apoptosis in abnormal cells, but in many cancers, including non-small-cell lung cancer, it becomes expressed in reduced copy numbers, which leads to excessive cell proliferation. 15 One of the genes expressing high P values is PTK2, which controls cellular adhesion and mobility. Down-regulation of this gene means less metastasis in cancer cells as they no longer move freely. 16
The following three pathways that were discovered were a variety of different immunological pathways. Each relates in some way to different cellular functions of the human body that functions as anti-cancer or responses to toxic exposures and organ transplants. The HEATSHOCK_YOUNG_UP pathway is a pathway that becomes up-regulated in lymphocytes after heat shock in younger individuals when compared with the lymphocyte reaction in older individuals. It is considered to be an indicator of immune response strength and recovery, as its regulation reflects the gradual degradation of the recuperative ability with age. 17 Among the genes in the heat shock pathway, the one with the most significant P value was DYNLL1. This gene codes for a light chain in the protein dynein, and as such influences a wide variety of cellular processes. 18 The FLECHNER_PBL_KIDNEY_TRANSPLANT_REJECTED_VS_OK_DN pathway is a pathway relating to immunosuppression. It has been studied in patient reactions to kidney transplants, principally how the body mounts acute rejection or has no reaction. 19 Two genes had particularly strong results in this pathway. The gene ZNF148 regulates transcription of a variety of genes, one of which is stromelysin, a protein thought to be active in tumor initiation. 20 SYNPO is a gene that controls synaptodin, which relates to actin and cell motility. 21 SCHRAETS_MLL_TARGETS_UP is a pathway that controls transcriptional regulation of human leukocytes. Although the normal function of the pathway is not well understood, it is known that translocations in this pathway will result in acute leukemia. 22 ENPP2 is the autotaxin enzyme, which increases tumor cell motility via the creation of lysophosphatidic acid (LPA). 23
GANGLIOSIDE_BIOSYNTHESIS is a pathway that controls the formation of gangliosides in the human body. Gangliosides serve as differentiating surface markers in cells, controlling cell growth, development, and apoptosis. It is also known that certain cancers result in the expression of modified gangliosides or an overall reduced expression. Two gangliosides created in this pathway that appeared significant in our data were ST8SIA1 and ST3GAL5. ST8SIA1 codes for an enzyme that produces the GD3 ganglioside, a ganglioside known to be involved in cell adhesion and malignant growth. 24 ST3GAL5 codes for an enzyme that produces the GM3 ganglioside, which participates in differentiation, morphology, proliferation, and adhesion. 25
Author contributions
Conceived and designed the experiments: YTH, DCC. Analyzed the data: YTH, TH. Wrote the first draft of the manuscript: YTH, TH. Contributed to the writing of the manuscript: YTH, TH, DCC. Agree with manuscript results and conclusions: YTH, TH, DCC. Jointly developed the structure and arguments for the paper: YTH, TH. Made critical revisions and approved final version: YTH, TH, DCC. All authors reviewed and approved of the final manuscript.