
Abstract
Chromatin immunoprecipitation sequencing (ChIP-seq) is a powerful method for analyzing protein interactions with DNA. It can be applied to identify the binding sites of transcription factors (TFs) and genomic landscape of histone modification marks (HMs). Previous research has largely focused on developing peak-calling procedures to detect the binding sites for TFs. However, these procedures may fail when applied to ChIP-seq data of HMs, which have diffuse signals and multiple local peaks. In addition, it is important to identify genes with differential histone enrichment regions between two experimental conditions, such as different cellular states or different time points. Parametric methods based on Poisson/negative binomial distribution have been proposed to address this differential enrichment problem and most of these methods require biological replications. However, many ChIP-seq data usually have a few or even no replicates. We propose a nonparametric method to identify the genes with differential histone enrichment regions even without replicates. Our method is based on nonparametric hypothesis testing and kernel smoothing in order to capture the spatial differences in histone-enriched profiles. We demonstrate the method using ChIP-seq data on a comparative epigenomic profiling of adipogenesis of murine adipose stromal cells and the Encyclopedia of DNA Elements (ENCODE) ChIP-seq data. Our method identifies many genes with differential H3K27ac histone enrichment profiles at gene promoter regions between proliferating preadipocytes and mature adipocytes in murine 3T3-L1 cells. The test statistics also correlate with the gene expression changes well and are predictive to gene expression changes, indicating that the identified differentially enriched regions are indeed biologically meaningful.
Introduction
Chromatin immunoprecipitation sequencing (ChIP-seq) technology is a powerful tool for analyzing protein interactions with DNA. 1 ChIP-seq combines chromatin immunoprecipitation (ChIP) with massively parallel DNA sequencing to identify the binding sites of DNA-associated proteins. It can be used to map global binding sites of transcription factors (TFs) and genomic landscape of histone modification marks (HMs). This high-throughput technology creates millions of short parallel sequencing reads and provides more accurate mapping information for the binding regions in the whole genome with lower cost2–5 than array-based methods.
Both TF binding and histone modification play important roles in gene regulation, where TFs bind to DNA at a promoter region to promote or block gene transcription. The signal of TFs usually shows one sharp peak at their binding sites. Multiple HMs have been reported to be associated with transcription initialization, open chromatin, and repression of transcription.3,6
Most previous works in analysis of ChIP-seq data have focused on developing peak-calling procedures to find the binding sites for TFs.7–11 Identifying the enriched regions of HMs is difficult since their signals are more spread out. 12 The signals of HMs are diffuse and usually have multiple local peaks, which are hard to identify by directly applying the existing peak-calling algorithms.
Another important question is to identify the genomic regions that show differential enrichment of histone modification between two experimental conditions, such as different cellular states or different time points.3,13 Indeed, different types of differential histone enrichment have been observed, including shift of nucleosome positions, peak height differences and presence/absence of HMs.14,15 Chen et al. 14 further demonstrated that the spatial distributions of histone marks are predictive for promoter locations and promoter usage. Angel et al. 16 showed that during cold, the H3K27me3 levels progressively increase at a tightly localized nucleation region in Arabidopsis, indicating the importance of studying the peak height, not just presence/absence of the peaks.
One common approach to identifying differentially enriched regions by histones is to apply a peak-calling algorithm to identify the enriched regions for each of the two conditions. The regions with peaks in one condition but without peaks in the other condition are then selected. However, selection of enriched regions often depends on the thresholds used in the peak-calling algorithm. Small differences in the calculated P values or the False Discovery Rate (FDR) threshold used by the peak-finding procedures can lead to very different sets of peaks. Furthermore, this simple procedure has limitations in detecting the differential enrichment in terms of different peak heights or different peak locations.
Several parametric methods based on Poisson/negative binomial distribution have been proposed to address this differential enrichment problem in ChIP-seq data such as DiffBind and DBChIP.13,17 Most of these methods require biological replications to estimate the parameters, especially the dispersion parameter in the negative binomial model. 8 However, many ChIP-seq data usually have a few or even no replicates. Taslim et al. 18 proposed a nonlinear method that uses locally weighted regression (Lowess) for ChIP-seq data normalization. Shao et al. 19 developed a method to quantitatively compare ChIP-seq data sets. To circumvent the issue of differences in signal-to-noise ratios between samples, they focused on ChIP-enriched regions and introduced the idea that ChIP-seq common peaks could serve as a reference to build the rescaling model for normalization. The inputs of all the methods mentioned rely on first identifying the enriched regions and then obtaining the total tag or read counts in these regions. Such approaches have two limitations. First, one has to identify the regions using peak-finding algorithms. Second, by summarizing the number of tags into one single number of the region, one can potentially lose important spatial profile differences such as shifts of the signal region or shapes of signals.
In this paper, we propose a nonparametric method to identify the genes with differentially enriched regions based on the ChIP-seq data of histones. Instead of first identifying the enriched regions or peaks as most of the existing methods do, we consider the regions close to genes that may contain important regulatory elements such as the promoter regions, the gene body, and downstream regions of the genes. For each of these regions, we summarize the data as counts of sequencing reads in each of the bins of a given length (eg, 25 bps). The counts in these candidate regions provide important information about different HM enrichment levels between two cellular states. After transforming the count data to approximately normal, we apply kernel smoothing to the differences of the data and develop a nonparametric hypothesis testing procedure based on the kernel smoothing. Applying smoothing to the data helps to eliminate the small local differences that are unlikely to be biologically relevant.
We demonstrate the method using ChIP-seq data on a comparative epigenomic profiling of adipogenesis of murine 3T3-L1 cells. Our method detects genes with differential H3K27ac levels at gene promoter regions between proliferating preadipocytes and mature adipocytes, which agree with what were observed by Mikkelsen et al. 3 The test statistics correlate with the gene expression changes well, indicating that the identified differences are indeed biologically meaningful. Our results also indicate that the combination of different histone modification profiles can predict the fold changes of gene expressions very well.
Motivating Comparative ChIP-Seq Study, Data Transformation, and statistical Model
We consider the ChIP-seq experiments reported by Mikkelsen et al. 3 on murine 3T3-L1 cells undergoing adipogenesis. Specifically, they generated genome-wide chromatin state maps using ChIP-seq profiling, where they mapped six HMs and two TFs at four time points, including proliferating (day ™2) and confluent (day 0) preadipocytes, immature adpipocytes (day 2), and mature adipocytes (day 7). We focus our analysis on H3K27ac mark, which is expected to be enriched at active promoters or enhancers. In order to identify the genes that show differential H3K27ac modification levels between the preadipocytes (day ™2) and mature adipocytes (day 7), we consider the upstream 5000 bp region and downstream 2000 bp region around the transcription start site for each gene and divide the regions into 280 bins of 25 bps. We map the raw data using Bowtie, 20 extend reads to the fragment size and then obtain the genome-wide coverage data with a fixed bin size of 25 bp. Since the two ChIP-seq samples are usually sequenced at different depths (total number of reads), we rescale the counts according to the sequencing depth ratio. Suppose that there are m genes and for each gene i, there are n observed, we have read counts X ikj in bin k under condition j, for i = 1, …, m; k = 1, …, n; and j = 1, 2. Our goal is to identify the genes with differential H3K27ac levels at their promoter regions between mature adipocytes and preadipocytes.
For each gene i and each condition j, we assume the data X
ikj
, k = 1, n are approximately Poisson with means μ
ikj
. We first apply variance-stabilizing transformation (VST) procedure to transform the data to
We further denote


Kernel-Smoothing-Based Nonparametric Tests
For a given gene i, we propose a kernel-smoothing based non-parametric test
23
to test the null hypothesis (2). For notational simplicity, we omit the subscript i in the following. Let K be a proper kernel, which is a symmetric, continuous density function with an expectation of zero. We use a normal kernel function, which satisfies all these regularity conditions and fits the real data well. For a fixed bandwidth value λ ∈ [0, 1], we consider the kernel estimator
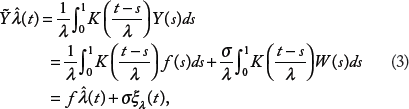
where

Based on the study by Lepski and Spokoiny,
23
we use the integral of the squared kernel estimator Tλ, which is defined as


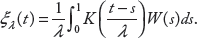
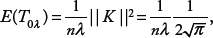
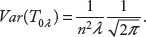
For the Gaussian kernel, the expectation of T0λ is given by

Alternative derivation of the test statistic
In this section, we present an alternative derivation of the test statistic that has better finite sample performance than the statistic (6) when n is not too large (see the Application to a Comparative ChIP-Seq Study During Mouse Adipogenesis section for an illustration). Note that the kernel smoother


The trace of Sλ is the degrees of freedom (df) of the kernel smoother. 24
Based on equations (3), (4), and (7), the statistic Tλ can be approximated by

Since V is an orthogonal matrix, the vector U follows Nn(0, VVT) = Nn(0, In) under the null hypothesis, and therefore U
2
k
are i.i.d random variables following X
2
1
and Tλ follows a mixture of n X
2
distributions with weights

Alternatively, using the Wilson–Hilferty transformation,
26
we have

which follows a N(0, 1) under the null hypothesis. We use this statistic in our analysis.
Estimate σG for each gene
In order to calculate the test statistic specified as equation (4) or (8), we need the variance estimate


Since we consider the ChIP-seq data with very few or no replications, the estimates
Finally, we choose the bandwidth λ in the kernel smoothing to be relatively large to avoid fitting the very small local changes. In our analysis of the real data sets with n = 280 observations, we choose λ = 20/280. The details of bandwidth selection are discussed in the Effects of Bandwidth Selection on Identifying the Differential Enrichment Genes section.
Application to a Comparative ChIP-Seq Study during Mouse Adipogenesis
We present results of our analysis of the comparative ChlP-seq data described in the Motivating Comparative ChIP-seq Study, Data Transformation and Statistical Model section. Our initial analysis focuses on H3K27ac at gene promoter regions, because it is known that H3K27ac is positively associated with gene expression. 3 We divide the genomic region around the transcription starting site (-5000 to 2000 bp) into n = 280 bins, where the length of each bin is 25 bps. The data set includes m = 29,716 genes. Our goal is to identify the genes with differential enrichment of H3K27ac at the promoter regions between proliferating preadipocytes (day ™2) and mature adipocytes (day 7).
Comparison of the Z0^, W H statistics and fold-change statistics
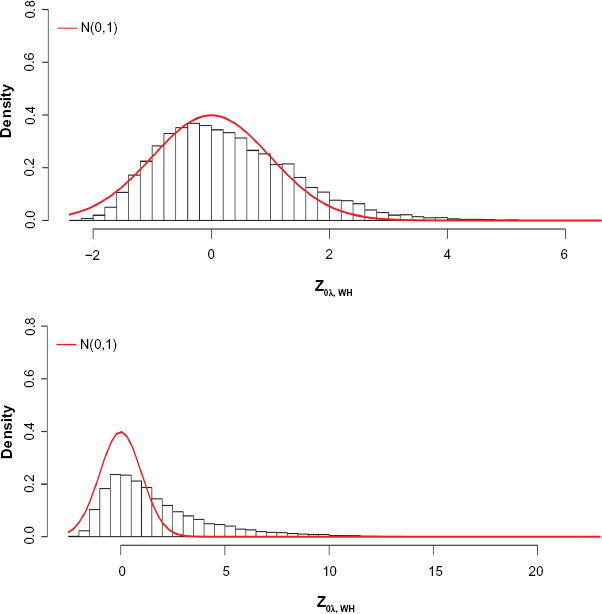
For each gene, after the normal transformation as in the Motivating Comparative ChIP-seq Study, Data Transformation and Statistical Model section, we fit a kernel-smoothing function to the difference data using a bandwidth of λ = 20/280, which over-smooths the very small signals that are likely due to noises. We calculate the test statistic for each of the 29,716 genes. To compare different test statistics Z0λ and Zoλ,WH, we plot the histograms of these two test statistics in Figure 1 for 9,874 genes with the maximum number of read counts in both days fewer than 5. Because of the very small read counts in these genes, these genes are most likely not differentially enriched and therefore the test statistics should follow the standard normal distribution. Clearly, Z0λ, W H follows N(0, 1) closer than Z0λ. We therefore use this statistic in all our analyses.

Histograms of two test statistics for the mouse adipogenesis ChIP-seq data, (
Using the test statistic Z0λ, W H, we observed that about one-third of the genes that show differential enrichment between preadipocytes and mature adipocytes using a Bonferroni-adjusted P-value of 0.05. This is expected since the cells are very different between these two days. Large-scale differential enrichment was also observed by Mikkelsen et al. 3 We observe different patterns of differential enrichment. Figure 2 shows the observed data for 12 genes with the largest test statistics. Clearly, some genes are enriched for H3K27ac in only one condition. For genes that are enriched at both time points, Figure 2 shows that these genes have different H3K27ac enrichment levels or peak heights.

Observed mouse adipogenesis ChIP-seq bin-counts for top 12 genes ranked by the test statistics Z0λ, W H over the promoter region for day ™2 (red) and day 7 (black). Vertical line represents the transcription starting site.
As a comparison, for each of the genes, we also calculate the simple fold-change statistics and the statistics used in DBChIP. 13 In general, we observe that large ZOλ, H W statistics correspond to large fold changes or large DBChIP statistics. We observe a small set of genes that have very small Z0λ WH statistics, but with very large fold changes or DBChIP statistics. These genes tend to have very small read counts. We also observe that some genes have very small fold changes, but with large Z0λ, HW statistics. Figure 3 shows the plots of 12 such genes. Many such genes show a clear shift of peaks between two different cell states, which cannot be captured simply using total read counts as in fold changes and the DBChIP statistics. This indicates the importance of modeling the spatial ChIP enrichment profiles.

Observed ChIP-seq bin-counts over the promoter region for day ™2 (red) and day 7 (black) for 12 genes with large Z0λ, WH but small fold changes. Vertical line represents the transcription starting site.
Differential enrichment statistics and gene expression changes
We next investigate the relationship between our test statistics Z0λ, W H and changes in expressions of the genes between the two time points. The gene expression data contain two replicates for each time point, and we take the average of two replicates as the mean value Wij for each gene i = 1, …, m and time point j = 1, 2. We define the log2 of the fold change of the expression levels as

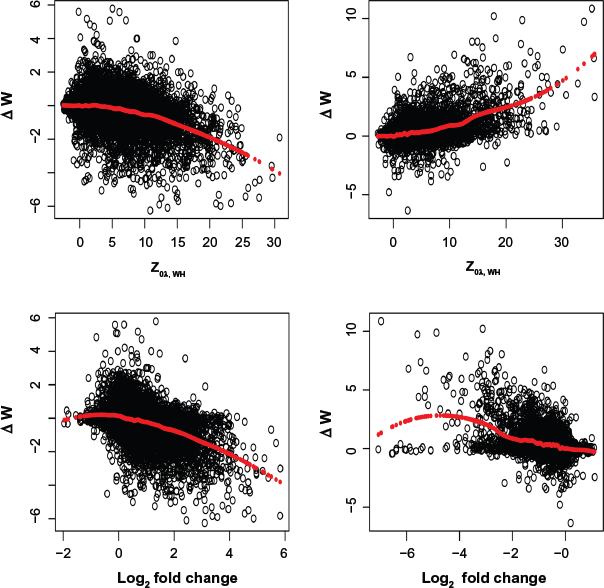
Plots of gene expression fold changes as a function of two different test statistics. Top: proposed smoothing-kernel test statistics; bottom: fold changes. Left panel: genes with enriched H3K27ac binding at day ™2; right panel: genes with enriched H3K27ac binding at day 7.
To demonstrate this further, we define gene i as being up-regulated if ΔWi > 1 and down-regulated if ΔWi < ™1. In Figure 5A, we divide our test statistics ZOλ, W H into equal-length intervals (<0, 0–5, 5–10, 10–15, 15–20, >20) for the genes that have higher enrichment at day ™2. We observe that the proportion of down-regulated genes increases as the test statistics increase. On the other hand, the proportions remain almost constant and close to zero for up-regulated genes. In contrast, for the genes that have higher enrichment at day 7, we observe exactly the opposite (see Fig. 5B). This indicates that our statistics correspond to gene expression changes very well. As a comparison, we present similar plots of the genes based on fold changes of the total reads counts (see Fig. 5C and D). We observe that the separations are not as clear as using our proposed statistics.

Plots of proportions of up/down-regulated genes in different intervals of the test statistics for the mouse adipogenesis ChIP-seq data, (
Prediction of gene expression fold changes using histone modification profiles
We next evaluate how well our proposed statistics can be used for predicting the fold changes of gene expression using ChIP-seq data. Besides the H3K27ac ChIP-seq data, we also have data from another five HMs, including H3K4mel, H3K4me2, H3K4me3, H3K27me3, and H3K36me3. In addition, for each gene, besides the promoter region, we also consider the histone modifications in gene body and downstream regions. We evaluate the prediction for fold changes of gene expression by randomly selecting half of the genes as the training set and fit a linear regression model,


Model fit (left panel) and prediction (right panel) for log of the gene expression fold changes using the proposed statistics Z0λ, HW (top panel) and fold changes (bottom panel) of six histone-modification ChIP-seq data in promoter, gene body, and downstream region.
We also observe that histone modification dynamics in the promoter and gene body are more predictive than the signals in the downstream regions for predicting the gene expression changes (see Table 1 for details). This is expected since the HMs we used are associated with transcriptional initiation (H3K4me3), open chromatin and cisregulatory activities (H3K4me2/mel and H3K27ac), transcription elongation (H3K36me3), and polycomb-mediated repression (H3K27me3).

The results are based on 100 runs of randomly selected half of the genes as training set and another half as testing set. Numbers in parentheses are standard errors.
Effects of Bandwidth Selection on Identifying the Differential Enrichment Genes
In applying our kernel-based test in analyzing the mouse ChIP-seq data, we used a global bandwidth of λ, = 20/280 for all the genes. Any reasonable test should capture the spatial profiles of signals in the gene regions of interest. On the other hand, the test should also smooth out the small local noises, which are not biologically interesting. We suggest using a relatively large bandwidth to reduce possible false positives. Alternatively, the standard method is to apply cross-validation to find the optimal rate c(1/n)1/5.
29
Neumeyer and Dette
30
suggests to obtain the nonparametric variance estimator 
We study the sensitivity of bandwidth selection on the performance of our proposed kernel-based test by considering different bandwidth values, λ1 = 5/280, λ2 = 20/280, λ3 = 60/280, and λ4 = 90/280. Here, λ3 and λ4 correspond to the bandwidths chosen by the nonparametric variance estimation method
30
and the optimal rate (1/n)1/5,
29
respectively. We calculate the kernel-based test statistics and denote these statistics as

Histogram of the test statistics
We also examine how different bandwidths affect the ability of identifying differentially expressed genes, where a gene is defined as a true differentially expressed gene if |ΔWi| > 1. Overall, we observe that it is essential to smooth out the small local signals in order to reduce false-positive identification of genes with differential enrichment. A larger bandwidth gives better results than the smaller ones.
Application to an ENCODE ChIP-Seq Data with Two Replicates
To further evaluate the possible false positives in identifying genes with differential histone modification, we analyze ChIP-seq data reported in the Encyclopedia of DNA Elements (ENCODE) project 32 for a B-lymphoblastoid cell line of human GM12878, which is also part of the 1000 Genomes project, and HeLa-S3 cervical carcinoma cells. Our analysis still focuses on the H3K27ac mark at the promoter regions of the genes with count data available in n = 280 bins for each gene. In this experiment, there are a total of m* = 23807 genes. Besides the ChIP-seq data for two biological replicates, two input data are also available. Ideally, we should not expect any genes with differential enrichment between the two replicates. We apply the same procedure as in our analysis of the mouse data in the Application to a Comparative ChIP-seq Study During Mouse Adipogenesis section to the data between two ChIP-seq replicates and calculate test statistics Znew, i for each gene i, i = 1, …, m = 23,807. The histogram of Znew for all the genes in Figure 8 (top plot) shows that the majority of the test statistics follow the standard normal distribution. In addition, using a Bonferroni-adjusted P value of 0.05, our procedure identifies only 263 genes that show differential enrichment between the two replicates, which results in a less than 1.5% false discovery rate. This analysis further demonstrates that our proposed kernel-based nonparametric testing procedure is not only powerful enough to detect the true differential enriched regions but also makes fewer false identifications.
Top: Histogram of differential enrichment test statistics Znew between two biological replicates of the ENCODE data for all 23,807 genes. Bottom: Histogram of differential enrichment test statistics Znew between two cell types (B-lymphoblastoid cell vs HeLa-S3 cervical carcinoma cells) of the ENCODE data for all 23,807 genes. The red curve represents the standard normal density.
We also perform an analysis to identify the genes with differential enrichment of histone modification between a B-lymphoblastoid cells and HeLa-S3 cervical carcinoma cells. Figure 8 (bottom plot) shows the histogram of the test statistics for all 23,807 genes. Using a Bonferroni threshold for genome-wide level of 0.05, we identify 6,647 genes that show differential H3K27ac enrichment at their promoter regions.
Conclusions and Discussion
We have proposed a kernel-smoothing-based nonparametric test to identify genes with differential histone enrichment for ChIP-seq data. Different from all the currently available methods, our method models the spatial histone enrichment profiles at the promoter regions of the genes, rather than simply modeling the total read counts in a given window. The method can therefore capture different types of differences in protein-enriched profiles between two experimental conditions. To detect differences in enrichment profiles, we constructed a nonparametric statistic based on kernel smoothing on the differences of the profiles after approximate normal transformation of the data. We have shown that the proposed test statistic corresponds to the gene expression changes better than other statistics and the models based on a combination of different HMs can effectively predict the gene expression fold changes. Although prediction of gene expression using the ChIP-seq data has been studied in many published works,33,34 these papers focused only on prediction of gene expression at a static state. Our results further demonstrate that change of histone modifications and the dynamic chromatin signatures can also be very predictive for the fold-changes of gene expression between two different cellular states.
We considered only the problem of identifying the differential enrichment regions between two conditions, where we fit the kernel-smoothing to the differences of the normal transformed data in order to further smooth out the small local changes that might be due to differences in GC contents or mappability of the sequencing reads. By smoothing, we expect that our procedure is robust to such small changes due to genomic features. If input data are available, one can take the difference of the square-root transformed count data between ChIP and input and then apply our proposed test with kernel smoothing. The method requires the users to specify the regions to test. Besides the regions close to genes as we tested in this paper, one can also first identify the histone-enriched regions using some existing methods such as MACS 7 or SICER 35 and then test for differential enrichments using our proposed methods. Finally, our proposed method can be extended to identify differential enrichment in multiple conditions. In such cases, we can define the test statistic as the mean or maximum of all the pair-wise statistics as proposed in this paper.
Author Contributions
Conceived and designed the experiments: HL, QW, KW. Analyzed the data: HL, QW, KW. Wrote the first draft of the manuscript: QW, HL. Contributed to the writing of the manuscript: HL, QW, KW. Agree with manuscript results and conclusions: QW, KW, HL. Jointly developed the structure and arguments for the paper: QW, HL, KW. Made critical revisions and approved final version: QW, KW, HL. All authors reviewed and approved of the final manuscript.