
Abstract
Background
Signaling networks are of great importance for us to understand the cell's regulatory mechanism. The rise of large-scale genomic and proteomic data, and prior biological knowledge has paved the way for the reconstruction and discovery of novel signaling pathways in a data-driven manner. In this study, we investigate computational methods that integrate proteomics and transcriptomic data to identify signaling pathways transmitting signals in response to specific stimuli. Such methods can be applied to cancer genomic data to infer perturbed signaling pathways.
Method
We proposed a novel Bayesian Network (BN) framework to integrate transcriptomic data with proteomic data reflecting protein phosphorylation states for the purpose of identifying the pathways transmitting the signal of diverse stimuli in rat and human cells. We represented the proteins and genes as nodes in a BN in which edges reflect the regulatory relationship between signaling proteins. We designed an efficient inference algorithm that incorporated the prior knowledge of pathways and searched for a network structure in a data-driven manner.
Results
We applied our method to infer rat and human specific networks given gene expression and proteomic datasets. We were able to effectively identify sparse signaling networks that modeled the observed transcriptomic and proteomic data. Our methods were able to identify distinct signaling pathways for rat and human cells in a data-driven manner, based on the facts that rat and human cells exhibited distinct transcriptomic and proteomics responses to a common set of stimuli. Our model performed well in the SBV IMPROVER challenge in comparison to other models addressing the same task. The capability of inferring signaling pathways in a data-driven fashion may contribute to cancer research by identifying distinct aberrations in signaling pathways underlying heterogeneous cancers subtypes.
Introduction
Phosphorylation of signaling proteins is one of the common mechanisms cells employ to transmit signals. The emerging proteomics technology provides us with an excellent platform to monitor the phosphorylation states of a large number of
A wealth of data is available for investigating large-scale regulatory networks, due to the rise of the high-throughput technology which enables the simultaneous genome-scale measurements. Certain technologies have been applied to utilize large-scale data in the field.4–7 One commonly used method is differential equations, which uses a set of ordinary differential equations (ODEs) to represent a dynamic system in a more quantitative and precise manner. 8 However, with the increasing size of the network, the identification of model structure and estimation of parameters become very difficult, which might require network simplification or approximation. 9 The information theory based model, in general, is to determine the regulatory dependency based on correlation analysis, and has a major advantage of low computational cost on large-scale networks.6,10 There are also other various methods to model and simulate large-scale signal transduction network: Boolean network which uses binary variables and simple Boolean operation functions, eg, AND, OR, NOT, to represent a discrete dynamic system;11,12 Network Component Analysis (NCA) which uses prior information to constrain the search space for pathway inference;13,14 supervised inference method, eg support vector machine (SVM), which splits the network inference into multiple classification problems. 15
However, most of the approaches described above do not allow uncertainty to be included in the model. In contrast, Bayesian Network (BN) can formulate the quantitative knowledge of the signaling pathways using probabilistic graphical representation, which introduces the uncertainty to the model.16–18 A BN is a directed acyclic graph (DAG) used to represent the joint distribution of a set of variables, and with certain constraints it can represent the causal relationship among these variables.
18
A BN approach is particularly suitable to represent the regulatory relationships among signaling proteins because the directed edges can be used to represent causal relationships.16,17,19,20 However, applying BN to learn signaling pathways based on large-scale genome data is also challenging in the following aspects. First, the DAG constraint of a conventional BN hinders its capability to represent the often observed feedback loops in biological systems, recent development of “loopy” inference algorithm may address such concerns.
21
Second, with a large number of signaling proteins interacting and regulating each other, conventional approaches of representing probabilistic relationships among variables using conditional probability tables (CPT) becomes intractable, because the size of a CPT is exponential to the number of parents of a node. Finally,
To assess the current methods in learning cell signaling network and also try to understand the differences between rat and human cell signaling networks in response to common stimuli, SBV IMPROVER organized a Species Specific Network Inference challenge (https://www.sbvimprover.com/challenge-2/sub-challenge-4-species-network-inference) based on rat and human genomic and proteomic data. 22 In this challenge, a literature curated reference network with 220 nodes and 501 edges was provided as prior knowledge, from which the participants could add or remove edges. Figure 1 shows the overview of the network inference problem.

Overview of the network inference problem. The task is to predict two separate signaling networks for rat and human by adding and trimming edges from reference network by applying BN learning method to gene expression and reverse phase protein array data.
We participated in the SBV IMPROVER challenge and developed a novel BN learning approach to search for signaling pathways that model the information flow from extracellular stimuli to
Methods
Data collection and pre-processing
The transcriptomic and proteomic data for both rat and human were provided by SBV IMPROVER organizers.
24
The phosphorylation states for 16
Gene expression data was also measured and normalized for cells exposed to 26 stimuli (two or three replicates per stimulus) and DME controls (Dulbecco's Modified Eagle's Medium corresponding to standard cell culture medium). In total, the data included 13,841 genes measured under 75 stimuli conditions and 16 DME controls for rat, and 20,010 genes measured under 76 stimuli conditions and 16 DME controls for human. We then calculated the gene expression fold change as the ratio of the gene expression level under stimuli conditions over the DME controls. We define a gene is differentially expressed under a specific treatment condition, if the expression value of the gene exhibited a change of over twofold (increase or decrease). Then, we transformed the gene expression data into a 13,841 x 75 binary matrix for rat and a 20,010 x 76 binary matrix for human, such that a “1” in the matrix indicates a gene is differentially expressed under a treatment condition.
A reference network derived from literature was provided by the SBV IMPROVER as a starting point, which contains 220 nodes and 501 edges. The nodes could be classified into three categories: (1) stimuli, (2) signaling proteins which are composed of receptors,
BN representation
A BN is a DAG to represent the joint distribution of a set of variables, which could be further factorized as a series of conditional probabilities. First, we transformed the augmented reference network into a BN, where the nodes represent the variables, eg, stimuli, 
Learning structure of species-specific signaling networks
We formulated the problem of learning signaling pathways as a task of learning BN structure based on the observed gene expression and protein phosphorylation data under different stimuli. Here, we adopt a Bayesian approach toward the goal of searching for a network structure, 


Learning BN structure based on observed data in our setting is difficult in the following aspects: (1) It is a NP-hard problem, due to the super exponential number of all possible network structures
We developed an algorithm integrating Gibbs-samplingbased belief propagation and a Monte Carlo approach to simultaneously address the items 2 and 3 in the previous paragraph (Fig. 2). Assuming that prior probability for any structure was uniformly distributed, we concentrated on computing an approximated marginal likelihood using samples obtained from Gibbs sampling and calculated the integration in Equation (4) via a Monte Carlo approach. Given a BN structure, we started 
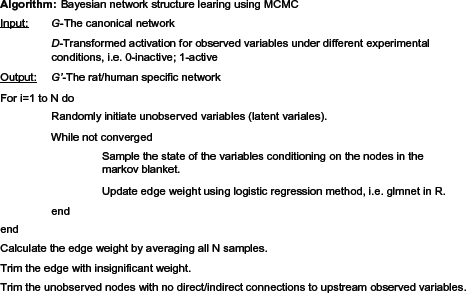
Pseudo code of learning BN structure with MCMC algorithm.
Learning network structure and parameters simultaneously
To avoid exhaustively searching through the space of network structures which was intractable, we developed an approach to simultaneously infer network structure and parameters by taking advantage of the form of conditional probability defined in our model. We constructed an initial network including all the edges in the augmented reference network, and we represented the conditional probability of a node using a logistic function as defined in Equation (1). The logistic regression represents the conditional probability between a node and its parent in a linear space instead of the exponential space associated with CPT. A logistic regression representation further enabled us to search for the BN structure through parameterization of the conditional probability. If an element β associated with an edge from a parent node is set to zero, it is equivalent to deleting the edge from the network. We employed an elastic network approach to trim the edges using the R package “glmnet.”
25
The elastic network can be used to learn regularized parameters in the framework of a generalized linear model in the following form:

There is a connection between regularized regression and Bayesian treatment of regression as follows: estimating model parameters with an L1 regularization is equivalent to estimating the maximum a posterior (MAP) parameters under a Laplacian prior over the parameters; estimating parameters with an L2 regularization is equivalent to estimating MAP parameters under a Gaussian prior over the parameters centering at 0. Therefore, the elastic network model in a linear regression setting can be thought of as estimating MAP parameters under a mixture of prior distributions. When the above assumptions are generalized to logistic regression under our setting, one can treat a MAP parameter vector 
Results
Overview
Learning a species-specific network is equivalent to searching for a subset of nodes and edges from the reference network, which give the best representation of the observed data for a particular species. We addressed this task by going through the following steps: (1) augmenting the initial reference network by adding edges from known TFs to potential targets and edges between
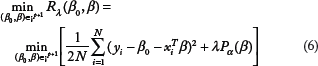
We tuned the α and λ, parameters of “glmnet” and searched for the optimal penalty that led to the sparsest model with best performance [Equations (8) and (9)]. Figure 3A shows that by increasing α (increasing L1 penalization while decreasing L2 penalization), we tend to have sparser networks, which is to be expected. Interestingly, Figure 3B shows that the models with around 350 edges return the best marginal log likelihood for both rat and human data, whereas models with too many edges or too few edges do not fit the data well. This is a key advantage of Bayesian model selection, such that it penalizes the too complex models that tend to over-fit data and the too simple models that cannot explain data well - a characteristic commonly referred to as Occam's razor. We selected the best models with αrat = 0.9 and αhuman = 1, for rat and human, respectively. Over half of the edges were trimmed off for both rat and human augmented reference networks. We also found that interactions between
(
Learning rat and human specific signaling networks
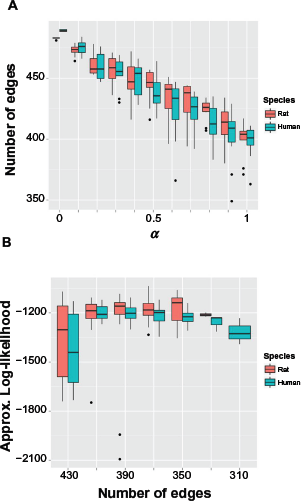
We applied our BN learning method to infer the rat and human specific signaling networks from experimental data, incorporating the augmented reference network which contains 220 nodes and 817 edges. The predicted networks are much sparser than the given the reference network, which only contains about half the edges in the reference network: the rat network is composed of 171 nodes and 366 edges, and the human network is composed of 171 nodes and 355 edges (Table 1 and Figure 4). Notably, most of the trimmed edges correspond to TF->gene interactions, ie, 38 out of 72 genes were deleted for having no incoming transcriptional signal. The result was evaluated and scored by the SBV IMPROVER Species Specific Network Inference challenge committee, and ranked as one of two best per forming teams in the competition, ie, team PITT.DBMI.DREAM (https://www.sbvimprover.com/challenge-2/overview).
Number of nodes, edges, signaling edges, and transcriptional edges in segmented reference network, predicted rat network, predicted human network, and predicted network intersection between rat and human.

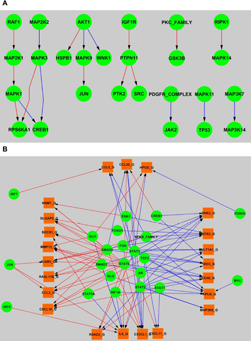
The predicted rat and human signaling network.
The two predicted networks inferred by our approach represent plausible signaling pathways specific to rat and human, respectively. In contrast to the original reference network, six signaling edges are not retained in either rat or human network. For example, MTOR → RPS6KB2, RPS6KB2 → RPS6, and RPS6KB2 → RPS6 are deleted due to the fact that the parameters associated with these edges cannot be learned since both of the latent variables, i.e. RPS6 and RPS6KB2, do not have any downstream observable node. We have also added three edges between AKT1 and three other proteins, ie, IKB_FAMILY, HSPB1, and MAPK9. The proposed regulations are consistent with the experimental facts: Aurora-A down-regulates IKB_FAMILY via AKT activation; 26 HSPB1 phosphorylation level is mediated by AKT activity in epidermal differentiation; 27 and the JNK2-mediated phosphorylation of JIP1 results in the dissociation of AKT1 from JIP1 and subsequently restores AKT1 enzyme activity. 28 Moreover, a number of gene targets have been added to the networks for known TFs, ie, CREB1 (2 targets), SMAD2 (25 targets), STAT2 (23 targets), STAT3 (21 targets), and STAT6 (30 targets).29–31
Signaling network translatability between rat and human
Figure 4 shows the networks learned by our method and the comparison between rat and human. There is a significant overlap between these two networks, ie, 162 shared nodes and 289 shared edges (Table 1). The predicted network represents various cellular pathways according to the KEGG database, 32 eg, MAPK signaling pathway, PI3 K-Akt signaling pathway, Jak-STAT signaling pathway, Ras signaling pathway, NF-kappa B signaling pathway, etc.
The result also shows that the interactions among
(
Discussion
Reconstruction of the signaling networks is very important for us to study cells’ regulatory mechanism, and the knowledge of correctly inferred signaling pathways can be further utilized to improve disease treatment and drug development.5,33 Animal models play an essential role during this process, and exploring the commonality and discrepancy between human and animal models can help us better understand the human signaling network and ultimately design better drugs. In this study, we developed a BN structure learning approach for a species specific network learning task with three advantages: (1) we efficiently built the reference network to confine the network searching space by incorporating prior knowledge from literature and adding edges between the nodes with statistically significant correlations; (2) we avoided searching the super exponential space of all possible structures by adopting the MCMC EM method to infer the states of latent variables and estimate parameters associated with the edges; (3) we predicted the sparsest network to best represent the observed data by employing elastic network approach to determine the edge weight and network structure.
The predicted networks showed very strong overlaps between rat and human, especially at the protein signal transduction level, which suggested that there was no entire signaling paradigm shift between rat and human. However, TF to gene interactions tended to be more divergent between rat and human, where certain TFs were predicted to have different sets of gene targets. This difference could be the key to explain the discrepancy in gene expression profiles between rat and human under a common stimulus. These findings need further careful verification which may require carrying out more thorough experimental work.
Our approach could be further extended to infer the activation states of signaling proteins given only gene expression profiles once the network structure and parameters are determined. This inference process could be very useful to learn the pathway driving forces in a patient specific fashion, because gene expression technology is readily applicable in clinical environment, particularly in cancer care, whereas proteomic analysis has not been widely used in clinical setting and is more expensive. In addition, our study provides an example to demonstrate the feasibility of inferring the signaling pathway and its state through integrating transcriptomic and proteomic data, and it may motivate more studies to apply the principles developed in this study in cancer and other disease researches.
Conclusion
We developed a BN framework for learning species-specific signaling pathways that provided the best presentations for the observed data with the sparsest network, by applying advanced statistical methods on the reference graph to infer the states of latent variables and estimate the parameters associated with the edges. The results were assessed and scored as the top performer by SBV IMPROVER Species Specific Network Inference challenge committee and also matched with experimental evidence. Our predictions that the protein signaling pathways are conserved and TF–gene interactions are divergent, could be used to explain the difference in gene expression profiles between rat and human, which needs further experimental verifications.
Author Contributions
Conceived and designed the experiments: XL, CC. Analyzed the data: LC, CC, XL. Wrote the first draft of the manuscript: CC. Contributed to the writing of the manuscript: XL, XJ. Agree with manuscript results and conclusions: XL, CC, XJ. Jointly developed the structure and arguments for the paper: XL, CC. Made critical revisions and approved final version: CC, XL, XJ. All authors reviewed and approved of the final manuscript.
Footnotes
Acknowledgements
The authors would like to thank Drs. Gregory Cooper and Sognjian Lu for their constructive discussions during the project. The authors also would like to thank Mr. Kevin Lu for proofreading the final manuscript.