
Abstract
The objective of this study was to gain insight into the biological basis of colon cancer progression by characterizing gene expression differences between normal colon epithelium, corresponding colorectal primary tumors and metastases. We found a close similarity in gene expression patterns between primary tumors and metastases, indicating a correlation between gene expression and morphological characteristics. PRDX4 was identified as highly expressed both in primary colon tumors and metastases, and selected for further characterization. Our study revealed that “Prdx4” (PrxIV, AOE372) shows functional similarities to other Prx family members by negatively affecting apoptosis induction in tumor cells. In addition, our study links Prdx4 with Hif-1α, a key regulatory factor of angiogenesis. Targeting Prdx4 may be an attractive approach in cancer therapy, as its inhibition is expected to lead to induction of apoptosis and blockage of Hif-1α-mediated tumor angiogenesis.
Keywords
Introduction
In spite of the vast enumeration of cancer cell genotypes Hanahan and Weinberg 1 suggested six essential alterations in the cell physiology of cancer cells enabling malignant growth. One feature of most and perhaps all types of cancer is the acquired resistance towards apoptosis. Three members of the peroxiredoxin-family have been described as inhibitors of apoptosis so far (PrxI 2 , PrxII 3 and PrxIII4,5). Peroxiredoxins (Prx), also known as thioredoxin peroxidases (Tpx), represent a large ubiquitous family of antioxidant enzymes that are well conserved from bacteria to humans and are capable of reducing hydrogen peroxide by acting together with thioredoxin and thioredoxin reductase in a redox chain that couples reduction of peroxide to NADPH oxidation.6,7 Peroxiredoxins play a protective role against oxidative stress, arising within the cell when levels of reactive oxygen species, including hydrogen peroxide (H2O2), superoxide (O2–), singlet oxygen (O–), hydroxyl radical (OH–) and nitric oxide radical (NO–) exceed the available antioxidant defense that scavenges and inactivates the reactive oxygen species 8 . In addition, peroxiredoxins are involved in signal transduction, gene expression, differentiation, proliferation and apoptosis of cells.6,9,10 Up-regulation of TRAIL has been shown to specifically suppress PRDX4 expression on the transcriptional level. 11 Trx-1, a member of the thioredoxin family, if stably expressed in cancer cells significantly increases Hif-1α protein levels and protein products of hypoxia-responsive genes such as VEGF under normoxic as well as hypoxic conditions. 12 Hif proteins represent a family of hypoxia-inducible transcription factors, which are normally activated upon reduced levels of molecular oxygen and induce expression of downstream target genes such as erythropoietin, iNOS and VEGF, that play important roles in angiogenesis, vascular remodeling, glucose and energy metabolism, cell proliferation, survival, erythropoiesis and iron homeostasis. In particular Hif-1α plays a critical role in pathophysiological processes such as tumorigenesis.13–15 Hif transcription factors are heterodimers of the hypoxia-induced Hif-1α subunit (or its paralogs Hif-2α or Hif-3α) and the constitutively expressed Hif-1β subunit, also known as Arnt-1 (aryl hydrocarbon receptor nuclear translocator). 16 Hif-1α is rapidly degraded by the ubiquitin-proteasome pathway under normal oxygen conditions (normoxia, 20% oxygen), 13 but degradation of Hif-1α is blocked under hypoxic conditions (1% oxygen) and therefore accumulates in the nucleus, where it dimerizes with Hif-1β and binds to specific enhancer elements (HREs: hypoxia-responsive elements/HIF-responsive elements) to activate transcription of target genes such as VEGF and VEGFR. 13
We have made use of laser capture micro-dissection to overcome the tremendous heterogeneity in tissues, and in combination with DNA micro-arrays we have generated mRNA expression profiles of biopsies obtained either from normal colon epithelium or from localized primary colon tumors and their corresponding metastases in lymph nodes and in liver. Hierarchical clustering of expression data leads to a tight clustering of normal epithelium, whereas primary tumors and metastases cluster according to their histopathologic characteristics such as grading and morphology. A subset of genes specifically expressed in tumors or metastases were identified. Among those, we functionally characterized Prdx4 and determined roles of this peroxiredoxin family member in blocking apoptosis and activating Hif-1α in cancer cells.
Materials and Methods
Tissue Sampling and Laser Capture Micro-Dissection
All biopsies of colon cancer patients were collected at the University of Graz following approval by the Institutional Review Boards and written informed consent. Tissue sections were stained either with Harris hematoxylin and eosin or with Mayers hematoxylin (all from Sigma, Vienna, Austria). For histological classification morphological criteria such as solid or tubular were examined independently of grading (well, moderately, poorly). Laser capture microdissection (LCM) was performed using either the Robot-Micro Beam from PALM (Bernried, Germany) or the Pix Cell II laser-system (Arcturus, Molecular Devices, Mountain View, CA, USA). Cells of selected areas were lysed in 50 μl TRIzol (Invitrogen, Lofer, Austria) and isolation of total RNA was performed as recommended by the manufacturer.
cRNA synthesis, GeneChip® Hybridization and Data Analysis
Labeled cRNA was synthesized according to manufacture's instructions (GeneChip® Expression Analysis Technical Manual, Affymetrix, 1999, Santa Clara, CA) or with minor modifications for LCM samples by using two rounds of T7 amplification 17 in one quarter of the reaction mixture during synthesis of ss cDNA. The first in vitro transcription (IVT)-reaction was performed with unlabeled rNTPs (18.75 mM each, Promega, Mannheim, Germany). Subsequently, 1 μg random hexamers (Promega) was used for re-conversion into cDNA at 70 °C for 10 min. After hybridization to HuGeneFL GeneChip® arrays (Affymetrix, Santa Clara, CA), GeneChip® expression data were normalized with the robust multi-array analysis (RMA) described by Irizarry et al. 18 and implemented within Bioconductor (version 1.8.1). The RMA-algorithm of the “affy” package (version 1.3.27) was used with default parameter settings such as convolution background correction, quantile normalization and multi-chip summarization. Genes with a coefficient of variation (CV) larger than a cutoff of 0.1 were selected for hierarchical clustering with the Spotfire Decision Site 7.3 (version 11, Spotfire®), thereby using “complete linkage” as clustering method and the “cosine correlation algorithm” for similarity measure. The multtest package (version 1.3.3) from Bioconductor was subsequently used to identify deregulated genes. Micro-dissected tissue samples derived from colon cancer patients were divided into four groups according to their tissue types: Colon normal epithelium (n), primary tumors (p), metastases (m) and in addition, cancerous tissues containing both primary tumors and metastasis (pm). Between each group respective fold change values (FC) and Bonferroni adjusted P-values were calculated based on the two-sample Welch t-statistics. Genes with Bonferroni adjusted P-values <0.005 and fold changes either >2 (overexpressed) or <0.5 (downregulated) were selected.
Accession Codes
Microarray data are available from the Gene Expression Omnibus (GEO) under accession number of GSE26571.
In Situ Hybridisation (ISH)
Primers for PCR amplification of PRDX4 (5′-GCTG CTTCTGCTGCCGCTACT-3′ and 5′-AGGCCAAA TGGGTAAACTGTGAATC-3′) were designed using “MapDraw™ (DNASTAR, Inc., Madison, WI, USA).
PRDX4 PCR product was then cloned between SP6 and T7 RNA polymerase sites of pCR®II-TOPO®vector (TOPO TA Cloning® Kit Dual Promotor, Invitrogen). For transformation the chemical competent TOP10F’ E. coli strain was used. Purified template DNA was linearized at 37 °C for at least 60 min by restriction digestion with Xho I for IVT with SP6 RNA polymerase or with BamHI for IVT with T7 RNA polymerase and purified by using Phase Lock Gels (PLG Light, Eppendorf). In vitro transcription and digoxigenin (DIG) labeling were performed with the DIG RNA Labeling Kit (Sp6/T7) (Roche Diagnostics, Germany) with the following modified reaction mixture: 1 μg of the linearized DNA was mixed with 2 μl 10 × HY Reaction buffer (Enzo), 2 μl 10 × DIG RNA Labeling Mix (Roche), 2 μl 10 × DTT (Enzo), 2 μl 10 × RNase Inhibitor Mix (Enzo), 50 units of either T7 (Enzo) or SP6 (Roche) RNA Polymerase and DEPC-H2O was added to a total volume of 20 μl. Labeled transcripts were purified by precipitation with glycogen and ammonium acetate. Multiple Tissue Arrays (from normal organs “FH-A2” and various tumors “FH-B1” from Super BioChips Laboratories, Korea), dried for 1 hour at 58 °C before de-paraffinization, were hybridized with the labeled transcripts at 55 °C–58 °C overnight as described.19,20 Substrate reaction was stopped with TE-Buffer (10 mM Tris/1 mM EDTA, pH8.0) followed by incubation in 95% Ethanol and rinsing with water as described. 21 PBS washed slides were blocked for 15 min in TSA blocking buffer (NEN Life Science Products) and cell nuclei were stained with DAPI (Roche) in TSA blocking buffer. Slides were washed with TSA wash buffer (NEN Life Science Products) and photographs were taken on a Zeiss fluorescence microscope “Axioplan2 Imaging” (condensor control: DIC1, reflector: 01E 365/12).
Cell Culture and siRNA Transfections
HCT-116 (human epithelial colorectal carcinoma, CCL-247) and HeLa (human epithelial cervix adenocarcinoma, CCL-2) cell lines were derived from ATCC (American Type Culture Collection, Manassas, VA) and cultured as recommended. siRNA duplexes for PRDX4 with the following sequences were designed according to guidelines:22,23 5′-AAGGCTGCTTCTGCTGCCGCT-3′ (AOEsi1), 5′-AAGGATTCCACTTCTTTCAGA-3′ (AOEsi2). Both were purchased from Dharmacon. 5′-AACCTGGTAGTGAAACAATAA-3′ (AOEsi1Q) was custom-designed by QIAgen. HeLa cells were transfected with OligofectAMINE™ Reagent (Invitrogen, Lofer, Austria) following the guidelines of Tuschl; 23 HCT-116 cells were transfected with Lipofectamine™ 2000 (Invitrogen, Lofer, Austria) according to the manufacture's instructions, but using identical amounts of siRNAs, OPTI-MEM® and transfection agent, as used for transfection with OligofectAMINE™.
RNA Isolation, cDNA Synthesis and Real Time PCR
Total RNA was isolated with TRIzol® (Invitrogen, Lofer, Austria). For RNA isolation of treated cells (eg, after transfection of siRNAs), floating cells were harvested by centrifugation at 80–100 × g and pooled with cell lysates of the detached cells. RNA was converted into cDNA using anoligo-dT Primer (5′-GGC-CAGTGAATTGTAATACGACTCACTATAGGGAGGCGGTTTTTTTTTTTTTTTTTTTTTTTT-3′) and Superscript II Reverse Transcriptase (200 U/μl, Gibco BRL). 2.5 μl of cDNA was subjected to Real Time PCR utilizing an ABI PRISM 7700 Sequence Detection System (PE Applied Biosystems) or a Mx4000™ (Stratagene, La Jolla, CA, USA). For PRDX4 amplification 2× SYBR®Green PCR Master Mix (Applied Biosystems), 0.2 μM of primers and 0.5 units AmpErase® Uracil N-glycosylase (Applied Biosystems) and the primer pair: 5′-CAGCTGTGATCGATGGAGAA-3′ and 5′-CTT CAAGTCTGTCGCCAAAA-3′ were used. After incubation for 2 min at 50 °C and for 10 min at 95 °C, target amplification was carried out with 40 cycles for 15 sec at 95 °C and 1 min at 60 °C. Standards, samples and non-template controls were analyzed in triplicates. Transcript levels were normalized to those of EMAP-II (Endothelial-Monocyte Activating Polypeptide II protein, SCYE1) and expression levels were quantified by the comparative CT method or the standard curve method (for further details see 24 ).
Cell Death Detection ELISAPLUS
Cell Death Detection ELISAPLUS assays (Roche) were performed as recommended by the manufacturer.
Statistical Analysis to Determine the Significance of Apoptosis Induction
The statistical significance of the difference was calculated between the control siRNA (scrsi) and AOE siRNA using t-test. P-values of P < 0.05 were considered significant.
Protein Extraction and Preparation of Nuclear Extracts
For protein extraction cells were harvested in HEPEX buffer (20 mM HEPES pH 7.4, 100 mM NaCl, 5 mM EDTA pH 7.4, 1 mM Na3VO4 (Minimum: 90%), 30 mM NaF, 5% Glycerol, 0.1% SDS, 1% Triton X-100, 10 mM p-Nitro-phenyl-phosphate, 1 mM β-Glycerophosphate in H2O and complemented with 1 tablet of Protease Inhibitor Cocktail (Complete, Mini, EDTA-free, Roche) per 10 ml), transferred into microcentrifuge tubes, mixed and frozen at –20 °C for at least two hours. Lysate was thawed on ice and mixed again and centrifuged at full speed (20000 × g) at 4 °C for 15 min. The supernatant was transferred into a fresh microcentrifuge tube and put on ice or stored in aliquots at –20 °C. Non-adherent subpopulations of siRNA-treated cells were harvested by centrifugation at 200 × g and 4 °C for 5 min, washed with icecold PBS and re-suspended in HEPEX-buffer. For the preparation of nuclear extracts cells were scraped off in medium and collected by centrifugation at 200 × g and 4 °C for 5 min, washed once in 1 ml cold PBS (+1 mM MgCl2) and re-suspended in three volumes of buffer (10 mM HEPES pH 7.9, 10 mM KCl, 1.5 mM MgCl2 completed with 0.5 mM DTT and Protease Inhibitor Cocktail (Complete, Mini, EDTA-free, Roche) before use) and incubated for 30 min on ice. Cells were sheared with a 26G needle for 20 times. The cell suspension was centrifuged at 1300 × g and 4 °C for 10 min. To collect the cytoplasmic fraction, the supernatant was transferred into a fresh 1.5 ml microcentrifuge tube and centrifuged at full speed (20000 × g) at 4 °C for 10 min. The supernatant (cytoplasm) was transferred into a fresh 1.5 ml microcentrifuge tube. The precipitated nuclei were re-suspended in an equal volume of a buffer (20 mM HEPES pH 7.9, 420 mM NaC1, 1.5 mM MgCl2, 0.2 mM EDTA and 25% Glycerol completed with 0.5 mM DTT and Protease Inhibitor Cocktail (Complete, Mini, EDTA-free, Roche) before use) and incubated for 1 h on ice, with occasional agitating. The suspension was centrifuged at full speed (20000 × g) at 4 °C for 5 min. The supernatant (nuclear extract) was transferred into a fresh 1.5 ml microcentrifuge tube.
Western Blotting
Equal amounts of protein lysates in HEPEX-buffer (5-50 μg) were separated on a Tris/HCl buffered SDS-gel (Criterion Precast Gel, 12,5%, Tris-HCl; BioRad) and proteins were transferred by wet blotting on a nitrocellulose membrane (Immun-Blot PVDF/Filter Paper Sandwich, BioRad). After blocking for 15–50 min in PBS/10% FCS/1% BSA/0.5% Tween20 the membrane was incubated (1.5 h at RT or overnight at 4 °C) with the primary antibody in blocking solution, followed by incubation with the secondary antibody (either HRP (Horse Radish Peroxidase) or Alkaline Phosphatase conjugated) in PBS/0.5% Tween20. Detection was done either with BCIP/NBT Alkaline Phosphatase Substrate (Sigma) or with ECL (ECL™ Western blotting detection reagent, Amersham Pharmacia Biotech) by developing on X-ray films (CL-XPosure Film, Pierce).
Antibodies
Monoclonal Anti β-actin (Clone AC-74), Mouse Ascites Fluid (Promega), α-tubulin antibody mouse (kindly provided by I. Waizenegger), Anti Prdx4 serum, rabbit polyclonal (affinity purified), HIF-1α antibody, mouse IgG1 (BD Biosciences), Anti PARP (214/215) Cleavage Site, Rabbit (polyclonal) (Biosource), Rabbit Anti Mouse Immunoglobulins, Peroxidase-conjugated (Dako), Goat Anti-Rabbit IgG, Horseradish Peroxidase conjugated (Abcam) and Anti-Rabbit IgG (Fc) Alkaline Phosphase Conjugate (Promega).
Generation of a Specific anti Prdx4 Immune-Serum
A peptide (AA133–AA144) of Prdx4 with an additional cysteine residue at the amino terminal was synthesized with the automated solid phase technique, purified by HPLC and re-checked by mass spectroscopy. Immunization of rabbits with the Prdx4 peptide was performed at Gramsch Laboratories, Munich. Immune serum was purified with the SulfoLink® Kit (Pierce) as recommended by the manufacturer.
Results
Gene Expression of Tumors Correlates with Histopathology
In order to identify genes implicated in tumor progression or metastasis formation, we performed mRNA expression profiling of normal colon epithelium, primary colon tumors and either lymph node metastases or liver metastases from twelve colon cancer patients. From three patients each tissue type such as normal tissue, primary tumor and a metastasis was available. As a control one primary tumor and two metastases were analyzed twofold. Epithelial cells of normal tissues and tumor cells were enriched by using laser capture micro-dissection (LCM). Total RNA was isolated and amplified for GeneChip® hybridization using a slightly modified linear T7 amplification protocol described by Luo et al. 17 In addition, cRNAs prepared from four cell lines derived from three primary tumors and one metastasis of colon cancer patients 25 were analyzed. After GeneChip® hybridization data were normalized using the robust multi-array analysis (RMA) algorithm 18 as implemented within Bioconductor (version 1.8.1, http://bioconductor.org). In total, 109 genes with a coefficient of variation (CV) above 0.1, indicating a varying expression within all tissue samples, were selected for hierarchical clustering (Fig. 1A). Samples generated from the five normal colon tissues group together, whereas primary tumors and metastases form distinct sub-trees. Replicates from the same tumor or metastases thereof form a tight cluster indicating the reproducibility of our method of sample preparation using LCM and linear amplification of RNA. Cell lines generated from biopsies of colon cancer patients form a separate cluster.
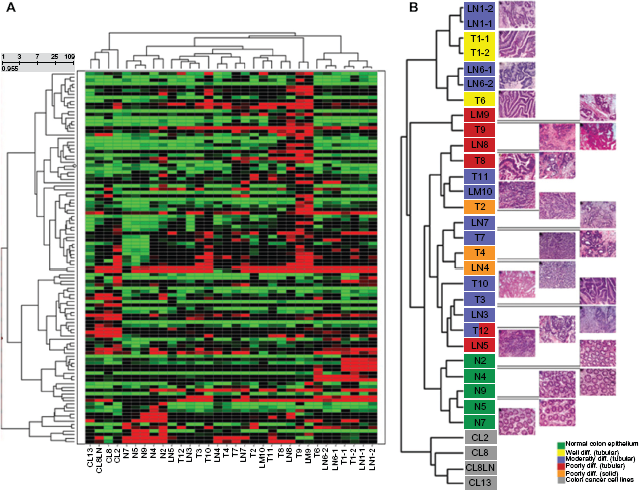
Hierarchical cluster analysis of deregulated genes and correlation of the dendrogram of the tissue samples with the respective H/E-stained tissue sections. A) 109 genes with a coefficient of variation (CV) larger than the cut-off of 0.1 were used for hierarchical clustering. B) The dendrogram of the tissue samples from the hierarchical cluster analysis is shown in an enlarged view. The corresponding hematoxylin/eosin (H/E)-stained tissue sections of each sample (on the right) has been aligned with the dendrogram.
Comparison of the hematoxylin/eosin (H/E)-stained sections from corresponding tissue samples with the dendrogram generated by hierarchical clustering of expression data revealed a correlation between gene expression and the histopathology (grading and morphology) of the primary tumors and metastases (Fig. 1B). The highly differentiated, tubular tumors T1 and T6 form clusters with their corresponding metastases. Moderately differentiated, tubular cancerous tissues are grouped together with most of the poorly differentiated, tubular tumors. Within the cluster of the moderately and poorly differentiated, tubular cancerous tissues also the solid, poorly differentiated tumors T2, T4 and the corresponding metastasis sample LN4 are found. Only the poorly differentiated, tubular tumor T9 and the corresponding liver metastasis LM9 form a separate cluster. Interestingly, a tight clustering of primary tumors with their metastases is found in most cases. In summary, most primary tumors and metastases cluster according to their histopathologically defined morphology, indicating a correlation between gene expression and the histological classification, such as morphology and grading of the tumor samples.
A Subset of Genes is Significantly De-Regulated in Primary Tumors and Metastases versus Normal Colon Tissue
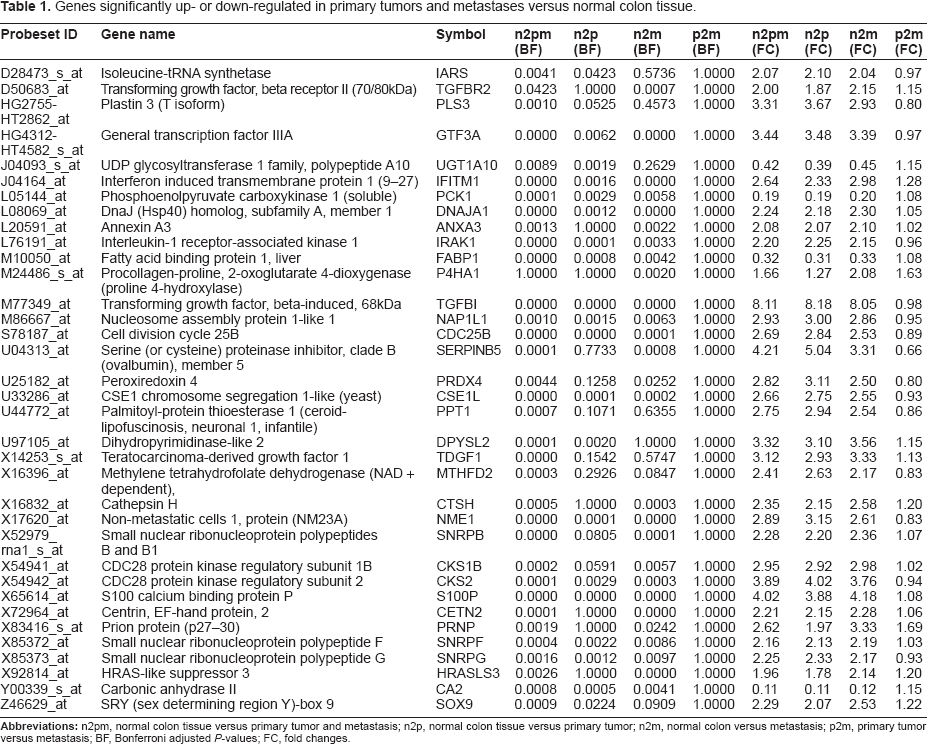
Fold changes (FC) and Bonferroni adjusted P-values (BF) were calculated between normal colon epithelium (n), primary tumors (p), metastases (m) and cancerous tissues containing both primary tumors and metastases (pm). 35 genes with P-values <0.005 and fold changes either >2 (overexpressed) or <0.5 (downregulated) were selected (see Table 1). According to these criteria only four genes (J04093: UDP glycosyltransferase 1, L05144: phospoenol pyruvate carboxykinase, M10050: fatty acid binding protein 1 and Y00339: carbonic anhydrase II) were down regulated in primary tumors and/or metastases. Most of the genes were overexpressed in the combined group of primary tumors and metastasis and only three genes (D50683: transforming growth factor beta receptor II, M24486: proline 4-hydroxylase (alpha polypeptide I), X92814: HRAS-like suppressor 3) were identified as elevated in metastases. However, no gene was identified as significantly deregulated between primary tumors and metastases. Thioredoxin-Peroxidase (PRDX4), showing high expression in most primary colon cancer as well as in metastases, was selected for a more detailed characterization.
Genes significantly up- or down-regulated in primary tumors and metastases versus normal colon tissue.
Characterization of PRDX4 Expression
E-Nothern blot analysis of PRDX4 using GeneChip® expression data from a proprietary expression database showed moderate expression in liver, endothelial cells, lymph nodes, stomach and testis, but high expression of PRDX4 mRNA in pancreas. Many cancerous tissues analyzed showed in comparison to the corresponding normal tissue overexpression of PRDX4 (data not shown).
To investigate PRDX4 mRNA expression on tissue sections of different cancerous tissues and corresponding normal tissues, RNA In Situ Hybridization (ISH) on multiple tissue arrays was performed. PRDX4 mRNA staining indicated a high expression of PRDX4 mRNA in colon adenocarcinoma (Fig. 2A) with strong restriction to epithelial cells. However, no expression of PRDX4 mRNA was detected in normal colon tissues (Fig. 2B). In addition, PRDX4 mRNA expression was detected in a mucinous ovarian adenocarcinoma, as well as in several cancers of the gastrointestinal tract such as in a well differentiated stomach adenocarcinoma and in a lymph node metastasis of a stomach adenocarcinoma (Fig. 2A). PRDX4 mRNA is also expressed in normal tissues of the gastrointestinal tract such as stomach and pancreas, but expression is absent in lymph node (Fig. 2B), bronchus, heart, lung, spleen and skin (data not shown).
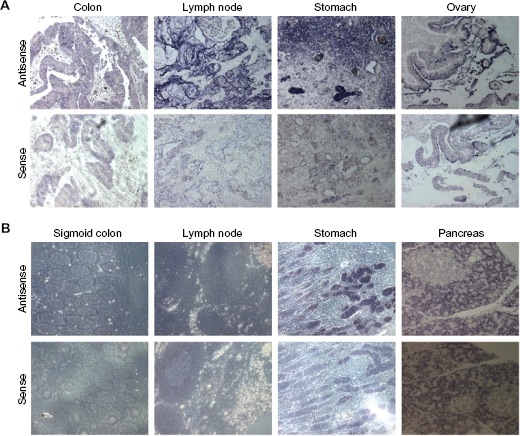
In Situ Hybridisation (ISH) with PRDX4 on multiple tissue arrays. A) ISH of the following tumor tissues with either PRDX4 antisense probe or PRDX4 sense probe as control: colon (adenocarcinoma), lymph node (metastatic adenocarcinoma from stomach), stomach (adenocarcinoma, well differentiated), ovary (mucinous adenocarcinoma). B) ISH of the following normal tissues: sigmoid colon, lymph node, stomach and pancreas. Strong background signals have been observed in pancreas with the sense probe (note: High enzyme activities such as RNAse H may influence RNA stability in this tissue). All pictures are shown with 20× enlargement.
We also raised antisera against synthetic peptides of Prdx4 in rabbits (Gramsch Laboratories, Munich) for Prdx4 protein detection. The specificity of antisera against the peptide ranging from AA 133–344 was demonstrated by peptide blocking in Western blot assay with pre-incubation of serum with the peptide in a ratio of 1:250 that resulted in the disappearance of the 25 kDa band (Fig. 3B). The functionality of the polyclonal antibodies was shown by using ASPC-1 cells transiently transfected with a Prdx4-expression-plasmid, resulting in increased protein levels (data not shown).
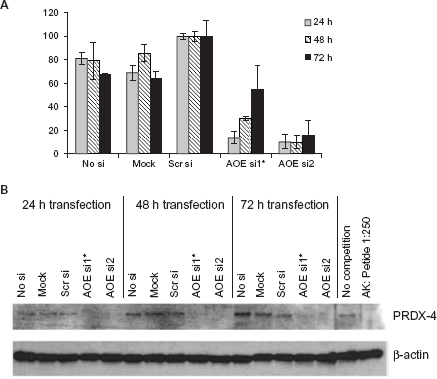
Determination of mRNA and protein expression in HCT116 cells upon RNA interference of PRDX4. HCT116 cells were mock transfected, transfected with scrambled siRNA (scrsi) or with siRNAs of PRDX4 (AOEsi1 and 2) for 24 h, 48 h or 72 h (*Indicates fluorescein-labeled siRNA). A) Total RNA was isolated for quantitative RT-PCR to monitor the downregulation of PRDX4 mRNA. Experiments were done in triplicates. B) Protein isolation to determine protein levels of Prdx4 and β-actin as a control by Western analysis. The specificity of purified Prdx4 serum was demonstrated by peptide blocking of antibodies in a ratio of 1:250.
Downregulation of Prdx4 Leads to Apoptosis Induction in HeLa and HCT116 Cells
We next investigated the functional impact of PRDX4 loss-of-function on cell viability by using RNA interference. Three different siRNA duplexes (AOEsil, AOEsi2 and AOEsiQ) and a scrambled siRNA without homology to any known gene or EST as a negative control (scrsi) were generated and tested in HeLa (cervix carcinoma) and HCT116 (colon cancer) cells. In HCT-116 cells, PRDX4 was downregulated to approximately 10%–50% with AOEsi1 and AOEsi2 on the mRNA level, depending on siRNA duplex and time after transfection (Fig. 3A), whereas a complete downregulation was observed on the protein level (Fig. 3B). Interestingly, the levels and kinetics of mRNA knock down or reactivation of mRNA after AOEsi1 and AOEsi2 treatment seem to be different between both siRNA constructs (Fig. 3A), as measured with Real Time PCR. However, both siRNAs equally downregulate the PRDX-4 protein as determined by Western analysis (Fig. 3B). As protein translation is delayed to mRNA expression, the protein level might stay low for a prolonged period of time, while mRNA levels already increase due to diminishing effects of siRNAs.
In HeLa cells mRNA expression was downregulated to approximately 40% with AOEsi1, AOEsi2 and AOEsiQ compared to controls. Prdx4 protein expression disappeared nearly completely in HeLa cells transfected with AOEsil, AOEsi2 and AOEsiQ (data not shown).
As a consequence of Prdx4 downregulation a decline in cell viability was observed. Effects on apoptosis upon downregulation of Prdx4 were demonstrated with an ELISA assay in HCT-116 cells that resulted in increasing numbers of apoptotic cells when transfected with AOEsil or AOEsiQ (Fig. 4A). Similar effects were observed in HeLa cells (see supplementary file, Fig. Sl).
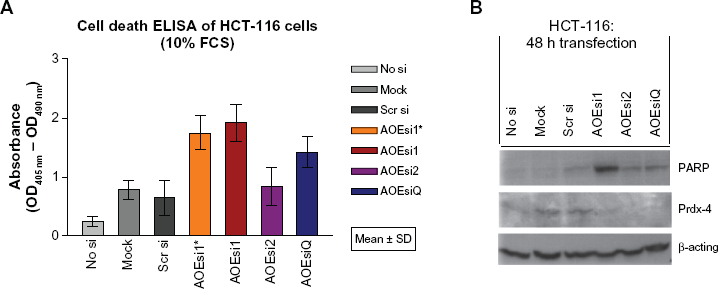
Cell death ELISA and PARP cleavage assay for the detection of apoptosis. HCT-116 cells were either mock transfected, transfected with scrambled siRNA (scrsi) or with siRNAs of PRDX4 (AOEsi 1 and 2) for 48 h (*indicates fluorescein-labeled siRNA). A) Detection of apoptosis in cell lysates was performed in biological triplicates by using the Cell Death Detection ELISAPLUS assay, which is a quantitative sandwich-enzyme-immunoassay for the in vitro determination of histone-associated-DNA-fragments accumulating in the cytoplasm of apoptotic cells. B) Levels of cleaved PARP (Poly (ADP-Ribose) Polymerase) were detected in cell lysates by Western blotting.26,27 The antibody used in this study specifically recognizes the 85 kDa fragment.
Induction of apoptosis was also investigated by monitoring PARP (Poly (ADP-Ribose) Polymerase) cleavage26,27 on Western blot assays. HCT-116 cells transfected with AOEsil showed a strong band of cleaved PARP and a moderate signal of cleaved PARP when transfected with AOEsi2 or AOEsiQ, respectively, while control siRNAs did not yield significant induction of cleaved PARP (Fig. 4B).
In addition, FACS-analysis following down-regulation of Prdx4 was performed in HCT-116 cells. An increase of FITC signal was observed after transfection with AOEsil for 48 h in comparison to control cells (scr-si), thus reflecting an increase in the number of apoptotic cells (see supplementary file, Fig. S2).
Hif-1α Levels are Decreased upon Downregulation of PRDX4 under Hypoxic Conditions
It has been reported that stable transfection of cells with thioredoxin (Trx-1) significantly increases Hif-1α protein expression as well as hypoxia-responsive gene products, such as VEGF, under both normoxic and hypoxic conditions. 12 Because of this putative link between expression of Prdx4, which is an upstream member of Trx, and Hif-lα levels, it was of interest to investigate, whether Hif-1α expression under hypoxic conditions is decreased upon down-regulation of Prdx4. For this purpose HeLa cells were transfected either with AOEsil or AOEsi2 and incubated first under normoxic conditions (48 h) and then under either hypoxic or normoxic conditions (l6 h), followed by cytoplasmic and nuclear extraction of proteins. Western blot analysis, with cells kept under hypoxic conditions indicated a specific effect of Prdx4 knockdown, resulting in decreased Prdx4 levels in the cytoplasmic fraction, as well as decreased expression of Hif-1α in the nucleus compared to cells transfected with the unspecific control siRNA (Fig. 5). The strongest decrease of Hif-lα was observed upon down-regulation of Prdx4 with AOEsi2. In contrast, Hif-lα was not detected under normoxic conditions.
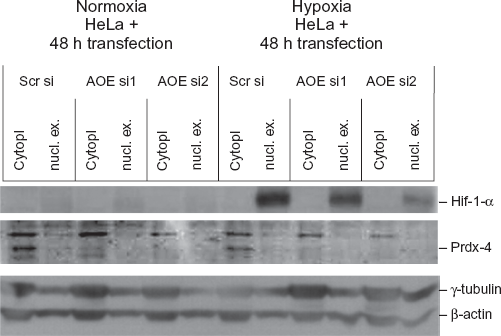
Down-regulation of Hif-1α in HeLa cells transfected with PRDX4 siRNAS under normoxic and hypoxic conditions. HeLa cells were transfected with scrambled siRNA (scrsi) or with siRNAS of PRDX4 (AOEsi1 and 2) for 48 h and then incubated under either normoxic or hypoxic conditions for additional 16 h. Protein levels of Hif-1α, Prdx4, γ-tubulin and β-actin were determined in nuclear extracts and cytoplasmatic fractions by Western blotting.
Discussion
A number of studies have been performed comparing primary colorectal tumors with metastases and/or with normal mucosa (reviewed by Nannini et al. 28 ).
The advantage of this study is based on the utilization of laser capture microdissection (LCM) in combination with microarrays to perform transcription profiling of twelve colon cancer patients representing five normal colon epithelia, eleven primary tumors, eight lymph node metastases and two liver metastases. In addition, four colon cancer cell lines derived from the same patient collection were included as well. Subsequent hierarchical clustering of genes with significant variation of expression clearly separated primary and secondary tumors from normal tissues as well as from cell lines, while replicates from identical parts of cancerous tissue cluster tightly together. The separation of cell lines on the dendrogram from the tumors, from which they were derived, can be explained partly by taking into account that only a particular subset of cells were clonally selected during generation of the cell lines, and that alterations in microenvironmental growth conditions lead to changes in gene expression in vitro. The most interesting observation from hierarchical clustering was demonstrated by the alignment of the dendrogram with the corresponding hematoxylin/eosin (H/E)-stained tissue sections. In most cases, a patient-specific clustering between primary tumors and their metastases is observed. Moreover, primary tumors and metastases derived from different patients, but with similar histopathological characteristics such as grading and morphology, form a distinct cluster, indicating that gene expression data reflect the histopathology of the colon cancer samples such as morphological appearance and grading. A limitation of this study is clearly the small sample size and thus the number of representatives for each of the morphological subgroups. Despite these limitations, other studies with different sample sets come to similar conclusions. A correlation of gene expression with the histopathological classification was also found within an expression profiling study on 25 colorectal carcinomas, corresponding normal colonic mucosa and l4 liver metastases using cDNA arrays. 29 Further support for linking gene expression with histopathology of cancer comes from the recent finding that early and late stages of thymoma correlate with stage-specific gene expression. 30 In addition, comparison between five micro-dissected normal and cancerous oral epithelial tissues showed a distinct clustering of the normal samples. 31 The authors
hypothesized that there might be a tight subclustering of some tumor samples reflecting a specific developmental stage of oral cancer. In addition to a tight clustering of normal colon tissues, we were also able to demonstrate a clustering of tumors and metastases according to their histopathological characteristics. In particular, tumors and their corresponding metastasis cluster together, indicating a unique gene expression profile for individual tumors, whose characteristic transcriptional fingerprint is retained throughout metastasis. Our results with colon cancer are in line with the previously reported similarity observed between primary breast carcinoma and distant metastases of the same patient, revealed by gene expression profiling of eight pairs of primary breast carcinoma and their matching distant metastases. 32 Consequently, the authors conclude that the metastatic capability is an inherent feature and is not based on clonal selection.
We identified 35 genes that were deregulated in either one or both analyzed tumor stages compared to normal colon epithelium. Only four (ll%) of these genes (J04093, L05l44, Ml0050 and Y00339) were down-regulated in primary tumors and/or metastases, whereas 3l genes (89%) were overexpressed. Three of these genes (D50683, M24486, X92814) showed highest expression in metastases (10%) and the remaining genes were up-regulated in both tumor stages. Interestingly, no gene was identified as significantly deregulated when comparing primary tumors and metastases. This finding is in accordance with the observation obtained from the hierarchical cluster analysis, namely that the primary tumor and its metastasis of the same patient are more similar than primary tumors or metastases from different patients. Interestingly, and consistent with our observations, Weigelt et al. 32 reported that gene expression profiles of primary breast tumors are maintained in distant metastases, with no evidence for common pathways for metastases in these tumors. Our data support the hypothesis that metastatic capability in colon cancer is an inherent feature and is not based on clonal selection.
PRDX4 was identified in our microarray study of microdissected tissues from colon cancer patients as highly expressed in most primary tumors and their metastases compared to normal tissues (2.8 fold, P-value: 0.0044). More recently, Prdx4 was reported as highly expressed in human non small cell lung cancer (NSCLC)33,34 and as a biomarker for prostate cancer 35 as well as for glioblastoma multiforme 36 using proteomic approaches, as well as in a screen for genes involved in cell defense system using cDNA microarrays. 37 In FISH, cytogenetic and molecular studies, PRDX4 has been shown to be translocated in patients with acute myeloid leukemia (t(X,2l)) (p22;q22) 38 and in acute lymphoblastic leukemia (t(X;l8)(p23;q23)). 39 Giguere et al. 40 found for the first time an interaction between thromboxane A2 receptor that is involved in oxidative stress and Prdx4 activity.
Our e-Northern blot data extracted from a proprietary expression data base (data not shown) confirmed the overexpression of PRDX4 in colon adenocarcinoma. PRDX4 mRNA expression is generally found to be overexpressed in most cancerous tissues thus implicating an essential role of PRDX4 in tumorigenesis. In accordance with this finding expression studies of lung adenocarcinoma 33 and malignant breast cancer 42 have shown, that PRDX4 is overexpressed in these tumors. In normal tissues we observed highest expression of PRDX4 in pancreas. Okado-Matsumoto et al. 43 reported that Prdx4 is secreted into the extracellular space.
In situ Hybridization (ISH) on Multiple Tissue Arrays (MTA) indicated an overexpression of PRDX4 mRNA in colon adenocarcinoma versus normal colon tissues and furthermore, showed that PRDX4 expression is restricted to the epithelial cells. As mRNA expression indicates maintenance of the gene expression pattern between the primary tumor and distal metastasis, it would be interesting to see whether ISH analysis supports this conclusion. However, the commercial multiple tissue arrays used here did not contain liver metastasis of colon cancer.
By ISH PRDX4 mRNA expression was also found in cancers of the gastrointestinal tract such as adenocarcinoma of stomach, gall bladder and pancreas as well as in normal tissues thereof (eg, duodenum, stomach, pancreas and small bowel). This suggested that Prdx4 might preferentially act in the gastrointestinal tract, which would further be reasonable since reactive oxygen species (ROS) are also metabolic byproducts of food uptake. 44 ISH confirmed no or only low expression of PRDX4 in several other normal tissues like heart, lung, spleen and skin. In general, mRNA expression data detected by ISH are similar to e-Northern blot data. However, particular differences may be due to either variation in quality of tissues or variations among histopathological defined subtypes of tumors.
Aberrant increase of H2O2 levels can trigger apoptosis.4,45 In the presence of H2O2 activated NF-κB upregulates death effector genes such as p53 leading to H2O2 elicited apoptosis. 46 Through its functions as a regulatory factor for the transcription factor NF-κB, which can be activated by oxidative stress, PRDX4 may prevent H2O2-induced activation of NF-κB by reducing H2O2 6 The family member PrxII was shown to be a potent inhibitor of apoptosis and thereby likely functions upstream of Bcl-2. 3 Accordingly our RNAi experiments have shown an increased rate of apoptotic cells upon downregulation of Prdx4 that is likely due to decreased capability of the cells to reduce H2O2 below a critical level. Detection of induction of apoptosis upon RNA interference by three different methods showed significant effects in the colon cancer cell line HCT-116. Similar experiments performed on HeLa cells indicated as well apoptosis induced by down-regulation of PRDX4. Another important observation is that our efforts to generate stable ASPC-1 cell clones overexpressing Prdx4 remained unsuccessful (data not shown). A similar feature has already been reported 4 , suggesting that it is difficult to overexpress antioxidant proteins at very high levels, probably because of the requirement for H2O2 in normal cell functions, since low levels of H2O2 regulate physiological processes, including cell proliferation.
Here we have not demonstrated whether cells under increased H2O2 conditions and depletion of PRDX4 show increased apoptosis. But in an experiment performed by Okado-Matsumato, 43 HUVEC cells were incubated with various concentrations of H2O2 in the absence or presence of PRDX4. The presence of DTT-treated PRDX4 significantly protected the cells against the cytotoxicity of H2O2. We have however, investigated whether low serum concentration or addition of IFN-γ would sensitize HCT-116 cells for apoptosis. Nevertheless, the results show no further induction of apoptosis (data not shown). Our findings that downregulation of PRDX4 leads to increased apoptosis are in line with a recent study of Wang et al. 11 where it was shown that overexpression of PRDX4 dramatically suppressed TRAIL-induced apoptosis. Wang et al. 11 suggested that TRAIL suppressed the PRDX4 gene at the transcriptional level and that downregulation of PRDX4 might facilitate cell death induced by TRAIL. Therefore our primary goal was to identify whether the PRDX4 downregulation directly has an effect on apoptosis.
Also of further interest, but going beyond the scope of this study, would be the examination of cell senescence after PRDX4 downregulation. In HCT-116 cells the mTOR pathway is activated via mutation in the PI3K-pathway that promotes proliferation and survival under normal conditions, but mTOR could promote senescence, if the cell cycle is blocked. 47 This could be done by monitoring the expression of p2l, as upregulation of p2l is associated with cell senescence, or by investigation of mTOR dependent markers.
In addition to its proposed role in apoptosis, Prdx4 seems to be involved in regulation of Hif-lα. It has been reported that stable transfection of thioredoxin (Trx-1) significantly increases Hif-1α protein levels as well as protein products of hypoxia-responsive genes such as VEGF under both normoxic and hypoxic conditions.l2 This indicates a link between Prdx4 and Hif-1α expression that would be of interest, since Hif-1α activates the transcription of genes involved in crucial steps of carcinogenesis including angiogenesis, cell survival, glucose metabolism, and invasion. 48
Semenza 49 suggested that the oxygen signal, which modulates the expression of Hif-1α and its transcriptional activity is converted to a redox signal. Thus, also the secondary consequences of changes in oxygen concentration, such as alteration of intracellular redox potentials or the amount of ROS may influence Hif induction. It was known from previous experiments (not shown) that among other cell lines, HeLa cells show increased expression of Hif-1α upon incubation under hypoxic conditions. We therefore investigated in HeLa cells whether depletion of Prdx4 has any impact on Hif-lα regulation. Indeed, downregulation of Prdx4 in HeLa cells grown under hypoxic conditions led to a downregulation of Hif-lα protein levels in nuclear extracts, suggesting that Prdx4 regulates Hif-lα protein expression. Although this study proposes an implication of Prdx4 in the Hif-1α pathway, more detailed investigations are necessary. Of interest would also be whether tumors with a loss-of-function mutation in IDH1 and that are deficient to degrade Hif-1α, 41 would be more sensitive upon Prdx4 inhibition. Furthermore, it should be analyzed whether the potential regulation of Hif-lα expression by Prdx4 is either due to direct interaction with thioredoxin or via changes in H2O2 levels. Taken together, transfection experiments with siRNAs of Prdx4 suggest that downregulation of Prdx4 leads to increased apoptosis and to a decrease in Hif-lα protein expression.
Disclosures
This manuscript has been read and approved by all authors. This paper is unique and not under consideration by any other publication and has not been published elsewhere. The authors and peer reviewers report no conflicts of interest. The authors confirm that they have permission to reproduce any copyrighted material.
Supplementary Material
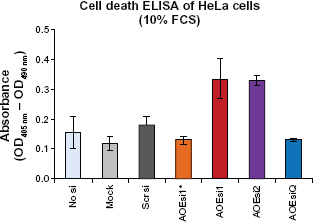
Cell death ELISA for the detection of apoptosis. HeLA cells were either mock transfected, transfected with scrambled siRNA (scrsi) or with siRNAs of PRDX4 (AOEsi1 and 2) for 48 h (*Indicates fluorescein-labeled siRNA). Detection of apoptosis in cell lysates was performed in triplicates by using the Cell Death Detection ELISAPLUS assay, which is a quantitative sandwich-enzyme-immunoassay for the in vitro determination of histone-associated-DNA-fragments accumulating in the cytoplasm of apoptotic cells. A significant P-value of P < 0.05 was obtained for AOEsi2 (P = 0.022) as compared with scrsi.
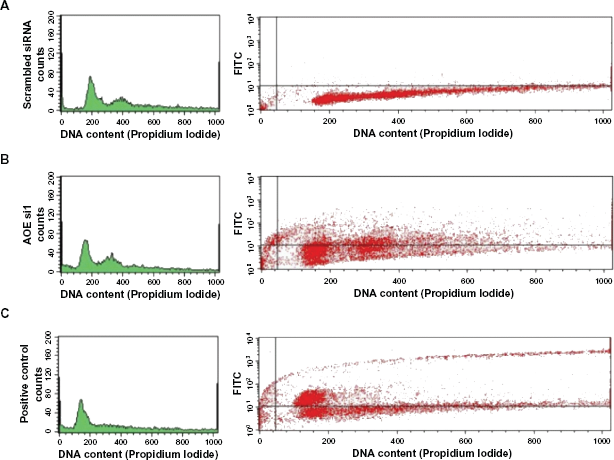
FACS-Analysis of HCT-116 cells transfected with siRNAs of PRDX4 for detection of apoptotic cells.
Materials and Methods
FACS-Analysis
Trypsinized cells pooled with the culture supernatant and PBS wash solution were centrifuged at 200 × g and 4 °C for 5 min and pelleted cells were washed twice with PBS. 10e6 cells were fixed with paraformaldehyde (16% paraformaldehyde stock solution from Electron Microscopy Sciences) and stained with the Apo-Direct™ Apoptosis Detection Kit (eBioscience, San Diego, CA) as recommended. FACS measurement was performed on FACSCalibur™ (Becton Dickinson) using the software CellQuest.
Footnotes
Acknowledgements
We thank Roland M. Varecka and Sandra Stöckel, for excellent technical assistance and Horst Ahorn for peptide synthesis. We are grateful to Gudrun Meinhardt and Martin Knöfler for making ISH studies possible, to Kurt Zatloukal (University of Graz, Austria) for generously providing the colon cancer samples and to Beatrix Vécsey-Semjén for providing the cell lines generated from colon cancer patients. We would also like to thank Klaus K. Wilgenbus and Hartmut Beug for helpful discussions. This work was supported by the “Austrian Genome Research Program GEN-AU” (GENome Research in AUstria) from the Austrian Federal Ministry for Education, Science and Culture.