Efficacies, toxicities, and resistance mechanisms of chemotherapy drugs, such as oxaliplatin and 5-fluorouracil (5-FU), vary widely among various categories and subcategories of colon cancers. By understanding the differences in the drug efficacy and resistance at the level of protein–protein networks, we identified the correlation between the drug activity of oxaliplatin/5-FU and gene variations from the US National Cancer Institute-60 human cancer cell lines. The activity of either of these drugs is correlated with specific amino acid variant(s) of KRAS and other genes from the signaling pathways of colon cancer progression. We also discovered that the activity of a non-DNA-binding novel platinum drug, phosphaplatin, is comparable with oxaliplatin and 5-FU when it was tested against colon cancer cell lines. Our strategy that combines the knowledge from pharmacogenomics across cell lines with the molecular information from specific cancer cells is beneficial for predicting the outcome of a possible combination therapy for personalized treatment.
Colon cancer is a common malignancy in all countries including the United States.1 This disease is the fourth leading cause of cancer deaths worldwide. Colon cancer results from the accumulation of multiple genetic and epigenetic modifications, leading to the transformation of colon epithelial cells into invasive adenocarcinomas.2 The lack of response in many cancer treatments emphasizes the importance of personalized therapy to improve the patient outcomes. In this study, by integrating the knowledge from cell line pharmacogenomics with molecular information of cancer cells, we revealed a new effective diagnostics of colon cancers for personalized treatment where the gene variants are classified by their functional impact on signaling pathways related to colon cancer progression and efficacies toward the chemotherapy drugs.
For years, one of the cornerstones of colon cancer treatment has been chemotherapy. Platinum (Pt)-based chemotherapeutic anticancer drugs such as cisplatin, carboplatin, and oxaliplatin are widely used to treat various cancers, including colon cancer. In particular, for colon cancer, antimetabolite chemotherapy drug 5-fluorouracil (5-FU) has been the treatment of choice for decades, until randomized trials established the superiority of combination therapy with oxaliplatin in most clinical situations.3,4 It is commonly believed that DNA is the molecular target for these chemotherapies resulting in inhibited transcription. The exact, synergistic mechanism between oxaliplatin and 5-FU is complex, but experimental observations indicated that oxaliplatin can downregulate or inhibit dihydropyrimidine dehydrogenase, slowing down the catabolism of 5-FU.5 One of the major problems encountered in clinical practice with chemotherapeutic drugs is the development of drug resistance. In many cases, resistance to chemotherapy takes place before drug treatment (inherent resistance), and in others, resistance arises during treatment (acquired resistance).6 Knowledge of the various resistance mechanisms6 has led to the development of new drugs that can be specifically targeted. However, these new drugs suffer from a substantial failure rate and from toxicity.7 Efforts to overcome resistance to chemotherapy have been so far largely unsuccessful because of the ambiguous inter- and intratumor heterogeneity and complex biology of cancer cells with wide individual variations.8 Trans-1,2-cyclohexanediamine (pyrophosphato) Pt (II) phosphaplatin (PT-112) is a newly discovered non-DNA-binding Pt compound9 and currently undergoing phase I clinical trial (ClinicalTrials.gov Identifier: NCT02266745). PT-112 exhibited excellent physiochemical properties with lesser cytotoxicity and reduced resistance compared with other Pt-based drugs9,10 and may represent an alternative to the other chemotherapy drugs in the fight against cancer heterogeneity.
Not all cancers are created equal. Colon cancer tumorigenesis was first described as a multistep process from the accumulation of tumor suppressor genes (TSGs) and oncogene mutations involving adenomatous polyposis coli (APC), tumor protein 53 (TP53), and Kirsten rat sarcoma viral oncogene homolog (KRAS).11 However, this hypothesis offered a restricted repertoire of genetic alterations. Recently, there have been major advances in understanding the multiple molecular pathways for colon cancer pathogenesis that consists of cytogenetic or epigenetic events.12 For the cytogenetic events, the most analyzed events are microsatellite instability, chromosomal instability, and CpG island methylator phenotype. For the epigenetic alteration, the most studied mechanisms are DNA methylation, modifications in histone proteins, and microRNAs.2,12,13 The new view of colon cancer development is the accumulation of genetic abnormalities, through mutations and genomic instabilities, as well as epigenetic alterations.14
Nonetheless, in the case of mutations, frequently mutated genes, beyond what would be predicted by chance, or have mutations that cluster in key amino acid (AA) residues or functional protein domains, convincingly demonstrate that these genes are pivotal to cancer development.15 For instance, the mutation of TSGs APC (Wnt pathway controlling gene) and TP53 (genome integrity pathway controlling gene) and oncogene KRAS (mitogen-activated protein kinases [MAPK]-signaling pathway controlling gene) is critical11 in colon cancer development and progression. In particular, the KRAS gene is mutated in 30%–50% of colon cancer tumors.16,17 Therefore, instead of treating all mutations in the same way to determine their clinical significance, it is more advantageous to categorize them into distinctive classes based on their functional impact (eg, gain-of-function of the oncogenes or loss-of-function of the TSG) on the cellular network and responses to drugs.18,19
In this study, we established an integrated cancer informatics approach to assess the impact of genetic mutations on protein functions, signaling pathways, and drug activity (ie, sensitivity or insensitivity) based on the z-scores from GI50 values (ie, drug concentration required to inhibit tumor growth by 50%) among the US National Cancer Institute-60 (NCI-60) human tumor cell lines to predict a priori treatment outcome using CellMiner.20 We particularly focused on NCI-60 colon cancer cell line treatments with oxaliplatin or 5-FU to identify the molecular patterns of drug activity, which is analogous to selecting therapy based on the basal characteristics of patient tumors and predicting response. By establishing the pharmacogenomic correlation between the drug activity and genetic variants of the colon cancer cell lines, we identified five independent signaling pathways associated with the cancer progression (including the epidermal growth factor receptor [EGFR] network). We concluded that cancer treatment decisions would benefit from combining the information of AA variants (nonsynonymous mutations) of the genes, signaling pathways, and drug activity for personalized treatment, which to date has largely been overlooked.
Results
Gene Selection and Mutation across the NCI-60 Colon Cancer Cell Lines
We found that the number of genetic mutations across the NCI-60 colon cancer cell lines varies significantly, from a few hundred to several thousand (Supplementary Table 1). The COLO_205 cell line has a total of 137 genetic mutations. In contrast, the HCC_2998 cell line consists of a total of 5,079 genetic mutations. We identified the important mutations across colon cancer cell lines by combing 127 significantly mutated genes (SMG) across 12 major cancer types from The Cancer Genome Atlas (TCGA) Pan-Cancer21 along with the 125 driver genes with subtle mutations from the Catalogue of Somatic Mutations in Cancer (COSMIC; the 125 driver genes contain 71 TSG and 54 oncogenes).22 As a result, we identified a total of 188 unique genes (Supplementary Fig. 1). Among these 188 unique genes, we uncovered the percentage of allele frequency of AA variants (nonsynonymous mutation) among the exome sequencing data (see the “Methods” section) using CellMiner.20,23 Twenty-eight genes present no AA variants across the NCI-60 cell lines, while the remaining 160 genes do. Our analysis focuses on these 160 genes.
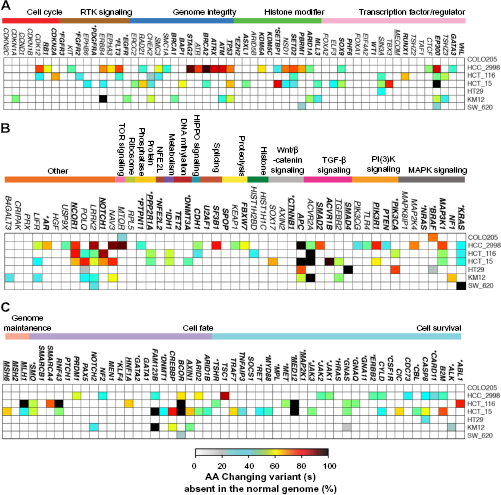
Nonsynonymous variants of 160 genes across the NCI-60 colon cancer cell lines. Variant percentages for a single gene for each cell line are calculated based on all AA variants present, using the percentage presence of each variant (see the “Methods” section). The 58 and 49 genes were grouped in different signaling pathways following Ref. 21 in (A) and (B), respectively. The 63 genes in (C) were grouped in different cellular processes following Ref. 22 The driver genes (oncogenes and TSG) are shown in bold letters and also listed in Supplementary Table 5 Asterisks symbols indicate the oncogenes. The genes related to the progression of colon cancer from KEGG pathway (see the “Methods” section) are underlined.
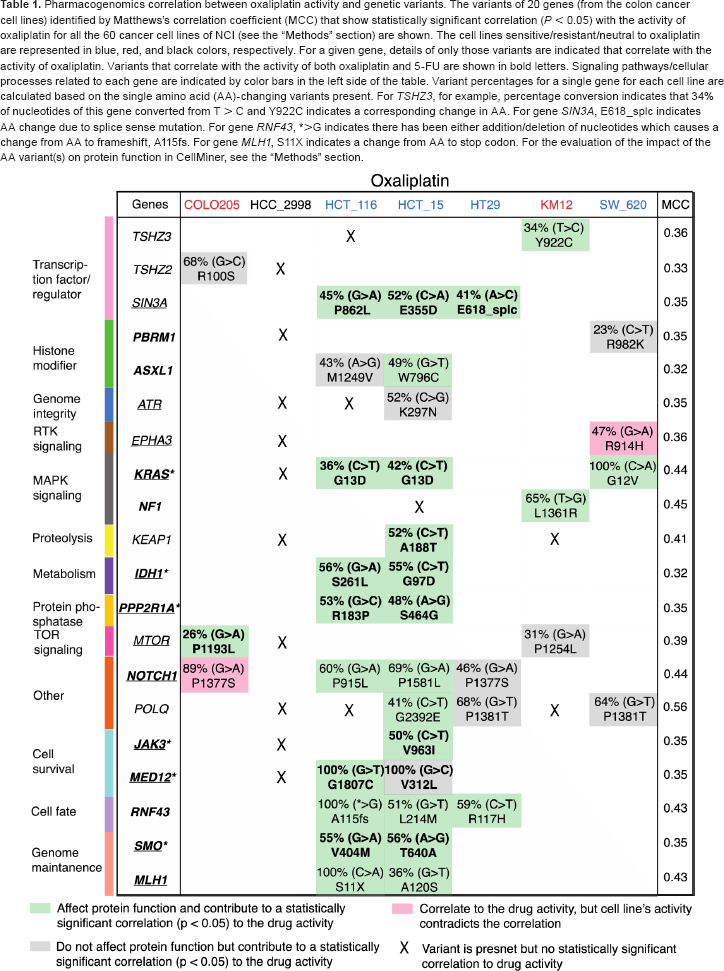
Pharmacogenomics correlation between oxaliplatin activity and genetic variants. The variants of 20 genes (from the colon cancer cell lines) identified by Matthews's correlation coefficient (MCC) that show statistically significant correlation (P < 0.05) with the activity of oxaliplatin for all the 60 cancer cell lines of NCI (see the “Methods” section) are shown. The cell lines sensitive/resistant/neutral to oxaliplatin are represented in blue, red, and black colors, respectively. For a given gene, details of only those variants are indicated that correlate with the activity of oxaliplatin. Variants that correlate with the activity of both oxaliplatin and 5-FU are shown in bold letters. Signaling pathways/cellular processes related to each gene are indicated by color bars in the left side of the table. Variant percentages for a single gene for each cell line are calculated based on the single amino acid (AA)-changing variants present. For TSHZ3, for example, percentage conversion indicates that 34% of nucleotides of this gene converted from T > C and Y922C indicates a corresponding change in AA. For gene SIN3A, E618_splc indicates AA change due to splice sense mutation. For gene RNF43, *>G indicates there has been either addition/deletion of nucleotides which causes a change from AA to frameshift, A115fs. For gene MLH1, S11X indicates a change from AA to stop codon. For the evaluation of the impact of the AA variant(s) on protein function in CellMiner, see the “Methods” section.
We noticed that for the two most heavily mutated colon cancer cell lines, HCC_2998 and HCT_15 (Supplementary Table 1), the genome integrity genes TP53, ATM, ATRX, BRCA2, and ATR show high percentage (>60%) of AA variant(s) (Supplementary Fig. 1A). For HCC_2998, we noted that all the genes from phosphoinositide 3-kinase (PI(3)K) signaling pathway have AA variant(s). Other genes such as LRKK2, POLQ, and NCOR1 have AA variant(s) across the cell lines HCC_2998, HCT_116, and HCT_15 (Fig. 1B) that are heavily mutated (Supplementary Table 1). Specifically, POLQ has variant(s) across all the colon cancer cell lines, except COLO205 that has the lowest number of mutated genes (Supplementary Table 1). For cell line HCT_15, several driver genes from cell survival (ALK, B2M, CASP8, MED12) and cell fate (BCOR, CREBBP, FAM123B) processes have high percentage of AA variants.
Figure 2A–C shows the AA variants among the 160 genes that are deleterious to cell function and absent from noncancerous genomes (see the “Methods” section). We found that the transcription activator EP300 driver gene, which plays an essential role in regulating cell division and preventing the growth of cancerous tumors, is mutated in five out of the seven cell lines (Fig. 2A). In addition, we found that protein function affecting AA variants of gatekeeper gene APC, TSG TP53, and oncogene KRAS are present in both HCC_2998 and HCT_15 (Fig. 2B). Notably, these two cell lines do not contain any protein function affecting variants for PIK3CA and SMAD4 genes (Fig. 2B). Interestingly for the CTNNB1 gene, AA variants are also present in these two cell lines (Fig. 1B), but none of these variants are deleterious (Fig. 2B), suggesting that these mutations could also be present in normal genes, and thus may not be harmful and do not affect the protein function. Variant percentages of rest of the driver genes in the colon cancer cell lines are shown in Figure 2C.
Nonsynonymous variants of 160 genes across the NCI-60 colon cancer cell lines that affect protein function (proposed to be deleterious and not present in the normal genomes; see the “Methods” section). For different representation of the 160 genes and classification of the genes in different signaling pathways and cellular processes see the description of Figure 1
Efficacy of Pt- and Non-Pt-Based Drugs in Colon Cancer Cell Lines
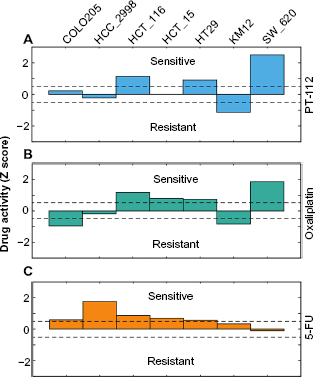
We compared the efficacy of the Pt-based drugs, such as PT-112, oxaliplatin, cisplatin, and carboplatin, and the non-Pt-based drug, such as 5-FU, against the seven colon cancer cell lines from their respective z-scores (drug activity from GI50 values; see the “Methods” section). Based on the z-scores of a drug, the cell lines are categorized as sensitive (z-scores >0.5), resistant (z-scores <-0.5), or neutral (-0.5< z-scores <0.5) following the terminology used by Abaan et al.24 We found that both the Pt-based drugs, PT-112 and oxaliplatin, are sensitive to the cell lines HCT_116, HT29, and SW_620, but resistant to KM12, and neutral to HCC_2998 cell lines (Fig. 3A and B). Both the cell lines COLO205 and HCT_15 are neutral to PT-112. However, COLO205 is resistant and HCT_15 is sensitive to oxaliplatin. Unlike oxaliplatin and PT-112, cisplatin and carboplatin are not sensitive to any of the colon cancer cell lines (Supplementary Fig. 3). We also probed 5-FU, which is commonly used alone or in combination with oxaliplatin in the treatment of colon cancer. 5-FU is sensitive to all the colon cancer cell lines tested, except SW_620 for which it is neutral (Fig. 3C).
Activity of PT-112, oxaliplatin, and 5-FU across the colon cancer cell lines. The activity of PT-112 (A), oxaliplatin (B), and 5-FU (C) were obtained based on their z-scores determined from the growth inhibitory 50% (GI50) data (see the “Methods” section) across all the NCI-60 cell lines for nine different cancer types (see Supplementary Fig. 3). Cell lines with z-scores >0.5 are considered sensitive, whereas cells with z-scores <-0.5 are resistant than the average value of GI50 for all the 60 cell lines.24 When the score is between -0.5 < z-score and z-score < 0.5, the cell lines are neutral.24
Correlation between Drug Activity and Single Variants across the Colon Cancer Cell Lines
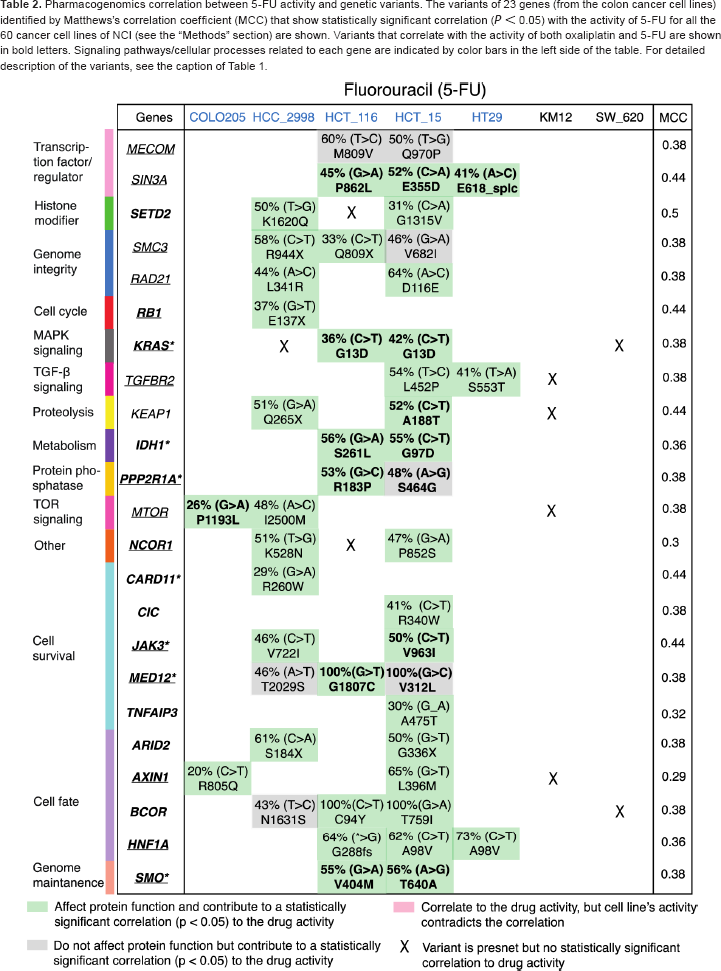
We also explored the pharmacogenomics correlation between the efficacy of the drugs and the AA variant(s) of the genes across the NCI-60 cell lines (see the “Methods” section) for both the Pt-based (oxaliplatin, cisplatin, and carboplatin) and non-Pt-based (5-FU) drugs. Similar analyses for the Pt drug PT-112 were not performed due to the unavailability of the data for NCI-60 cell lines from CellMiner. The AA variant(s) of the genes that correlate with the activity of oxaliplatin and 5-FU for the colon cancer cell lines are shown in Tables 1 and 2, respectively. Out of the 160 genes, we found 20 genes with AA variants that demonstrate statistically significant correlation (P < 0.05) with the activity (sensitivity/resistivity) of oxaliplatin (Table 1), where there are 23 genes for 5-FU (Table 2). Moreover, there are nine common genes (IDH1, KEAP1, KRAS, MTOR, PPP2R1A, SIN3A, JAK3, MED12, and SMO) for which there is, at least, one variant that correlates with the activity of both oxaliplatin and 5-FU (as indicated in bold letters in Tables 1 and 2). Specific variants of a given gene that do not correlate with the drug activity are indicated by X mark in Tables 1 and 2.
Pharmacogenomics correlation between 5-FU activity and genetic variants. The variants of 23 genes (from the colon cancer cell lines) identified by Matthews's correlation coefficient (MCC) that show statistically significant correlation (P < 0.05) with the activity of 5-FU for all the 60 cancer cell lines of NCI (see the “Methods” section) are shown. Variants that correlate with the activity of both oxaliplatin and 5-FU are shown in bold letters. Signaling pathways/cellular processes related to each gene are indicated by color bars in the left side of the table. For detailed description of the variants, see the caption of Table 1
In particular, for KRAS, it is interesting to note that the variant at codon 13D (G13D) from HCT_16 and HCT_15 cell lines and another variant at codon 12V (G12V) from SW_620 cell line are correlated with oxaliplatin activity (Table 1). However, for 5-FU, only the variant G13D of KRAS (from HCT_16 and HCT_15) is correlated with the drug activity (Table 2). Notably, 5-FU is sensitive to HCT_16 and HCT_15, but neutral to SW_620 (Fig. 3B), whereas oxaliplatin is sensitive to these three cell lines (Fig. 3A). Moreover, neither oxaliplatin nor 5-FU activity is correlated with the variant A146T of KRAS from HCC_2998 (indicated by X in Tables 1 and 2). In particular, for HCC_2998, we did not find any variant (from our list of genes) that correlates with the activity of oxaliplatin. Moreover, HCC_2998 is neutral to oxaliplatin. However, variant(s) from several genes other than KRAS are correlated with the activity of 5-FU for HCC_2998 (Table 2). Variants from other genes such as MLH1 for oxaliplatin (from HCT_116 and HCT_15) and TGFBR2 (from HCT_15 and HT29) in Table 1 together with AXIN1 (from COLO205 and HCT_15) for 5-FU in Table 2 that show correlation with drug activity are associated with colon cancer progression from Kyoto Encyclopedia of Genes and Genomes (KEGG) pathway.25 Similar analysis of cisplatin (Supplementary Table 2) and carboplatin (Supplementary Table 3) revealed that none of the AA variants of KRAS shows correlation to the activity of either of these drugs.
Signaling Pathways Related to Drug Activity in Colon Cancer
Our main goal is to identify the signaling pathways related to the efficacy of either oxaliplatin or 5-FU or the combination of both drugs to predict a priori treatment outcome for colon cancer. First, we combined the 20 genes for which their variant(s) correlate with oxaliplatin activity (Table 1) and 23 genes related to 5-FU activity (Table 2). Eliminating the nine common genes (IDH1, KEAP1, KRAS, MTOR, PPP2R1A, SIN3A, JAK3, MED12, and SMO) for which the variant(s) are correlated with the activity of both oxaliplatin and 5-FU, there are 34 unique genes (Supplementary Table 4). Next, based on the gene-variant-drug activity correlation (Tables 1 and 2) of these 34 genes and by combining that with the KEGG-pathway for colon cancer progression (see the “Methods” section) and the EGFR-related pathways26–30 (for its involvement in the development and progression of colon cancer),31 we presented signaling pathways related to the activity of oxaliplatin and 5-FU in Figure 4. We identified five independent signaling pathways: transforming growth factor-beta (TGF-β; TGFBR2), MAPK (KRAS and NF1), Janus Kinase and Signal Transducer and Activator of Transcription (JAK-STAT) (JAK3), PI(3)K-AKT-mTOR (MTOR), and Wnt (AXIN2) that result in the loss of growth inhibitory effects, cell proliferation, survival, and antiapoptosis related to the progression of colon cancer. For the abovementioned genes from each pathway, the corresponding AA variant shows a significant correlation with the activity of oxaliplatin only, for NF1, 5-FU only, for TGFBR2 and AXIN2, and both oxaliplatin and 5-FU activities for KRAS, JAK3, and MTOR (see Fig. 4). We suggest that the MAPK, JAK-STAT, and PI(3)K-AKT-mTOR pathways, which belong to the EGFR-signaling network,26 are possible targets for combination therapy using both oxaliplatin and 5-FU. Nonetheless, depending on a specific variant of a gene, a drug may or may not be effective, since all mutations are not equal, as discussed previously.
Signaling pathways related to the activity of oxaliplatin and 5-FU for colon cancer cell lines. For the NCI-60 colon cancer cell lines, the AA variants of KRAS, JAK, and MTOR correlate with the activity of both oxaliplatin and 5-FU (indicated by both blue and red dots) from MAPK, JAK-STAT, and PI(3)K–AKT–mTOR pathways, respectively (Tables 1 and 2). The AA variant of NF1 correlates with the activity of oxaliplatin only (indicated by red dot) from MAPK pathway (Table 1). The AA variants of TGFBR2 and AXIN1 correlate with the activity of 5-FU only (indicated by blue dot) from TGF-β and Wnt pathways, respectively (Table 2).
Discussion
Colon cancer is a complex disease with multiple genetic aberrations from multiple DNA variants. To determine AA variants of the genes in colon cancer, we used the NCI-60 cell lines,32 a publicly available cancer database20 with whole exome DNA sequencing data.24 The presence of many known cancer-driver genes from our analysis supports their cancer predisposing functions. For instance, concurrent mutations in gatekeeping gene such as APC and KRAS increases the number of tumor cells11 in colon cancer. In addition, mutations of other genes including PIK3CA, SMAD4, and TP53 may trigger the tumor malignancy and metastasis.11
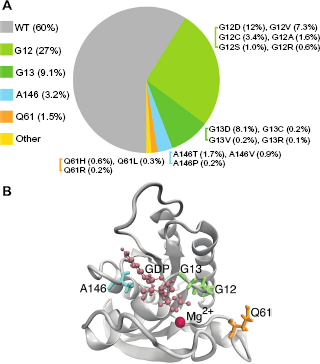
Mutated KRAS gene represents nearly 40% of the colon cancer cases dominated by several variants in codons G12 (27%) and G13 (9.1%) (Fig. 5A).33 Particularly, the variants G12D, G12V, and G13D at exons 2 are among the most common mutations of KRAS gene,34 representing 12%, 7.3%, and 8.1% colon cancer cases,33 respectively. Variants of codons G12 and G13 are particularly damaging to the enzyme activity of K-Ras protein that hydrolyzes guanosine-5'-triphosphate (GTP). The structure of K-Ras protein in Figure 5B shows that the two codons (G12 and G13) are located at the phosphate-binding loop (AA 10–16) that participates in the hydrolysis of GTPase-accelerating protein (GAP). Notably, Imamura et al.33 demonstrated that tumors with KRAS mutations in codons Q61 and A146 account for about 5% of colon cancers (Fig. 5A), and their clinicopathological and molecular features seem in general similar to KRAS codons 12 or 13 mutated cancers, suggesting that these KRAS mutations may work in concert during cancer progression.
Distribution of wild-type and mutated KRAS in colon cancer. Frequencies of KRAS mutation are based on 1,267 cases as demonstrated by Imamura et al.33 Frequencies of different mutations in the codons 12, 13, 61, and 146 are also indicated (A). The structure of GDP-bound human K-Ras protein (B). In the K-Ras protein structure (Protein Data Bank ID: 4OBE), amino acid residues G12 and G13 are shown in green, Q61 is shown in orange, and A146 is shown in cyan with licorice representation. GDP is shown in pink with ball and stick representation. Magnesium ion (Mg2+) is shown in red.
Although specific genetic changes could result in cell malignancy, it is the accumulation rather than the specific nature or temporal order of the mutations that are the most critical.35 The mutations block GAPs from supporting GTP hydrolysis by K-Ras, thus accumulating its GTP-bound active form.36 It has been demonstrated that the mutation of KRAS gene results in a constitutively active GTP-bound state and the stimulation of downstream proliferative signaling pathways,36,37 which may explain the importance of mutated KRAS gene in tumorigenesis. Human studies have suggested that the presence of a somatic KRAS gene mutation was associated with poorer statistically significant disease-free and overall survival after the diagnosis of colon cancer in patients.38,39 In fact, KRAS mutations are frequently found in up to 95% of early dysplasia and also in hyperplastic polyps.40,41 Nonetheless, it appears that KRAS mutation alone may not be sufficient or essential to drive the malignant transformation; thus, KRAS gene variant requires additional driver genes42 for malignancy. Particularly, it is the sequence that is critical in which the KRAS mutation ensues in relation to the APC mutation. If a KRAS mutation takes place after an APC mutation, the dysplastic lesion often progresses to cancer.43,44 Collectively, these observations imply that the combination of various mutations in a timely manner can lead to protein malfunction-mediated colon cancer. In addition to APC, KRAS, and TP53 gene, we found several other mutated genes from the NCI-60 colon cancer panel, including EP300, ATM, ACVRA, FAM1238, LRRK2, MAPK3K1, MD12, NOTCH, and PQLP, but only few of these genes are deleterious to cancer cell development.
Modifications in cancer genomes strongly affect clinical reactions to the treatment, and in many cases, the detrimental gene alterations may be potent biomarkers for drug response in clinical settings.45 Therefore, there is a need for the incorporation of new molecular tests into clinical practice.46 Our study based on the analysis of gene-variant-drug activity for oxaliplatin or 5-FU on the NCI-60 cell lines revealed gene networks related to colon cancer progression pathways. Nonetheless, in some instances, the activity of one of the two drugs associates with only specific AA variant(s) for a given gene. Even more significantly, we found that the activity of phosphaplatin drug (PT-112) against the NCI-60 colon cancer lines is comparable with either oxaliplatin or 5-FU. Therefore, PT-112 may be used alone or in combination with oxaliplatin or 5-FU against colon cancers. Moreover, a recent study by Bose et al.47 revealed that unlike cisplatin, PT-112 does not activate the DNA repair genes. As a result, the lack of potential DNA repair-based resistance and the engagement of the extrinsic apoptotic pathway make PT-112 attractive alternatives to Pt-based therapies that are currently in use.
Our analyses on the drug activity results revealed that oxaliplatin is sensitive to HCT_116, HCT_15, and SW_620 cell lines (Fig. 3). This may be associated, at least partially, with the AA variants of KRAS (G13D in HCT_116 and HCT_15 and G12V in SW_620 cell lines) that correlates with oxaliplatin activity (see Table 1). In particular, KRAS mutation can affect cancer-promoting protein functions of these three cell lines. In support of this premise, an in vitro study demonstrated that KRAS mutant colon cancer cells are sensitive to oxaliplatin than KRAS wild-type colon cancer cells by the mechanism of excision repair cross-complementation group 1 downregulation.48 In contrast, the cell line HCC_2998 is neutral to oxaliplatin, and the AA variant A146T of KRAS from this cell line is not correlated with oxaliplatin activity (Table 1). For the non-Pt-based drug 5-FU, we found that AA variant G13D of KRAS in the cell lines HCT_116 and HCT_15 correlates with its activity and both of these cell lines are sensitive to 5-FU. However, SW_620 is the only colon cancer cell line that is neutral to 5-FU, and at the same time, the AA variant G12V of KRAS from this cell line does not correlate with 5-FU activity (Table 2). Although the cell line HCC_2998 is sensitive to 5-FU, however, the AA variant A146T of KRAS from this cell line does not correlate with 5-FU activity (Table 2). Overall, these results emphasize that not only the percentage of variants of gene is important but also the type of mutations, depending on their impact on protein function and associated signaling pathways for the drug efficacy.
Variants of other genes such as SIN3A (a transcription factor), IDH1 (involved in cell metabolism), and SMO (a hedgehog protein) from HCT_116 and HCT_15 are also oxaliplatin and 5-FU sensitive. This finding further implies that those variants may also contribute to the effect of the drugs against the cells. Interestingly, AA variant(s) from several genes other than KRAS correlate with the activity of 5-FU for HCC_2998, implying that the sensitivity of this cell line to 5-FU may be independent of KRAS mutation. Overall, these findings support the possibility of learning genomic signatures of chemoresponse from the NCI-60 cell lines. However, the application of this knowledge to predict patient response to chemotherapy should be interpreted with caution, as gene variants may be cell specific, drug specific, or both.
Although a cancer-relevant gene/protein may appear as an attractive drug target, we showed that investigating its role in the disease-related pathways might provide a better perspective for targeted therapy with respect to better efficacy, reduced toxicity, and drug resistance. Indeed, the approach of networks became a gradually acclaimed method in drug design.49 We identified 34 uniquely mutated genes that exhibit correlation with the activity of oxaliplatin or 5-FU or both for the colon cancer cell lines. Specifically, variant(s) of some genes related to the EGFR-signaling network are correlated with the activity of oxaliplatin or 5-FU or both in the colon cancer cell lines. Therefore, we speculate that members of the EGFR-signaling network may be used as potential targets alone or together with oxaliplatin and 5-FU for colon cancer treatment.
Using the knowledge from KEGG pathway for colon cancer progression, we uncovered four mutated genes (AXIN1, KRAS, MLH1, and TGFBRII), which are associated with the activity of the drugs and belong to distinct pathways. For example, KRAS and MTOR genes, which belong to MAPK and PI(3)K-AKT–mTOR pathways respectively, correlate with the activity of both oxaliplatin and 5-FU (Fig. 4). This is consistent with laboratory findings showing that the activation of the PI(3)K-AKT–mTOR pathway resulted in drug resistance to oxaliplatin50 and 5-FU51–53 in colon cancer cell line. However, because of cellular heterogeneity, dual inhibitors combine better with 5-FU in sensitivity to PI(3)K–AKT–mTOR inhibition.54,55 In particular, PI(3)K–AKT–mTOR pathway promotes survival, development, and proliferation of cancer cells.56 Overall, the top significant biological functions related to those pathways include cell-to-cell signaling, cellular proliferation, and cell instability.57 As signaling pathway activation is a complex process, not only gene mutations but also cytokines, growth factor, and virus infection can play important roles via key molecules to cause drug resistance,58–60 and how this affects oxaliplatin and 5-FU activities remains to be investigated.
Despite the importance of our findings, our analysis has few caveats. Our study focused on the analyses of cell lines, and these cell lines do not represent all molecular types of colon cancer. We are also well aware that we may have equally overlooked lethal gene variants due to the small number of cell lines, and this may limit the amount of variants available as drug targets. However, one of the assets of our study is the use of the NCI-60 cell lines because of the high quality of the associated molecular data, which might be difficult or accurately unfeasible23 to obtain from the Cancer Cell Line Encyclopedia61 for 1,000 cancer cell lines. Another important asset this computational study offer is novel molecular detection against known drugs such as oxaliplatin and 5-FU.
Conclusion
In summary, our in silico data correlated the AA variants of colon cancer cell lines harboring 34 uniquely mutated genes with oxaliplatin and/or 5-FU activities. Our results suggest the advantage of our approach toward personalized cancer treatment, because it categorizes gene variants according to their functional impacts on the pathways of cancer progression and their correlation with drug efficacy. Subsequently, molecular networks provide clear insights into how drug target works by understanding the mechanisms of drug action. Our integrative analyses show a future direction of achieving an effective cancer therapy62 through rational therapeutic trial, by specifically targeting the malfunctioning molecules, and associated pathways for personalized treatment.
Methods
Summary of Computational Procedures Used in this Study
Figure 6 represents a flow chart showing the different analyses performed on the NCI-60 cancer cell lines (described in Supplementary Table 1) using CellMiner (NCI-60 analysis tool; database version 1.5.1; http://discover.nci.nih.gov/cellminer). Briefly, we first checked mutations in each of the 188 genes across the NCI-60 cancer cell lines. Specifically, SMGs from TCGA Pan-Cancer for 12 different cancer types21 were analyzed along with the driver genes (oncogenes and TSGs) with subtle mutations22 from COSMIC. Second, for the mutated genes specifically from the colon cancer cell lines, we identified corresponding AA variants. Third, the impact of the gene variant(s) on protein function was identified. Then, the activity (sensitivity or insensitivity) of the Pt-based drugs such as oxaliplatin, cisplatin, carboplatin along with PT-112, which is currently undergoing clinical trial, and antimetabolite chemotherapeutic drug 5-FU were obtained as a z-score based on the GI50 value of the NCI-60 cell lines. The GI50 measures the growth inhibitory power of a test drug.63 Finally, a statistically significant correlation between a single AA variant of each gene and drug activity (except PT-112) was obtained for the colon cancer cell lines to predict the possible gene network and signaling pathways related to the progression of colon cancer (from KEGG pathway) for targeted therapy. Detailed description for each of the step is given in the following subsections.
Illustration of the methods used in this study to correlate the drug activity with the amino acid (AA) variants from the genetic mutation across the NCI-60 colon cancer cell lines. The AA variant(s) of the genes that also impact protein function might be related to the pathways for the progression of colon cancer. The correlation between drug activity (sensitive/resistance) and a single AA variant was also explored to predict the possible protein network related to colon cancer progression pathways for targeted therapy.
Detection of genetic variant(s) in the NCI-60 cell lines set
To obtain genetic variant(s) of 188 unique genes from the whole exome DNA sequencing of the NCI-60 cell lines,24genetic variant summation option of the NCI-60 analysis tool of CellMiner was used. Detailed information on the NCI-60 cell lines can be found in the Development Therapeutics Programs (DTP) (http://dtp.nci.nih.gov/).32 For each gene, the Human Genome Organization (HUGO) symbol was provided as an input. The variant percentage for a single gene for each cell line is based on all the allele frequency of AA variants from the whole exome sequencing data. For multiple variants of a single gene, the equation used to calculate the integrative percent of AA-changing DNA variants per cell is given as: 1 - [(1 - P1) X (1 - P2)… (1 - Pn)],23 where P1 is the allele frequency for variant 1, P2 is the allele frequency for variant 2, and Pn is the allele frequency for variant n.23
Protein function affecting gene variant(s) are proposed to be deleterious and not present in the normal genomes (the 1,000 genomes (http://www.1000genomes.org/) and EPS5400 (http://evs.gs.washington.edu/EVS), as determined by CellMiner.24 The deleterious status of the genetic variant(s) is based on the Sorting Intolerant from Tolerant (SIFT; http://sift.bii.a-star.edu.sg) values < 0.05 or polyphen-2 (http://genetics.bwh.harvard.edu/pph2) values ≥ 0.85, or the presence or absence in COSMIC for missense changes, or the variant(s) that lead to splicesense, frameshift, or premature stops, as described by Abaan et al.24
Drug activity against the cell lines
The drug activity of oxaliplatin, cisplatin, carboplatin, and 5-FU for the NCI-60 cell lines (including the colon cancer) was obtained from CellMiner (NCI-60 analysis tools) using the option drug activity z-score. We obtained the drug activity as z-scores from the CellMiner for both the Pt-based (oxaliplatin, cisplatin and carboplatin) and non-Pt-based (5-FU) drugs using the National Service Center (NSC) numbers (oxaliplatin: 266046, cisplatin: 119875, carboplatin: 242240, and 5-FU: 19893). For statistical justification, CellMiner utilizes the GI50 datasets of a drug from DTP for the NCI-60 cell lines and transforms the –log10(GI50) values to z-score that passed the quality control criteria with a minimum dataset of two (detailed description of quality control is given in Reinhold et al.20). For the new investigational phosphaplatin drug (PT-112), which is undergoing phase I clinical trial (ClinicalTrials.gov Identifier: NCT02266745), the data of drug activity are not publicly available in CellMiner. Therefore, there are no computed z-scores for this drug. As a result, we computed the z-scores by converting the GI50 data of PT-112 (NSC no. 756765) from DTP (see Supplementary Figure 2). Then, only one dataset is available at DTP for PT-112; therefore, the quality control for this drug is not warranted. Nevertheless, GI50 data from PT-112 passed the 1.2 log10 range test, as described in Ref. 20
Drug Activity and Single Gene Variants Correlations
We used the genetic variant versus drug visualization option of NCI-60 analysis tool from CellMiner to identify the pharmacogenomics correlation between drug activity and single gene variants (nonsynonymous mutation). For this analysis, the NSC number of each drug (for oxaliplatin, cisplatin, carboplatin, and 5-FU) was provided along with the HUGO symbols of the genes. The drug–gene variant correlation was obtained from CellMiner as the Matthew's correlation coefficient (MCC), based on the super learner algorithm, as described in Refs. 23, 24 MCC returns a value between -1 and 1, where 1 represents a perfect prediction, 0 represents no better than random prediction, and -1 indicates total disagreement between prediction and observation. For a given gene, the combination of up to five amino-acid-changing variants with the highest correlation to each drug activity was identified among the NCI-60 cell lines.23 Detailed procedure and other criteria for the MCC calculation for NCI-60 cell lines are provided by Reinhold et al.23 CellMiner only provides the MCC values for those variants for a drug–gene combination, which are statistically significant (P-value < 0.05, Pearson correlation (r) > 0.280 for n = 60). The pharmacogenomics correlation analyses of PT-112 activity and single gene variants were not performed due to the unavailability of the PT-112 data in CellMiner.
Pathway analysis of mutated genes that correlate to oxaliplatin/5-FU activity in colon cancer
For uniquely mutated genes that exhibit correlation to the activity of oxaliplatin or 5-FU or both for the colon cancer cell lines, we first compared these genes with known KEGG pathway maps related to colon cancer progression (http://www.genome.jp/dbget-bin/www_bget?pathway+hsa05210). In addition, we performed extensive literature search and identified the EGFR-signaling pathway for its involvement in the development and progression of several human tumors, including colon cancer.31
Author Contributions
Conceived and designed the research: ST, RNB. Analyzed the data: ST, LB, MSC, RNB. Wrote the first draft of the manuscript: ST, LB. Contributed to the writing of the manuscript: ST, LB, MSC, RNB. Agreed with manuscript results and conclusions: ST, LB, MSC, RNB. Jointly developed the structure and arguments for the paper: ST, LB, MSC, RNB. Made critical revisions and approved final version: ST, LB, MSC. All authors except RNB reviewed and approved the final manuscript.
Supplementary Table 2: Correlation between cisplatin activity and amino-acid (AA) variants of NCI-60 colon cancer cell lines (for genes common with oxaliplatin). “X” symbol indicates that the AA variant is not correlated with drug activity. Other genes (not in common with oxaliplatin) for which the variant(s) correlate with cisplatin activity are: PI3KCA, CREBBP, FAM123B, HNF1A, NF2, and PRDM1.
Supplementary Table 3: Correlation between carboplatin activity and AA-variants (colon cancer) (for genes common with oxaliplatin). “X” symbol indicates that the AA variant is not correlated with drug activity. Other genes (not in common with oxaliplatin) for which the variant(s) correlate with carboplatin activity are: ELF3 EP300; SETD2; ATRX CHEK2 SMC3; ERBB4 FLT3; PIK3CA; APC; CDH1; LIFR USP9X; BCOR CASP8 CREBBP CYLD FAM123B GNAS MED12 NF2 PRDM1 PTCH1 SMARCA4 TSHR.
Supplementary Table 4: Summary of biological functions of the uniquely mutated genes for which the amino-acid changing variant(s) exhibits correlation with the activity of oxaliplatin or 5-FU or both for the colon cancer cell lines. The underlined genes are related with colon cancer progression from KEGG pathway (http://www.genome.jp/dbget-bin/www_bget?pathway+hsa05210).
Supplementary Table 5: List of driver genes that exhibit non-synonymous mutations across the NCI-60 cell lines (see Figs. 1 and 2 in the Main text).
Supplementary Figure 1: Venn diagram of the 188 unique genes for which the mutations were analyzed across the NCI-60 colon cancer cell lines. The number of genes is indicated inside the brackets for different categories.
Supplementary Figure 2: GI50 data set and mean graph of PT-112 (NSC # 756765), as obtained from the NCI Development Therapeutics Program. Note that the GI50 data, only for the NCI-60 cell lines were used to calculate the z-scores of PT-112 in Figure S3.
Supplementary Figure 3: Activity of platinum (Pt) based drugs (PT-112, oxaliplatin, carboplatin and cisplatin) and 5-FU across the NCI-60 cell lines for nine different cancer types. Drug activity based on the z-scores were determined from the growth inhibitory 50% (GI50) data (see Methods in the main text) across the 60 cell lines for 9 different cancer types: BR (breast); CNS (central nervous system); CO (colon); LE (leukemia); ME (melanoma); LC (lung); OV (ovarian); PR (prostate); and RE (renal) cancer. The shaded region indicates the z-scores for the seven colon cancer cell lines.
Footnotes
Acknowledgements
Rathindra N. Bose passed away during the preparation of this manuscript, but he is listed as a co-author because he conceived the idea, contributed to the design of the study and data analysis, and wrote part of this article. This article is dedicated to R. N. Bose (1952–2015), the inventor of the PT-112 anticancer drug.
References
1.
HaggarF.A., BousheyR.P.Colorectal cancer epidemiology: incidence, mortality, survival, and risk factors.Clin Colon Rectal Surg.2009; 22(4): 191–7.
2.
ColussiD., BrandiG., BazzoliF.Molecular pathways involved in colorectal cancer: implications for disease behavior and prevention.Int J Mol Sci.2013; 14(8): 16365–85.
3.
de GramontA., VignoudJ., TournigandC.Oxaliplatin with high-dose leucovorin and 5-fluorouracil 48-hour continuous infusion in pretreated metastatic colorectal cancer.Eur J Cancer.1997; 33(2): 214–9.
4.
RothenbergM.L., OzaA.M., BigelowR.H.Superiority of oxaliplatin and fluorouracil-leucovorin compared with either therapy alone in patients with progressive colorectal cancer after irinotecan and fluorouracil-leucovorin: interim results of a phase III trial.J Clin Oncol.2003; 21(11): 2059–69.
5.
FischelJ.L., FormentoP., CiccoliniJ.Impact of the oxaliplatin-5 fluorouracil-folinic acid combination on respective intracellular determinants of drug activity.Br J Cancer.2002; 86(7): 1162–8.
6.
MellorH.R., CallaghanR.Resistance to chemotherapy in cancer: a complex and integrated cellular response.Pharmacology.2008; 81(4): 275–300.
7.
WidakowichC., de CastroG.Jr., de AzambujaE.Review: side effects of approved molecular targeted therapies in solid cancers.Oncologist.2007; 12(12): 1443–55.
8.
LippertT.H., RuoffH.J., VolmM.Intrinsic and acquired drug resistance in malignant tumors. The main reason for therapeutic failure.Arzneimittelforschung.2008; 58(6): 261–4.
9.
BoseR.N., MaurmannL., MishurR.J.Non-DNA-binding platinum anticancer agents: cytotoxic activities of platinum-phosphato complexes towards human ovarian cancer cells.Proc Natl Acad Sci U S A.2008; 105(47): 18314–9.
10.
MoghaddasS., MajmudarP., MarinR.Phosphaplatins, next generation platinum antitumor agents: a paradigm shift in designing and defining molecular targets.Inorganica Chim Acta.2012; 393(1): 173–81.
11.
FearonE.R., VogelsteinB.A genetic model for colorectal tumorigenesis.Cell.1990; 61(5): 759–67.
12.
ZorattoF., RossiL., VerricoM.Focus on genetic and epigenetic events of colorectal cancer pathogenesis: implications for molecular diagnosis.Tumour Biol.2014; 35(7): 6195–206.
13.
NgJ.M., YuJ.Promoter hypermethylation of tumour suppressor genes as potential biomarkers in colorectal cancer.Int J Mol Sci.2015; 16(2): 2472–96.
14.
LaoV.V., GradyW.M.Epigenetics and colorectal cancer.Nat Rev Gastroenterol Hepatol.2011; 8(12): 686–700.
15.
StrattonM.R., CampbellP.J., FutrealP.A.The cancer genome.Nature.2009; 458(7239): 719–24.
16.
AndreyevH.J., NormanA.R., CunninghamD.Kirsten ras mutations in patients with colorectal cancer: the multicenter “RASCAL” study.J Natl Cancer Inst.1998; 90(9): 675–84.
17.
SamowitzW.S., CurtinK., SchafferD.Relationship of Ki-ras mutations in colon cancers to tumor location, stage, and survival: a population-based study.Cancer Epidemiol Biomarkers Prev.2000; 9(11): 1193–7.
18.
GovindanR., WeberJ.TP53 mutations and lung cancer: not all mutations are created equal.Clin Cancer Res.2014; 20(17): 4419–21.
19.
NussinovR., JangH., TsaiC.J.The structural basis for cancer treatment decisions.Oncotarget.2014; 5(17): 7285–302.
20.
ReinholdW.C., SunshineM., LiuH.CellMiner: a web-based suite of genomic and pharmacologic tools to explore transcript and drug patterns in the NCI-60 cell line set.Cancer Res.2012; 72(14): 3499–511.
21.
KandothC., McLellanM.D., VandinF.Mutational landscape and significance across 12 major cancer types.Nature.2013; 502(7471): 333–9.
AbaanO.D., PolleyE.C., DavisS.R.The exomes of the NCI-60 panel: a genomic resource for cancer biology and systems pharmacology.Cancer Res.2013; 73(14): 4372–82.
25.
KanehisaM., GotoS.KEGG: kyoto encyclopedia of genes and genomes.Nucleic Acids Res.2000; 28(1): 27–30.
26.
WaltherA., JohnstoneE., SwantonC.Genetic prognostic and predictive markers in colorectal cancer.Nat Rev Cancer.2009; 9(7): 489–99.
27.
ChongC.R., JanneP.A.The quest to overcome resistance to EGFR-targeted therapies in cancer.Nat Med.2013; 19(11): 1389–400.
28.
JankuF., StewartD.J., KurzrockR.Targeted therapy in non-small-cell lung cancer -is it becoming a reality?Nat Rev Clin Oncol.2010; 7(7): 401–14.
29.
HolohanC., Van SchaeybroeckS., LongleyD.B.Cancer drug resistance: an evolving paradigm.Nat Rev Cancer.2013; 13(10): 714–26.
KrasinskasA.M.EGFR signaling in colorectal carcinoma.Patholog Res Int.2011; 2011: 932932.
32.
ShoemakerR.H.The NCI60 human tumour cell line anticancer drug screen.Nat Rev Cancer.2006; 6(10): 813–23.
33.
ImamuraY., LochheadP., YamauchiM.Analyses of clinicopathological, molecular, and prognostic associations of KRAS codon 61 and codon 146 mutations in colorectal cancer: cohort study and literature review.Mol Cancer.2014; 13: 135.
34.
NeumannJ., Zeindl-EberhartE., KirchnerT.Frequency and type of KRAS mutations in routine diagnostic analysis of metastatic colorectal cancer.Pathol Res Pract.2009; 205(12): 858–62.
35.
KinzlerK.W., VogelsteinB.Lessons from hereditary colorectal cancer.Cell.1996; 87(2): 159–70.
36.
SchubbertS., ShannonK., BollagG.Hyperactive Ras in developmental disorders and cancer.Nat Rev Cancer.2007; 7(4): 295–308.
37.
BosJ.L.Ras oncogenes in human cancer: a review.Cancer Res.1989; 49(17): 4682–9.
38.
ConlinA., SmithG., CareyF.A.The prognostic significance of K-ras, p53, and APC mutations in colorectal carcinoma.Gut.2005; 54(9): 1283–6.
39.
AndreyevH.J., NormanA.R., CunninghamD.Kirsten ras mutations in patients with colorectal cancer: the ‘RASCAL II’ study.Br J Cancer.2001; 85(5): 692–6.
40.
FengY., BommerG.T., ZhaoJ.Mutant KRAS promotes hyperplasia and alters differentiation in the colon epithelium but does not expand the presumptive stem cell pool.Gastroenterology.2011; 141(3): 1003–1013.e1-10.
41.
OtoriK., OdaY., SugiyamaK.High frequency of K-ras mutations in human colorectal hyperplastic polyps.Gut.1997; 40(5): 660–3.
42.
MoonB.S., JeongW.J., ParkJ.Role of oncogenic K-Ras in cancer stem cell activation by aberrant Wnt/beta-catenin signaling.J Natl Cancer Inst.2014; 106(2): djt373.
43.
GradyW.M., CarethersJ.M.Genomic and epigenetic instability in colorectal cancer pathogenesis.Gastroenterology.2008; 135(4): 1079–99.
44.
VogelsteinB., KinzlerK.W.Cancer genes and the pathways they control.Nat Med.2004; 10(8): 789–99.
45.
MaQ., LuA.Y.Pharmacogenetics, pharmacogenomics, and individualized medicine.Pharmacol Rev.2011; 63(2): 437–59.
46.
FebboP.G., LadanyiM., AldapeK.D.NCCN task force report: evaluating the clinical utility of tumor markers in oncology.J Natl Compr Canc Netw.2011; 9(suppl 5): S1–S32. quiz S33.
47.
BoseR.N., MoghaddasS., BelkacemiL.Absence of activation of DNA repair genes and excellent efficacy of phosphaplatins against human ovarian cancers: implications to treat resistant cancers.J Med Chem.2015; 58(21): 8387–401.
48.
LinY.L., LiauJ.Y., YuS.C.Oxaliplatin-based chemotherapy might provide longer progression-free survival in KRAS mutant metastatic colorectal cancer.Transl Oncol.2013; 6(3): 363–9.
49.
HopkinsA.L.Network pharmacology: the next paradigm in drug discovery.Nat Chem Biol.2008; 4(11): 682–90.
50.
ChenJ., HuangX.F., QiaoL.Insulin caused drug resistance to oxaliplatin in colon cancer cell line HT29.J Gastrointest Oncol.2011; 2(1): 27–33.
51.
ChenJ., KatsifisA., HuC.Insulin decreases therapeutic efficacy in colon cancer cell line HT29 via the activation of the PI3K/Akt pathway.Curr Drug Discov Technol.2011; 8(2): 119–25.
52.
ZhangB., ZhangB., ChenX.Loss of Smad4 in colorectal cancer induces resistance to 5-fluorouracil through activating Akt pathway.Br J Cancer.2014; 110(4): 946–57.
53.
ChenY., WangZ., ChangP.The effect of focal adhesion kinase gene silencing on 5-fluorouracil chemosensitivity involves an Akt/NF-kappaB signaling pathway in colorectal carcinomas.Int J Cancer.2010; 127(1): 195–206.
54.
BhattacharyaB., AkramM., BalasubramanianI.Pharmacologic synergy between dual phosphoinositide-3-kinase and mammalian target of rapamycin inhibition and 5-fluorouracil in PIK3CA mutant gastric cancer cells.Cancer Biol Ther2012; 13(1): 34–42.
55.
ChenJ., ShaoR., LiL.Effective inhibition of colon cancer cell growth with MgAl-layered double hydroxide (LDH) loaded 5-FU and PI3K/mTOR dual inhibitor BEZ-235 through apoptotic pathways.Int J Nanomedicine.2014; 9: 3403–11.
56.
ChenJ., ZhangX.D., ProudC.Dissecting the signaling pathways that mediate cancer in PTEN and LKB1 double-knockout mice.Sci Signal.2015; 8(392): e1.
YangG.D., HuangT.J., PengL.X.Epstein-Barr virus_encoded LMP1 upregulates microRNA-21 to promote the resistance of nasopharyngeal carcinoma cells to cisplatin-induced Apoptosis by suppressing PDCD4 and Fas-L.PLoS One.2013; 8(10): e78355.
59.
ChenJ.Signaling pathways in HPV-associated cancers and therapeutic implications.Rev Med Virol.2015; 25(suppl 1): 24–53.
60.
BanerjeeA.S., PalA.D., BanerjeeS.Epstein-Barr virus-encoded small non-coding RNAs induce cancer cell chemoresistance and migration.Virology.2013; 443(2): 294–305.
61.
BarretinaJ., CaponigroG., StranskyN.The cancer cell line encyclopedia enables predictive modelling of anticancer drug sensitivity.Nature.2012; 483(7391): 603–607.
62.
SawyersC.Targeted cancer therapy.Nature.2004; 432(7015): 294–7.
63.
MonksA., ScudieroD., SkehanP.Feasibility of a high-flux anticancer drug screen using a diverse panel of cultured human tumor cell lines.J Natl Cancer Inst.1991; 83(11): 757–66.