
Abstract
This study describes our efforts to further the field of noninvasive diagnostics, specifically in the area of liquid biopsies in oncology. We employed laser scanning cytometry using highly selective antibodies to interrogate circulating tumor cells (CTCs) that were isolated using ApoStream® technology to identify folate receptor alpha (FRα)–positive cells. We demonstrate that FRα+ CTCs can be isolated from patients with metastatic cancers, including NSCLC adenocarcinoma, breast cancer, and ovarian cancer, whereas squamous cell lung cancer and normal healthy controls were devoid of FRα+ CTCs. We believe that the developed methodology will have applications in both the diagnosis and the monitoring of FRα-expressing cancers. Folate receptor alpha (FRα) expression may have utility as a potential diagnostic and therapeutic target in solid tumors. As tissue samples are not always available for patient screening, this study evaluated a noninvasive assay in CTCs from blood samples to detect FRα expression. The presence of FRα+ CTCs enriched using ApoStream® and detected using laser capture cytometry was evaluated in blood samples from cancer patients [NSCLC adenocarcinoma (
Background
Folic acid or vitamin B9, playing a central role in one-carbon metabolism and essential for nucleotide biosynthesis and other methylation reactions including proteins and lipids, is transported into cells via specific receptors. 1 The folate receptor family includes the ubiquitous bidirectional reduced folate carrier, proton-coupled folate transporter, and multiple isoforms of the so-called folate receptor: folate receptor alpha (FRα), folate receptor beta, folate receptor gamma, and folate receptor delta, each having a distinct tissue distribution and function. 2 The alpha isoform, a glycosylphosphatidylinositol-anchored receptor, displays high affinity for 5-methyltetrahydrofolate (MTHF), the principal form of plasma folate, and transports folate (MTHF) unidirectionally from the extracellular environment into the cytoplasm via a nondestructive, recycling endosomal pathway.3,4
FRα is the most widely studied folate receptors and has a relatively limited expression profile in normal adult tissues but is highly expressed in a number of nonmucinous tumors of epithelial origin. 5 The reasons for its expression in tumors relative to normal tissue are not entirely understood but it has been hypothesized that FRα confers a growth advantage to the tumor by modulating folate uptake from serum 6 or by activating the Notch1 signaling pathway that leads to cell proliferation. 7 More recently, FRα expression in epithelial tumors was described as being representative of the tissue (cell type) of origin.8–15 For example, FRα is expressed in the columnar epithelium of the normal fallopian tube, which is now considered to be the cell of origin of the serous histotype of ovarian cancer, whereas FRα expression is either absent or much less prevalent on other ovarian cancer histologies. Indeed, epithelial ovarian cancer was one of the first tumor types to be associated with FRα expression. 16 Subsequently, expression of FRα was observed in a number of epithelial human cancers, including central nervous system, lung, breast, and kidney.7,17–19 In addition, high levels of FRα expression appear to be associated with aggressive cancers.7,20 FRα expression has been shown to be a negative prognostic indicator in several cancers21–24 but appears to be a positive prognostic indicator in a subset of NSCLC adenocarcinoma.25,26 The expression of FRα in a variety of tumor types of epithelial origin, combined with its restricted expression in normal tissues, suggests that it may be useful as a therapeutic target as well as a diagnostic marker. Indeed, several compounds specifically directed against FRα are currently in clinical trials.27,28 Farletuzumab is one such compound, which is a humanized anti-FRα antibody that selectively induces cytotoxicity in tumors via antibody-dependent cellular cytotoxicity and complement-dependent cytotoxicity and is currently in clinical trials in patients with ovarian cancer and NSCLC adenocarcinoma.29–31
Immunohistochemical staining of archival or biopsy samples is the most commonly used method to determine FRα protein expression levels.29,32 While collection of biopsy samples at diagnosis offers an opportunity to evaluate expression of FRα as a biomarker, the collection of longitudinal biopsies over an extended period of time in a typical clinical setting is more challenging and in most cases is not feasible. Furthermore, it is not always possible to obtain a biopsy when
To date, the routine use of CTCs in the clinic has been limited to the current epithelial cell adhesion molecule (EpCAM)-based immunomagnetic approaches that only detect CTCs that express EpCAM and exclude those CTCs with absent or low EpCAM expression. Numerous reports have found low CTC recovery in nonepithelial and metastatic cancers (eg, melanoma, ovarian, pancreatic, and lung)42,43 underscoring the need for improved, unbiased CTC recovery technologies.
To overcome these limitations, we have developed an antibody-independent approach for CTC isolation using ApoStream®, a device that relies on continuous field-flow-assist and dielectrophoresis (DEP) technology to isolate and recover CTCs from the blood of cancer patients. ApoStream® isolation exploits the differences in intrinsic dielectric properties between cancer cells and normal blood cells. 44 Details regarding the DEP frequency are described in the study by Gupta et al. 44 , in brief, 65 kHz was used for the samples reported herein. CTC enrichment using the ApoStream® technology has been associated with a substantially higher recovery of various subsets of CTCs from blood samples from a variety of cancer patients compared with the EpCAM-based CellSearch® platform. 45 After ApoStream® CTC enrichment, isolated cells can be enumerated, interrogated, and characterized by immunofluorescence detection of biomarkers using laser scanning cytometry (LSC) quantitative analysis.
In this study, we developed an immunofluorescence staining procedure using FRα MAb 26B3, coupled with ApoStream® enrichment, to identify FRα+ CTCs from blood samples collected from patients with four types of metastatic cancer: NSCLC adenocarcinoma, breast cancer, ovarian cancer, and squamous cell lung cancer. While FRα+ CTCs were isolated in samples from NSCLC adenocarcinoma, breast cancer, and ovarian cancer, FRα+ CTCs were not isolated from either lung squamous cell carcinoma patients or healthy donors, demonstrating the specificity of the technique. Further studies are in progress to evaluate the utility of FRα+ CTC detection in the clinical setting.
Materials and Methods
Ethics statement
The healthy donor blood samples used in this study were obtained by ApoCell, Inc. Subjects provided written informed consent under an institutional review board approved by IntegReview Ethical Review Board located in Austin, TX. The blood samples of cancer patients used in this report were obtained from Conversant Bio. Subjects provided written informed consent under Western Institutional Review Board approved by Conversant Bio or AdeptBio LLC protocol ADEPT-039–01 “Procurement of Human Biospecimens for Medical Research.” The research was conducted in accordance with the principles of the Declaration of Helsinki.
Study subjects
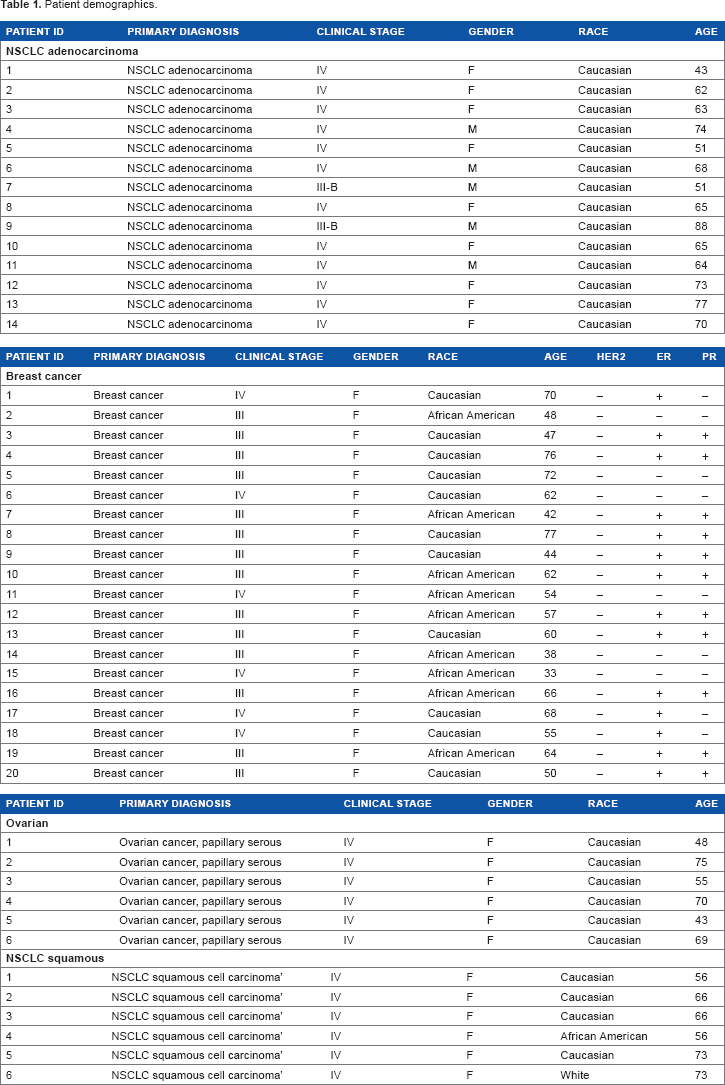
Advanced NSCLC adenocarcinoma patients (stage IV,
Patient demographics.
Cell lines
SK-OV-3 (ovarian carcinoma cell line with high FRα expression) and HCT-116 (colorectal carcinoma cell line with low-to-moderate FRα expression) were obtained from ATCC. Cells were maintained in tissue culture medium using RPMI-1640 with 10% fetal bovine serum (Promega) and penicillin/streptomycin (Cellgro).
Antibodies
Monoclonal murine anti-FRα antibodies LK26 [immunoglobulin (Ig) G2a] and 26B3 (IgG1) were provided by Morphotek, Inc. MAb LK26 binds to FRα at amino acid positions 45–57 and MAb 26B3 binds to positions 174–185. 13 Dylight-649- and Alexa Fluor®647-conjugated goat anti-mouse antibodies were purchased from Jackson Immuno-Research. Anticytokeratin (anti-CK; clone:CK3–6H5) antibody labeled with fluorescein isothiocyanate (FITC) was purchased from Miltenyi Biotec Inc. and anti-CK (clone C11) antibody labeled with PE was purchased from Novus Biologicals and anti-CD45 (clone:5B1) antibodies labeled with FITC or PE were purchased from BD Biosciences and Miltenyi Biotec Inc.
FRα antibody detection
Flow cytometry and LSC comparison
The optimal dilutions of the antibodies were determined by staining a titrated range of antibodies on SK-OV-3 and HCT-116 cells. Antibodies were diluted to 0.1, 1, and 10 μg/mL in PBS with 1% BSA (Sigma) and 1% heat-inactivated human AB serum. Fresh cells (1–5 × 10⁶/mL) were stained and washed, and bound antibodies were detected by staining with either FITC- or DyLight-649-conjugated antimouse antibodies as secondary antibody. Dylight-649 conjugated goat antimouse antibody at a 1:200 dilution. The fluorescence signal was detected by a three-laser FACSCANTO II flow cytometer (BD Biosciences) and analyzed using FlowJo software (TreeStar, Inc.). For LSC analysis, fresh stained cells were fixed with 2% paraformaldehyde (PFA) and cytospun on a glass slide. Peripheral blood mononuclear cells (PBMCs) were used as a negative biological staining control. The fluorescence signal was detected by LSC using a three-laser iCys® Research Imaging Cytometer (Thorlabs), and the mean fluorescent intensity (MFI) was reported for each antibody.
CTC enrichment
CellSearch®
By way of reference, the CellSearch® system was used for the isolation and enumeration of CTCs. Blood (7.5 mL) was collected from patients in 10 mL CellSave® tubes and processed within 24 hours using the CellSearch® System (Veridex) with the FDA-cleared CTC Kit, which isolates EpCAM-positive cells using a ferromagnetic immune absorption assay. Analyses of CTCs were performed on CellTracks® Analyzer II, and the final CTC images were scored by a Veridex, LLC certified analyst to unambiguously identify CTCs. CTC enumeration was reported as the number of EpCAM-enriched, CK+, CD45–, and 4′,6-diamidino-2-phenylindole (DAPI+) cells per 7.5 mL of blood. 42
ApoStream®
PBMCs were isolated from whole blood using a Ficoll-Paque gradient separation method. Cells within the suspension, which included PBMCs and tumor cells, were collected, washed, and resuspended in ApoStream® running buffer (ApoCell, Inc.). The cell suspension was injected into an ApoStream® (ApoCell, Inc.) continuous flow microfluidic flow system where DEP at 65 kHz was used to separate CTCs from PBMCs. 44 Cell isolates enriched in CTCs were collected via a collection port in the flow chamber. After collection, cells were fixed using 2% PFA (Electron Microscopy Sciences) in PBS for 20 minutes at room temperature. Cells were washed and stored in PBS at 4 °C prior to cytocentrifugation.
Immunofluorescent staining
Aliquots of enriched cells obtained using ApoStream® were cytospun onto glass slides using a Shandon Cytospin 4 (Thermo Electron Corporation) at 1,000 rpm for 10 minutes. Cells were then permeabilized with 0.2% Triton-X100 (Electron Microscopy Sciences) and stained with anti-CK, anti-CD45, and anti-FRα antibodies diluted in PBS containing 2% donkey serum and 1% heat-inactivated human AB serum at 4 °C overnight, washed and subsequently visualized with Dylight-649-conjugated antimouse or with Alexa Fluor®647-conjugated antimouse antibodies. Negative control slides were incubated with irrelevant mouse IgG primary antibody and secondary antibody. Nuclear staining was visualized using DAPI. After staining, cells were cover-slipped using 50% glycerol, and fluorescence of individual cells was measured by LSC.
Laser scanning cytometry
LSC was performed using a 3-laser iCys® Research Imaging Cytometer (ThorLabs). Quantitative image analysis was performed using iCys 3.4 software. Individual cells were identified by contouring the DAPI-stained nuclei. CTCs were defined as cells that were DAPI+/CK+/CD45–. The cutoff for positivity of CK and CD45 was defined by isotype controlled irrelevant antibodies. The cutoff for FRα positivity was determined using the internal PBMC population in the CTC-enriched sample. Enumeration was determined for the classical CTC phenotype (DAPI+/CK+/CD45–) cells. The proportion of FRα+ cells among CTCs and PBMCs and the fluorescence intensity of FRα expression (expressed as MFI) were determined in the FRα+ cell population.
Results
Detection of murine anti-FRα antibodies by flow cytometry and LSC
The feasibility of FRα detection using LK26 (the mouse parent of farletuzumab) or 26B3 monoclonal antibodies was demonstrated in SK-OV-3 and HCT-116 tumor cells using two methods: flow cytometry and LSC. The optimal dilution for each MAb was determined by flow cytometry assay, as shown in Figure 1 and Table 2. SK-OV-3 cells show ~10-fold higher MFI compared to HCT-116 cells. To identify an optimal fluorochrome that emits quantifiable signal in the relatively low FRα-expressing HCT-116 cell line, a comparison of the primary MAbs with two secondary agents, one conjugated with FITC and one conjugated with Dylight-649, was performed. As shown in Figure 2 and Table 3, the primary antibodies at concentrations of 1 and 10 μg/mL showed a substantially increased MFI and higher signal-to-noise ratio (S/N: MFI-specific antibody/MFI irrelevant mouse IgG) using Dylight-649 (S/N ratios of 16 and 11, respectively) compared with FITC (S/N ratios of 5 and 4, respectively). These data indicate the Dylight-649 conjugated secondary antibody used to detect the anti-FRA primary MAb is the preferred reagent for detection of relatively low levels of FRA expression.

Flow cytometry of FRα-stained cells: histograms of flow cytometric analysis of SK-OV-3 cells (

Secondary antibody detection of FRα: histograms from flow cytometric analysis of HCT-116 cells stained by anti-FRα antibodies LK26 and 26B3 where the antibodies were diluted to 0.1 μg/mL (magenta), 1 μg/mL (green), and 10 μg/mL (orange) and detected by either FITC- or DyLight-649-conjugated anti-mouse antibodies as secondary antibody. Controls included autofluorescence (gray), Dylight-649-conjugated anti-mouse secondary antibody only (black line), and irrelevant mouse IgG plus secondary antibody (green shading).
Titration of anti-FRα MAbs LK26 and 26B3 to cell lines by flow cytometry.

MFI, mean fluorescence index assessed using flow cytometry.
S/N, signal-to-noise ratio is the MFI from anti-FRα antibody/MFI of mouse IgG (control nonspecific mouse antibody) at 10 μg/mL.
Comparison of primary anti-FRα MAbs on HCT-116 cells using either FITC or Dylight-649 fluorophores.
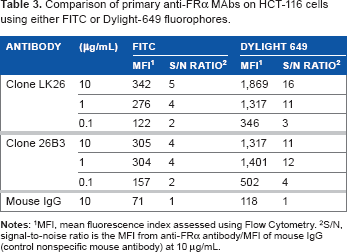
MFI, mean fluorescence index assessed using Flow Cytometry.
S/N, signal-to-noise ratio is the MFI from anti-FRα antibody/MFI of mouse IgG (control nonspecific mouse antibody) at 10 μg/mL.
The LSC method for detecting FRα in SK-OV-3 and HCT-116 tumor cells showed a dilution-dependent change in signal (FRα expression; MFI and % FRα+ cells) (Fig. 3 and Table 4) with the optimal signal obtained with antibody concentrations of 1–10 μg/mL with 10 μg/mL being chosen for all subsequent analyses. As previously noted, SK-OV-3 cells provided an approximately fivefold higher signal compared with HCT-116 cells (Table 4). PBMCs from healthy donors were negative for FRα expression, confirming the specificity of the two antibodies (Table 4).

Detection of FRα using LSC: histograms obtained using LSC analysis of SK-OV-3 cells (
LSC analysis of FRα expression on SK-OV-3, HCT-116 and PBMC cells.

MFI, mean fluorescence intensity.
S/N, signal-to-noise ratio is the MFI from anti-FRα antibody/MFI of mouse IgG (control nonspecific mouse antibody) at 10μg/mL.
The results of fixation indicate a negligible effect of 2% PFA fixation on FRα detection using either MAb as comparable immunofluorescent signals were detected from both fresh and fixed SK-OV-3 cells (Fig. 4). Furthermore, the data shown in Figures 1–4 demonstrate that while either MAb or the therapeutic MAb farletuzumab (not shown) could be used for CTC analysis, MAb 26B3 appeared to be more sensitive than MAb LK26, especially evident with HCT-116 (Tables 2 and 4), most likely a reflection of the higher affinity of MAb 26B3 for FRα. 29

Effect of fixation on FRα staining: unfixed and 2% PFA fixed SK-OV-3 cells were stained for FRα using either MAb LK26 or MAb 26B3 and Dylight-649 anti-mouse and immunofluorescence measured using LSC. This analysis demonstrated that there is little or no effect due to fixation on the intensity of the FRα signal.
Comparison of CellSearch® and ApoStream® CTC enrichment technologies
A side-by-side comparison between CellSearch® and ApoStream® CTC enrichment and enumeration approaches on blood samples collected from NSCLC adenocarcinoma patients (Table 1, patients 1–9) shows higher CTC counts with ApoStream® (Table 5). Samples were collected simultaneously and processed with either ApoStream or CellSearch to obviate sampling errors. CellSearch® enrichment is dependent on the expression of antibody accessible EpCAM on the cell, whereas ApoStream® enrichment is antibody independent and relies on a generalized physical property of tumor cells. For this comparison, we used the same definition for identification and enumeration of CTCs, ie, DAPI+/CK+/CD45–.
Comparison of CellSearch® and ApoStream® CTC isolation technologies applied to NSCLC adenocarcinoma patients.

CTCs are defined as DAPI+/CK+/CD45– cells.
FRα expression in CTCs from multiple types of cancer
To further assess this approach for identifying molecularly defined CTCs, ie, CTCs expressing a specific protein, we multiplexed FRα MAb 26B3 with directly conjugated anti-CK MAb, anti-CD45 MAb, and DAPI and used this panel to detect FRα+ CTCs in several cancer types as well as healthy subjects (Table 6). Table 6 shows that in healthy individuals, zero CTCs were detected in 6 subjects, while “false positive” CTCs were detected in 14 subjects with a range of 1–14 CTCs identified according to the “classic”” CTC definition of DAPI+/CK+/CD45– cells. 46 However, no FRα expression was detected in this cell population or in the inverse population of DAPI+/CK–/CD45+ cells (Supplementary Table 1).
Detection of FRα+ CTCs using an anti-CK, anti-CD45, and anti-FRα multiplexed fluorescence panel.
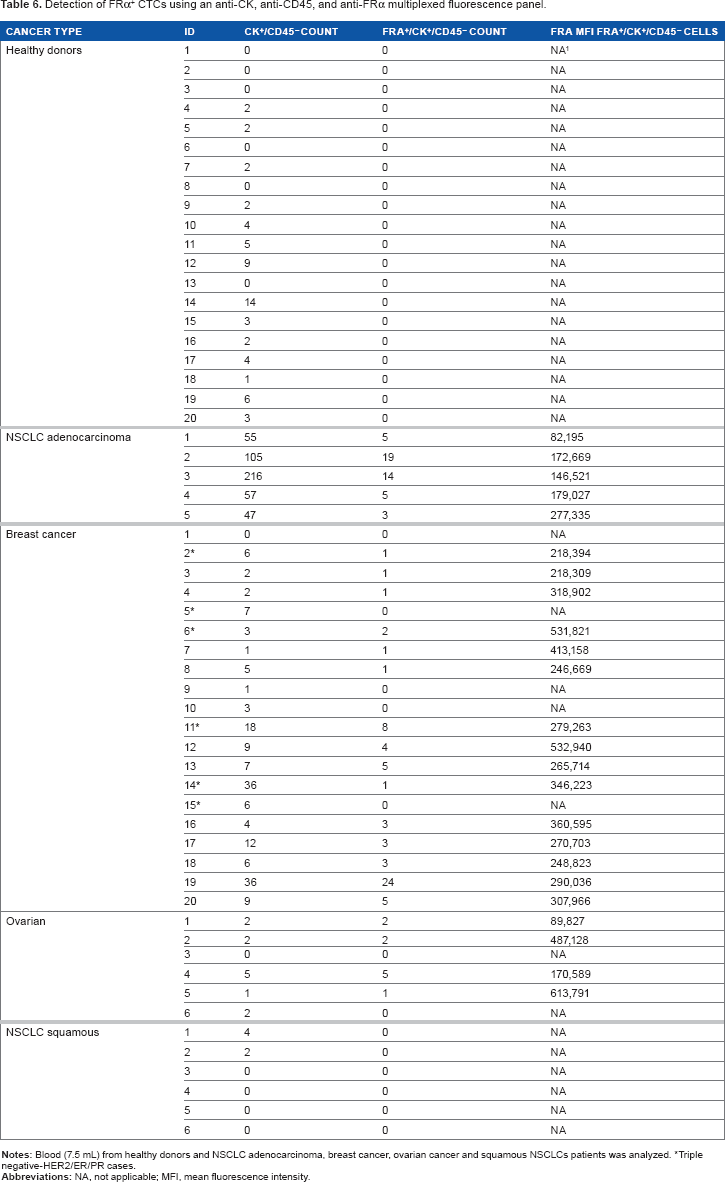
Triple negative-HER2/ER/PR cases.
In NSCLC adenocarcinoma patients (Table 1, patients 10–14), CTC counts ranged from 47 to 216 (mean = 89) CTCs/7.5 mL blood (Table 6). FRα expression was detected exclusively in DAPI+/CK+/CD45– cells while DAPI+/CK–/CD45+ cells, presumably the leucocyte population, were negative for FRα expression. The proportion of FRα+ cells ranged from 8 to 33% (mean = 16.4%), and the MFI ranged from 82,000–277,000 mean fluorescent units. In contrast to these data, CTCs were isolated from only two of the six NSCLC squamous cell carcinoma patients; both were negative for FRα expression. These findings are consistent with a previous report describing positive FRα expression in the majority of NSCLC adenocarcinoma samples but absent in squamous cell carcinoma. 25 FRα has also been demonstrated to be expressed in breast cancer, especially triple negative breast cancer (TNBC). 24 As can be seen in Table 6, CTCs were isolated from 19 of 20 breast cancer patients (range: 0–36; mean = 9), and FRα+ cells were detected in 15 of 20 patients, ranging from 2.7% to 100% (mean = 49.2%) of the DAPI+/CK+/CD45– cell population with MFIs ranging from 218,309 to 532,940. Of the 20 breast cancer patients, 6 were TNBC, and CTCs were detected in 100% of TNBC patients (range: 3–36; mean = 12.7). FRα expression was detected in four of the six TNBC patients and was variable ranging from 2.7 to 66% (mean = 32%). In a small cohort of six serous ovarian cancer samples, CTCs were isolated from five of the six patients (range: 0–5) with four of the five patients CTCs being 100% FRα+ (MFI range: 89,827–613,791) (Table 6). An image gallery of representative CTCs from breast, ovarian, and NSCLC (adenocarcinoma and squamous) cancers is shown in Figure 5.

FRα-positive CTCs isolated using ApoStream®: ApoStream® enriched samples were stained using a multiplexed assay for CK, CD45, and FRα (MAb 26B3) and imaged using LSC. Images are gated CTCs (DAPI+/CK+/CD45–) from breast, ovarian, and NSCLC (adenocarcinoma and squamous cell carcinoma) patients. Images show a coincidence of staining for DAPI, CK, and FRα (NSCLC adenocarcinoma, breast cancer, and ovarian cancer) while being negative for CD45, whereas CTCs isolated from NSCLC squamous cell carcinoma are FRα negative. In addition, staining is shown for cells isolated from a normal donor using ApoStream and demonstrate that while some CD45+ cells are isolated, they are neither CK+ nor FRα+.
Discussion
Quantitative marker or pathway-driven assays are used in a variety of clinical and clinical trial settings to both select patients and determine effectiveness of a number of pharmacologic agents. Invasive biopsies are still the norm as a source of tumor cells for most such analyses, although several promising technologies that utilize less invasive techniques such as blood sampling are on the horizon. One such technique is blood sampling for CTCs, which shows promise as a surrogate for both primary and metastatic tumors and could be especially useful for clinical biomarker studies that examine drug effects pre- and posttreatment. Furthermore, this approach lends itself well to the development and clinical uptake as a companion diagnostic. The quantitation of CTCs in breast cancer, using an FDA cleared system, CellSearch®, is currently employed clinically to aid in the prognosis of patients.46,47
In this study, we developed a quantitative, multiplexed LSC assay that enables specific biomarker interrogation/characterization of CTCs at the single cell level in a target-specific manner, namely, FRα. Previously, LSC has been used to show correlations between angiogenesis biomarkers (including VEGFR and PDGFR) and clinical responses in semaxanib (SU5416)-treated advanced soft tissue sarcomas. 48 Furthermore, LSC is particularly well suited for rare cell analyses as cells are fixed onto glass slides, prior to interrogation, minimizing cell loss. The precision of the laser excitation in LSC allows for differentiation, quantitation, and visualization of both extracellular and intracellular markers with high resolution, something that is not possible with other methods such as conventional flow cytometry. Through the combination of ApoStream® and LSC, we developed an assay for the quantitation of FRα+ CTCs as well as the relative level of FRα protein expression on individual CTCs based on a mean fluorescence intensity.
Since the FRα MAbs used in this study were originally characterized using flow cytometry analysis (among others), we compared antibody performance using both the LSC platform and flow cytometry to ensure consistency of antibody detection between the two platforms. Both methods allowed for the detection of FRα, even from cell lines with low FRα expression and differentiated between tumor cell lines with high and low FRα expression. Furthermore, the assay for FRα+ cells was demonstrated to be both sufficiently sensitive and specific to detect tumor cells SK-OV-3 and HCT-116 using PBMCs obtained from healthy individuals as negative biological controls. Finally, we multiplexed the FRα antibody with antibodies typically used for CTC identification to produce an assay for the measurement of FRα on CTCs from a variety of cancers including ovarian, breast, NSCLC adenocarcinoma, and NSCLC squamous cell carcinoma and compared these data with normal healthy controls.
The incidence of detectable CTCs recovered by ApoStream® was higher compared to what had been reported for the CellSearch® platform (23%–39% of stage IV NSCLC patients had a CTC count ≥1).49,50 Although we did not examine EpCAM expression in this study, we have previously observed in multiple studies that CTCs enriched by ApoStream® include cells expressing little or no EpCAM. 45 The higher CTC counts observed in this study may be attributable to the enrichment of EpCAM-negative CTCs. These findings are consistent with historical data on primary and metastatic tumors that found that 26% of NSCLC tumors had little or no EpCAM expression. 51
To determine the specificity of the developed staining panel, blood from patients with ovarian cancer (a cancer known to be FRα+) and squamous lung cancer (known to be FRα–) was collected. All CK+CD45– CTCs recovered from blood samples from ovarian cancer patients were FRα+, while no FRα expression was detected in the CK+CD45~ CTCs from squamous lung cancer patients demonstrate that the FRα CTC assay was specific for FRα. These data are concordant with immunohistochemical analyses on these tumor types using the same FRα 26B3 MAb. 29 Furthermore, the relative abundance of CTCs isolated from NSCLC adenocarcinoma compared to squamous cell carcinoma described in this study is consistent with previous reports. 52 The FRα CTC analysis described here demonstrated that it was feasible to quantitate both the proportion of CTCs that were FRα+ and the level of FRα expression in the CTC population. Both the proportion of FRα+ cells and the level of FRα expression on those cells may have clinical implications as, for example, in HER2 positivity in breast cancer where the percentage of positive cells and the degree of positivity dictate eligibility to anti-HER2 therapy.
In conclusion, we have demonstrated a custom approach to enrichment and identification of CTCs using ApoStream® coupled with an immunofluorescence staining procedure including a tumor-specific marker, FRα MAb 26B3, in addition to the conventional CK, CD45, and DAPI markers. Our method allowed for differentiation across tumor types based on phenotypic expression of FRα on CTCs. Incorporation of this assay into future clinical studies may provide not only information on the efficacy of investigational anticancer agents (eg, change in FRα+ CTC count before and after dosing) but also be used to detect FRα expression levels in CTCs for patient selection/stratification. Further studies are warranted to determine the correlation between FRα levels on CTCs and clinical outcome. This approach is presently being investigated in a phase 2 clinical setting in NSCLC adenocarcinoma patients treated with farletuzumab (ClinicalTrials.gov Identifier: NCT01218516).
Author Contributions
Conceived the study, analyzed the data, drafted the manuscript, reviewed the manuscript, and approved the final manuscript: DJO. Designed the experiments, generated and reviewed the data, drafted the manuscript, and approved the final manuscript: DWD. Reviewed and analyzed the data, drafted the manuscript, and approved the final manuscript: KA. Reviewed the data, drafted the manuscript, and approved the final manuscript: EBS.
Footnotes
Acknowledgments
The authors wish to acknowledge the assistance of Leslie Palmer and Jennifer Werkheiser in the preparation of this manuscript.