
Abstract
Urine proteome is a potential source of information in renal diseases, and it is considered a natural area of investigation for biomarkers. Technology developments have markedly increased the power analysis on urinary proteins, and it is time to confront methodologies and results of major studies on the topics. This is a first part of a series of reviews that will focus on the urine proteome as a site for detecting biomarkers of renal diseases; the theme of the first review concerns methodological aspects applied to normal urine. Main issues are techniques for urine pretreatment, separation of exosomes, use of combinatorial peptide ligand libraries, mass spectrometry approaches, and analysis of data sets. Available studies show important differences, suggesting a major confounding effect of the technologies utilized for analysis. The objective is to obtain consensus about which approaches should be utilized for studying urine proteome in renal diseases.
Definitions and Area of Interest
Urine is an ideal site for studying possible biomarkers of human diseases. Sampling of urine is particularly easy and can be repeated over time and, for this reason, tests on urine can be utilized to monitor clinical outcome and effects of drugs. Our objective is to find a reproducible indicator of an event or a measure of a process that may have pathological implications, namely, end products of metabolic pathways, molecules involved in intermediary phases, intracellular components, circulating proteins, and antibodies, which can be utilized for this purpose. The premise is that many of the above molecules and proteins of limited size deriving from circulation can be detected in normal urine; in addition, several proteins deriving from the renal tubule and from the downstream urinary tract are also excreted into urine independent of their size and altogether constitute the normal urine proteome. In pathological conditions, there are modifications of urinary protein composition correlated with changes of the glomerular basement membrane integrity (eg, deposition of autoantibodies, alteration of the slit-diaphragm, etc.) or simply reflecting a perturbation of global renal function as might be typically and unselectively occurring in chronic conditions. Before considering how renal pathologies modify urinary excretion of selected biomarkers, it is crucial to define composition of normal urine proteome and discuss how technology differences may modify this aspect. This is the objective of the first review of this series. Other two reviews will consider urine proteome in several groups of renal diseases, including idiopathic nephrotic syndrome, primary and secondary glomerulonephritis, and diabetes mellitus (review 2) and cystic renal diseases, congenital anomalies of the kidney and the urinary tract, and tubular disorders (review 3). The objective is to discuss the methodological approach to both normal and pathological urine in order to define biomarkers to be utilized in clinical settings.
Urine proteome
Proteins that are detected in urine and derived from the outside (plasma) and inside (glomerular and tubular cells) of the kidney according to physiological roles constitute the basis of renal function. In particular, plasma proteins are subject to a selective process of ultrafiltration based on their dimension, charge, and configuration.1,2 Studies originally performed in the early 80s showed that proteins with a molecular mass up to 67 KDa are readily filtered at the glomerular level, but, in some cases, the anionic charge limits the passage due to repulsion by the glomerular basement membrane. This is, for example, the case of albumin, which has a pI of 4.6 and has a fractional clearance of ~0.001.3–6 The final result of what is known as renal selectivity is that urinary proteins with a size <45 kDa are freely filtered and excreted, whereas, for higher sizes, cationic molecules have a privileged passage compared with anionic components. On the other hand, several proteins are of direct renal and urinary tract derivation: they are mainly proteins endowed in the renal brush border and are, in some cases, produced by tubular epithelia to implement cell defense from bacteria. Fragments of proteins can also be detected in urine: they derive from digestion occurring partially in the urine but, as in the case of albumin, digestion may occur in circulation and represents a still poorly characterized phenomenon.7,8 On the other hand, there is a general consensus that many peptides of small size deriving from plasma are present in urine: they represent a distinct universe from proteins and may have an important pathological significance. Specific technology approaches are utilized for their detection, and for this reason, studies on urinary peptides are usually presented separately from proteins. An appropriate discussion on urinary peptides requires, for their importance and significance, a dedicated review.
Microvesicles/exosomes
Some proteins are excreted as part of microvesicles and exosomes that can be defined as supramolecular organization systems containing many proteins that derive from both circulation and tubular cells. Microvesicles and exosomes are obtained by centrifugation/ultracentrifugation of urine (ie, 17,000 × g for microvesicles and 100,000 × g for exosomes) and represent separate compartments of the urine proteome. Compartmentalization of excreted urinary proteins according to the above concepts indicates that 49% of urinary proteins are soluble, 48% sediment at low speed (vesicles), and 3% are exosome. 9
Microvesicles (100–1000 nm in diameter) are intracellular products of cells that are released to the extracellular space by outward budding of plasma membrane. 10
Exosomes are smaller than microvesicles in size (30–100 nm in diameter)11–13 and originate through invagination of the plasma membrane into endosomes. Once formed, exosomes are released in the extracellular compartment.14,15 Microvesicles and exosomes are identified for their protein composition: the former contain B1 integrin, metalloproteinases, and glycoproteins (GPI, GPII, GPIII, P-selectin), while exosomes are characterized by heat shock protein 70 and tetraspanins (CD63, CD81, and CD9). 16 Besides proteins, microvesicles and exosomes contain lipids, mRNAs, and miRNA, a variety that suggests different functions such as immune modulation, transport of proteins, and cell-to-cell communication. In particular, urinary exosomes transport immune proteins with direct antimicrobial and viral activities that are considered crucial for sterility of urinary tract. 17
Technical Approaches
Here, we present a list of technical issues on urine proteome analysis that need to be defined at this initial step because lack of clarity on these aspects would introduce variability in results. This review would represent a proper site to begin a discussion on technical aspects related to urine preparation and protein analysis; the aim is to get a consensus prior to starting the analysis of urine proteome in pathological conditions.
Sampling and storage of urine
There is consensus about sampling second morning urine that are added with tablets of protease inhibitor immediately after collection, chilled on ice, and centrifuged at 4 °C for 10 minutes at 1000 × g to eliminate cell debris. This approach is in accord to standard protocols and, in particular, with the protocol proposed by the European Kidney and Urine Proteomics consortium (for details, see at http://www.eurokup.org). Samples can be stored at −80 °C until use.
Prefractionation
Methodologies based on sample pretreatment and prefractionation have been developed over years. The aim is to subfractionate supramolecular structures containing proteins (ie, microvesicles and exosomes) and eliminate proteins with very high concentration levels in urine (eg, uromodulin). Centrifugation (with or without dl-dithiothreitol) at 100,000 × g for 120 minutes in an isolation solution of 30% sucrose is the basic method.18–20 Microvesicles are isolated from the supernatant by centrifugation at 17,000 × g for 75 minutes at 12 °C. Exosomes are prepared from the supernatant deriving from the 17,000 × g centrifugation step and are isolated by ultracentrifugation at 100,000 × g for 120 minutes at 12 °C. The yield is ~2 μg of exosome proteins for a milliliter of urine. 9 Details for preparing exosomes are given in a series of reports and are summarized by Alvarez et al. 18
There are drawbacks with the ultracentrifugation procedure mainly represented by the difficulty in handling high numbers of samples. In this case, an alternative is to precipitate exosomes with ExoQuick-TC, which is a simple and fast approach but unfortunately lacks specificity.21–23
A parallel aim of prefractionation is to minimize protein overload and achieve a sort of normalization of relative concentrations, a procedure also known as equalization. With this approach, low-abundant components are taken at the same levels of high-abundant proteins, thus avoiding overload of a few selected components and allowing detection of minimal components. Combinatorial peptide ligand libraries (CPLLs) are an example of technology aimed to achieve this objective.24–27 They consist of different mixtures of peptides with different lengths (six amino acids each), 28 one of which at the distal site represents the bait, while the proximal backbone modulates interactive forces. Specificity of single peptides for specific proteins is not absolute, but it is the result of a series of factors, varying from temperature, pH, and ionic strength of the medium that can be experimentally determined. CPLLs are utilized starting from supernatants deriving from ultracentrifugation (100,000 × g), which are loaded onto a column of 150 μL peptide library beads (ProteoMiner™) equilibrated in 25 mM phosphate buffer, pH 7.4. 29 The eluate in Tris-Sodium dodecyl sulfate (SDS) (CPLL beads) and the unbound fraction are preserved at −80 °C until analysis by mass spectrometry (MS).
Overall, technologies based on prefractionation represent an important option to implement specificity of analysis due to removal of proteins contained in microvesicles and exosomes and increase sensitivity in the case of equalization. A flowchart for prefractionating urine proteins is presented in Figure 1, where most of the steps presented above are included. This is a personalized approach utilized in our laboratory that we present and confront with other approaches utilized in other laboratories. Based on the performance of the composite analysis of urine proteome (see the dedicated section on ȁNormal urine”) and looking at the cost/benefit, we consider this flowchart as a practical option for urine proteome analysis in pathological states.

Proposed flowchart for analysis of the urinary proteome. Urine is centrifuged to separate cell debris. Then, microvesicle and exosome fractions (17,000 and 100,000 × g, respectively) are purified. The supernatant is ultracentrifuged and treated with Proteominer. The five fractions thus obtained (untreated, microvesicles, exosomes, unbound, and CPLL beads) are processed by MS analysis.
Mass spectrometry
Several MS technologies have been developed in recent years; their analytical performance differs in terms of reproducibility, dynamic range, limit of detection, and resolving power.30,31 They have been widely utilized for the identification of the protein components of the kidney and urinary tract. 32
Matrix-assisted laser desorption ionization-time-of-flight and electrospray ionization after 2DE separation of proteins have been the MS techniques of choice in the past and were, in particular, utilized for characterization of single spots. These approaches have limitations now: they are time consuming, present variability, and are of low sensitivity since protein recovery is limited by protein staining.
Direct MS analysis of urine without purification of single protein is now the preferred approach since it has the real advantage that preliminary steps are not necessary. In this case, proteins are recognized by utilizing isobaric tags (Iso-baric tags for relative and absolute quantitation [iTRAQ] and Tandem mass tags [TMT]) or, in alternative, are not labeled prior to analysis, but are recognized based on the technologies that are reported as label free (label-free quantification [LFQ]or Data-independent acquisition [DIA]). In the former case (ie, isobaric labeling), each sample is derived with a different isotopic variant of mass tag, and then all samples are pooled and analyzed simultaneously. Different peptides appear as single peaks with different m/z values. This technology has been successfully utilized for comparative analysis in numerous experimental contexts. On the other side, the label-free protein quantification approach is based on two types of measurements. In the first case, the intensity of each peptide deriving from fragmentation of proteins is evaluated by dedicated softwares (eg, MaxQuant, OpenMS, and DeMix-Q). In the second case, the peak area or the spectral counting in the MS/MS analysis relative to a peptide is determined. There are several advantages in the label-free quantification modes. They are, in fact, cheaper compared with the labeling techniques, simpler in terms of sample preparation, and less complicated in terms of MS/MS analysis. Redundancy in peak detection, low sensitivity, and the crucial point that they are only semiquantitative limit the impact of these techniques that cannot be utilized for low abundance and small proteins.
More recently, methods that utilize instruments operating in parallel reaction monitoring modes,33–36 such as triple quadrupole (QQQ) and/or high-resolution accurate mass, have been developed and utilized for validation of protein biomarkers. Besides presenting an increased selectivity and sensitivity (eg, >1000 peptides in a single Liquid chromatography (LC)-MS/MS run identified by Orbitrap mass spectrometer), these methods allow major flexibility in data processing and an increased confidence in identifications. 37
Sample design and data analysis
Comparative proteomics has the objective to compare protein expression profiles in different clinical conditions. Bioinformatics data analysis is a crucial aspect due to an extremely large amount of information deriving from MS. A good sample design is the first step of any experimental approach and requires an a priori protocol for the estimation of the number of biological and technical replications necessary for the analysis. It should be large enough to ensure a high probability to detect differences while being relatively small to contain costs. To calculate the sample size, it is necessary to fix both significance level and power of the desired test (usually P = 0.05 and β = 80%). 38
Before data analysis, results from MS must be normalized to minimize systematic errors across different experimental runs. 39 Once this is done, a classical statistical approach is necessary to test the original hypothesis that one or more biomarkers characterize a given disease. Biomarker definition requires the demonstration that one protein is differently concentrated in urine of different populations (ie, normal versus disease/treatment). Classical univariate parametric and non-parametric tests are used in this context, including t-test, ANOVA, Mann-Whitney U test, Wilcoxon test, and Friedman test. 40 Multivariate methods should be used to reduce complexity of a data set. 41 A combination of univariate and multivariate analyses maximizes the information in most cases. A detailed description of these tests is out of the scope of this review and we remand to dedicated books.
Several techniques are now utilized for presenting results. In case of comparison between groups, volcano plot is the most widely used graphical expression that gives a quick glance of results based on univariate statistical tests. In this graphical representation, the log2 of the fold change for each protein/peptide is plotted against the –log10 of its P-value. Heat map and two-/three-dimensional scatter plots of principal component analysis (PCA) are two graphical representations complementary to multivariate cluster analysis. PCA generates new components that condense the variability of the samples. Each component in PCA is not correlated with another but is considered alone and extracted from the mixture to see how much it contributes to the systematic variation in the dataset. The plot of principal components furnishes an optical view of the structure of the data and allows defying sample clusters and identifying outliers. We recommend to start with PCA and Pearson's or Spearman's correlogram (using Euclidean distance aggregation method) to define the outliers (quality control) and later on, when the outliers are removed, to use PCA to define the biological interest of each variable. The Venn plot is an easy and descriptive way to compare results from different studies and gives a rough idea of how much the composition of urinary proteome varies by comparing data from different authors (Figs. 2A and B).

(A) Venn diagram reporting the seven studies that constitute the main part of knowledge on urine proteome. This diagram shows the number of total and unique nonredundant proteins reported in different studies.45,49–54 In the middle of the diagram is reported the number of proteins shared by all the studies. With respect to our data, 53 we report only proteins with a peptide ID of 1% false discovery rate, at a peptide mass deviation of 10 ppm and a minimum of six amino acids per identified peptide. (B) Venn diagram showing how many proteins are separated by the multistep procedure described in this report that represents a simplification of what was already described by Santucci et al. 53 Utilizing this approach, 3004 nonredundant proteins can be detected in normal urine most of which are present in more than one purification fraction; a considerable part of proteins can be detected in exosomes (762), followed in order of importance by CPLL beads (386) and the unbound to CPLL (368).
Dedicated software simplifies the analysis results, and statistical packages are freely available at http://www.r-project.org/; we remand to a dedicated literature for a more extensive and comprehensive reading.
Current Knowledge, Limits, and Perspectives
Single biomarker/system biology
Years of study in the field of renal diseases have indicated that several urinary biomarkers are useful for early diagnosis of acute kidney injury and highlighted the concept that systems biology/omics and single biomarker approaches will continue to be two important wheels to understand the pathophysiology of renal disorders. Genetic conditions modifying single proteins are an example of how a single biomarker may characterize a disease. On the other hand, complex pathways are more likely involved in diseases that produce global changes and modify urinary protein composition. Proteomics generates large volumes of data, and the combined use of information can lead to the understanding of complex biological processes and pathological mechanisms. Definition of interactive networks in protein pools is a new frontier of research on mechanisms of diseases and biomarkers. In the presence of a large amount of information, functional analysis of a mixture of proteins is carried out using the Gene Ontology (GO) annotation. The GO annotation provides a qualitative abstraction of cellular components and molecular and biological functions. There are various softwares such as Cytoscape (www.cytoscape.org) that allow the GO annotation analysis of the main biological processes of proteins contained in normal healthy urine (Fig. 3). Cytoscape follows a simple work flow and utilizes applications such as ClueGO, KEGG, REACTOME, and WikiPathways that are available as plug-in in the software. Cytoscape starts with data import that builds the interactive protein network identified by univariate/multivariate analysis; then, the second step consists in matching data with one of the public databases; this generates an interactive network among proteins that are linked by nodes and edges according to potential interaction (eg, physical, colocalization, coexpression relationship, pathways, etc.). The values of these attributes are determined during the analysis of the network (third and final step). In addition, the user may optionally filter the resulting network to reduce their complexity by selecting the type of network information of interest, thus identifying pivotal proteins. Comparison between normality and pathological states requires envisaging a panel of molecular functions and cellular processes potentially involved in a particular disease. The interactions between proteins can be established using network analysis (Ingenuity Pathway Analysis [IPA]), which are generated using the knowledge of the literature data. The network analysis allows establishing the hubs of network and their potential points of regulation and has the scope to highlight the biological pathway activated in a pathology.
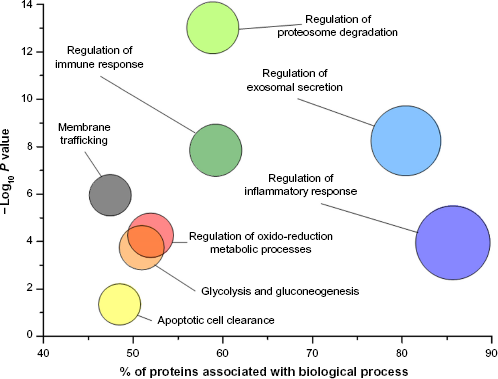
GO analysis of proteins purified from urine according to the scheme of Figure 1. The graph shows the main biological processes (circles) plotted against the – Log10 P where P-value indicates the probability, after false discovery rate correction, that components of a biological process are present in urine; it is calculated on the basis of the number of proteins identified and their interaction considering the data of the literature.
Repositories and peptide atlas
A repository of data on composition of urinary proteins is available in ProteomeXchange (ie, PX), 42 which is a consortium of three public databases of peptide sequences (ie, PRIDE, MassiVE, and PASSEL). They provide a sufficient set of experimental data and operate under a common standardization procedure and can be viewed in ProteomeCentral (http://proteomecentral.proteomexchange.org). PASSEL and PRIDE 43 also contain data for protein identification. Starting from 2004, other public databases (Global Proteome Machine Database, 44 Peptide-Atlas, 45 MOPED, PaxDb, and Human Proteinpedia) that originally focused on plasma proteome collected data on kidney and urinary proteins 46 ; these databases represent a further source of information.
There are ongoing projects that will add knowledge and focus on structure, functions, and implication of single proteins in pathological processes: Uniprot 47 and neXtProt 48 are two examples of generic databases. The Human Kidney and Urine Proteome Project (www.hkupp.org) and the Kidney and Urinary PathwayKnowledge Base (KUPKB, www.kupkb.org) are focused on urine and kidney proteins and also contain pathological processes.
Normal Urine
A clear definition of normal urine composition represents the basis of any project on urinary biomarkers of diseases. It has been the subject of recent studies that overall incorporated most of the methodological issues discussed in the preceding sections. There is no uniformity of results mainly due to difference in methodological approaches. The final choice would be a balance between sensitivity (more proteins mean more potential biomarkers), reproducibility, and costs. Few studies reporting data on urinary proteome composition in normal conditions have been published so far. Overall and considering the relevance of results (ie, number of proteins), seven studies45,49–54 have been found in the literature. With the exception of the study by Santucci et al. 53 , who utilized a multistep procedure, the remaining studies presented data on urinary proteome obtained by direct analysis of urine by MS or by SDS-PAGE as a prefractionating step. The number of proteins described in different reports varies from 559 to 3429, only a minimal part of which (108 proteins) is shared by different studies (Fig. 2A). There are, by contrast, many proteins described autonomously by single reports varying from 32 in the paper by Nagaraj and Mann 52 to 1.454 as described by Santucci et al. 53 ; 1.716 new proteins are described in the five other studies.45,49–51,54 Details on urinary proteome composition as reported by different authors can be found in databases published in related papers.
The best performance has been obtained by prefractioning and equalizing urine that clearly represents a complication of the method but allows to separate, in a first instance, microvesicles and exosomes from soluble proteins and then to detect low expression components. Based on the multistep procedure described by Santucci et al, we propose here a modular approach that consists of four steps (Fig. 2B) that overall give the chance to detect 3004 nonredundant proteins in normal urine. Considering exclusive proteins, it appears that most are contained in exosomes (762), followed by CPLL beads (386). The untreated fraction contains 1176 proteins, only a minor part being exclusively detectable there. This means that the major part of exclusive proteins can be detected in exosomes and CPLL beads (ie, 1148 overall). This is shown in the Venn plot presented in Figure 2B that summarizes the complex compartmentalization of proteins following the procedure presented here. Studies on pathologies should consider the results mentioned above and be programmed in terms of performance of the different approaches. In particular, it must be considered that the procedure presented here is modular and gives the opportunity to analyze 90% of exclusive proteins utilizing a three-step fractioning approach (ie, exosomes, CPLL-beads, and unbound) and can be utilized also in a single step.
Unfractionated urine/SDS-PAGE
The number of proteins contained in unfractionated urine is reported by four out of seven authors. There are important differences between the studies: the best performance was obtained by Farrah et al. 45 , followed by Li et al. 50 and Santucci et al. 53 Prefractionating urine with SDS-PAGE gave little advantage. As reported above, only 108 proteins have been described by all studies, implying that most are new proteins.
Exosomes/vesicles
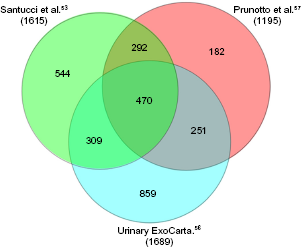
The composition of urinary exosomes is reported in the database ExoCarta (http://www.exocarta.org), 55 which is a public database in constant evolution; the last update has been done in 2015. 56 Besides ExoCarta, urinary exosomes have been characterized in two studies53,57: overall, they described the presence of 2707 proteins in exosomes and included the original panel of 1689 proteins published in ExoCharta plus 1615 proteins described by Santucci et al. 53 and 1195 by Prunotto et al. 57 ; 292 are common to the last two studies (Fig. 4). It is of note that exosomes contain 762 exclusive proteins (Fig. 2B), supporting the concept that their separation from other urinary compartments is essential for a correct approach to the urine proteome.
CPLLs
Equalization of urinary proteins can be done when a sufficient amount of urine is available (ie, 50 mL of starting material). It is obtained by utilizing CPLLs following well-defined experimental conditions. While the number of proteins recovered with CPLLs is a notable one (ie, 1488), the contribution as unique proteins is only partial (ie, 386).
Interactive Netwok in Normal Urine
In normal urine, there are some notable groups of proteins with similar functions (Fig. 3). The most relevant are regulatory proteins involved in basic functions, such as immune and inflammatory responses and proteosome activity. It seems reasonable to have some hopes to define pathological processes on the basis of this panel.
Final Consideration on Methodology for Urine Proteome Analysis
A clear message arising from the above discussion is that there is quite a variability in the number of proteins described in normal urine by different reports. While some race variability cannot be excluded, modification due to gender has been evaluated in single reports that cannot explain the results. The laboratory approach is, therefore, mainly responsible for this variability, and we must be extremely determined in discussing single aspects. The first point is to define which urine sample must be analyzed. Shared guidelines written by Human Proteome Organization (HUPO) are available that should be utilized by all authors (www.hkupp.org). A second aspect is the choice of a single- or a multistep procedure. We propose a simple flowchart that starts with analysis of untreated urine samples (see for details Fig. 1), followed by ultracentrifugation and analysis of exosomes. Microvesicles can be analyzed at this step as well. Equalization should be considered and reserved to specific studies, in which patients allow to collect at least 50 mL of fresh normal urine in the second morning spot. The reasons are that this is not an easy procedure; it is time consuming and cannot be utilized in studies enrolling many patients and probably in small children.
Author Contributions
Conceived and designed the experiments: LS, MB, GC. Analyzed the data: MB, AP. Wrote the first draft of the manuscript: GMG. Contributed to the writing of the manuscript: MB, AB. Agreed with manuscript results and conclusions: LS, MB, GC, FL, AP, AB, GMG. Jointly developed the structure and arguments for the paper: GMG, LS, MB. Made critical revisions and approved the final version: AB. All the authors reviewed and approved the final manuscript.
Footnotes
Acknowledgment
Istituto Giannina Gaslini provided logistic and financial support.