
Abstract
Application of acute therapies such as thrombolysis for ischaemic stroke (IS) is constrained because of diagnostic uncertainty and the dynamic nature of stroke biology. To investigate changes in blood proteins after stroke and as a result of thrombolysis treatment we performed label-free quantitative proteomics on serum samples using high-resolution mass spectrometry and long high-performance liquid chromatography gradient (5 hours) combined with a 50-cm column to optimise the peptide separation. We identified (false discovery rate [FDR]: 1%) and quantified a total of 574 protein groups from a total of 92 samples from 30 patients. Ten patients were treated by thrombolysis as part of a randomised placebo-controlled trial and up to 5 samples were collected from each individual at different time points after stroke. We identified 26 proteins differently expressed by treatment group (FDR: 5%) and significant changes of expression over time for 23 proteins (FDR: 10%). Molecules such as fibrinogen and C-reactive protein showed expression profiles with a high-potential clinical utility in the acute stroke setting. Protein expression profiles vary acutely in the blood after stroke and have the potential to allow the construction of a stroke clock and to have an impact on IS treatment decision making.
Introduction
Stroke, of which ischaemic stroke (IS) is the most common form, is a leading cause of death and disability. 1 Thrombolysis with recombinant tissue plasminogen activator (rt-PA) given within the first 4.5 hours of onset is the most specific and biologically powerful treatment for acute IS.2,3 Unfortunately, thrombolysis is only received by only a small proportion of patients with stroke. This is mainly because of uncertainty about diagnosis, time of onset, and the perceived risks of cerebral bleeding these entail.4–8 Even in specialised centres, these limits mean that fewer than 15% of patients with ischaemic stroke are treated with thrombolysis.7,9–11
Neuroimaging biomarkers are widely used to aid in the diagnosis of stroke, to characterise its type, to assist in determining a likely cause, to estimate the severity, and to predict functional outcome and risk of recurrence. Computed tomography (CT) detection of bleeds is critical for the use of rt-PA,2,12 and penumbral imaging by CT perfusion (CTp) and magnetic resonance imaging (MRI) are increasingly used to select patients with an ischaemic penumbra likely to respond well to thrombolysis.13,14 Perfusion-weighted imaging (PWI) in combination with diffusion-weighted imaging (DWI) is thought to identify this ischaemic but potentially salvageable tissue in acute ischaemic stroke.15,16 However, CTp and MRI do not provide all the information needed for patient care and their use is limited by availability, patient contraindications, and cost.
Early identification of salvageable brain tissue without the resource constraints of imaging would allow patients to be treated earlier (for example, in the ambulance) and improve stroke outcome. Likewise, identification of patients at risk of bleeding after thrombolysis treatment and identification of patients who would respond well to rt-tissue plasminogen activator (tPA) therapy would further improve patient outcomes. Biomarkers of disease evolution detected in blood could provide these improvements. Biomarkers acting as a stroke clock would help to determine stroke onset time and be particularly valuable for patients who wake up with stroke (which represents up to 25% of all IS) and who are currently ineligible for rt-PA therapy.6,17,18
To date, biochemical biomarker studies have focused on confirmation of stroke diagnosis and particularly on differentiation between ischaemic and haemorrhagic strokes19–24 or on using biomarkers as tools for outcome prediction.25–29 Although many candidate blood-based biomarkers for IS have been hypothesised, none are currently used in clinical practice.30–32
The use of mass spectrometry (MS) in the quest to identify biomarkers, particularly proteins or peptides, for clinical use has increased dramatically during the past decades. 33 Importantly, once identified, immunologically based assay systems (such as enzyme-linked immunosorbent assays [ELISAs]) offer the rapid detection needed for practical decision making.
A number of plasma or serum protein biomarkers have already been successfully introduced into clinical practice. These include the myocardium-specific structural protein troponins, B-type natriuretic peptide, and D-dimers for the exclusion or diagnosis of myocardial infarction, congestive heart failure, or pulmonary embolism, respectively.34–36
Proteomics studies have been performed specifically regarding study IS using a range of different body tissues including cerebrospinal fluid, microdialysates, brain tissue, or urine but more rarely in blood.29,37–42
Biomarkers that are detectable in blood are ideal due to the ease of collection and the fact that blood composition changes rapidly in response to disease. 43 However, proteomic analysis on blood-derived products such as serum is extremely challenging due to the high dynamic range of proteins present. Despite these challenges, the apolipoproteins, ApoC-I and ApoC-III, detected by MS in plasma have been reported as biomarkers able to differentiate IS from haemorrhagic strokes.44,45 In addition, Zhang et al reported a panel of 13 markers for diagnosis of stroke identified by comparing plasma from patients with acute cerebral infarction and control subjects using surface-enhanced laser desorption/ionisation time of flight (SELDI-TOF) MS. This panel showed a sensitivity of 84.4% and a specificity of 95% to discriminate the 2 groups. 46 In a similar experiment, Huang et al 47 identified serum-free haemoglobin as a potential biomarker for the diagnosis of IS (sensitivity of 70.2% and specificity of 85.3%) and MS was also used to identify PBP (platelet basic protein) as a candidate serum biomarker for transient ischaemic attack. 48
Here, we report the MS analysis of blood samples sequentially collected from a cohort of patients with stroke with imaging and functional follow-up and after rt-PA treatment. In this proof-of-principle study, we demonstrate that advanced proteomic technology can be used in the quest of stroke biomarkers in a clinical setting.
Methods
Sample collection and selection
Samples were obtained from patients with stroke who were recruited in the EXtending the time for Thrombolysis in Emergency Neurological Deficits (EXTEND) trial.
The EXTEND trial is an ongoing randomised, multicentre, double-blinded, placebo-controlled phase 3 study combining clinical and imaging criteria to select a population more likely to benefit from the advantages of tPA when given after the traditional 4.5-hour time window (in comparison with patients treated with standard stroke care). Trial protocol, inclusion, and exclusion criteria were previously published. 49 Patients with a known stroke onset time and randomised in the EXTEND treatment arms were selected for study.
For each patient, samples were planned to be collected immediately after imaging (baseline), immediately before treatment administration (T0), 12 to 24 hours after treatment administration (T12-24h) and at 3 days (T3d), 90 days (T90d), and 12 months (T12m) after stroke.
For biomarker analysis, 5 mL of venous blood were collected for each time point. The serum was separated, centrifuged at 1500g for 10 minutes and stored at −80°C. Samples were processed and frozen within 1 hour from the initial collection time.
Clinical data including age, sex, stroke type according to the trial of ORG 10172 in acute stroke treatment (TOAST) classification, presence of parenchymal haemorrhage (PH), and detailed past medical history were recorded. Imaging (by CTp or MRI) was performed on admission and PWI and DWI volumes were measured. Stroke severity was assessed using the National Institutes of Health Stroke Scale (NIHSS) score. Functional outcome was evaluated at 3 months after the event by means of the modified Rankin scale (mRS).
Written informed consent was obtained from all study participants or relatives. The study conformed to the principles of the Declaration of Helsinki and was approved by the ethics committees of the different involved institutions.
Sample preparation
In-solution trypsin digest for proteomics
About 10°μL of serum from each patient was first stabilised in 100 μL of 8 M urea, pH = 8.3, and stored at −80°C until used. For proteomic analysis, the stabilised samples were randomised by batches of 16 and processed as follows: 20 μL protein solution was added to 90 μL of 8 M urea, pH = 8.3, and reduced for 5 hours with 1 μL of 200 mM tris(2-carboxyethyl)phosphine. After this, samples were alkylated for 1 hour at 25°C in the dark with 4 μL of 1 M iodoacetamide. Digests were performed overnight (37°C) by addition of 1 μg of trypsin (Promega, Madison, WI, USA) and 900 μL of 50 mM Tris, pH = 8.3, followed by a second digestion step with 1 μg trypsin and an additional incubation of 4 hours at 37°C.
Solid-phase extraction cleanup of tryptic peptides
About 200°μL of the digested solution was collected and dried by SpeedVac centrifugation. The digested proteins were resuspended in 100 μL of 1% (v/v) formic acid and centrifuged at 14 000 rpm for 2 minutes. The solid-phase extraction was performed with Empore reversed-phase extraction disks (SDB-XC reversed-phase material, 3M, St. Paul, USA) according to Ishihama et al 50 with the following modifications: the membrane was conditioned with 50 μL of 80% (v/v) acetonitrile, 0.1% (w/v) trifluoroacetic acid, and then washed with 50 μL of 0.1% trifluoroacetic acid before the tryptic peptides were bound to the membrane. The bound peptides were eluted by 50 μL 80% (v/v) acetonitrile, 0.1% (w/v) trifluoroacetic acid, and dried in a SpeedVac centrifuge.
Electrospray ionisation and liquid chromatography tandem MS conditions
Peptides (2 μL) reconstituted in a final volume of 10 μL 0.1% trifluoroacetic acid and 2 % acetonitrile (buffer A) were loaded and washed onto a trap column (C18 PepMap 100-μm i.d. × 2 cm trapping column; Thermo Fisher Scientific, Waltham, MA, USA) at 5 μL/min for 6 minutes before switching the precolumn in line with the analytical column (Easy-Spray 75-μm i.d. × 50 cm; Thermo Fisher Scientific). The separation of peptides was performed at 250 nL/min using a linear acetonitrile gradient of 2 buffers: buffer A (0.1% formic acid, 2% acetonitrile) and buffer B (0.1% formic acid, 80% acetonitrile), starting from 5% buffer B increasing to 60% over 300 minutes. Data were collected on an Orbitrap Elite (Thermo Fisher Scientific) in data-dependent acquisition mode using mass to charge ratio (m/z) 300 to 1500 as MS scan range. Collision-induced dissociation (CID) tandem MS (MS/MS) spectra were collected for the 20 most intense ions. The dynamic exclusion parameters used were repeat count 1, duration 90 seconds, and the exclusion list size was set at 500 with early expiration disabled. Other instrument parameters for the Orbitrap were as follows: MS scan at 120 000 resolution, maximum injection time 150 ms, automatic gain control (AGC) target 1 × 10⁶, and CID at 35% energy for a maximum injection time of 150 ms with AGC target of 5000. The Orbitrap Elite was operated in dual analyser mode with the Orbitrap analyser being used for MS and the linear trap being used for MS/MS.
Protein identification and label-free quantitation
Identification and label-free quantitation of proteins across all 92 samples were performed using MaxQuant version 1.5.0.30. 51 All raw data and complete details of MaxQuant parameters and result files have been deposited in ProteomeXchange and are available with accession number PXD003218. Identification of peptides and proteins was performed internally by MaxQuant using the Andromeda 51 search engine to search against all reviewed and unreviewed human proteins in the Uniprot database (July 2014). Common contaminants and decoys were included automatically by Andromeda. Prior to searching, MS/MS spectra were filtered by retaining only the top 8 peaks per 100 Da. Precursor mass tolerance was set to 5 ppm (after precursor refinement) and MS/MS tolerance to 0.5 Da. Carbamidomethylation of cysteines was set as a fixed modification, and N-term acetylation and oxidation of methionine were included as variable modifications. Up to 2 missed cleavages were allowed, and peptides were required to be at least 7 amino acids in length. False discovery rate (FDR) cut-offs for both peptides and proteins in the database search were set to 1%. Both unique and razor peptides (peptides shared by different proteins of a group) were used for quantitation with a minimum of 2 peptides including at least 1 unique peptide required to calculate a protein quantitative value. The ‘match between runs’ setting in MaxQuant was used to transfer peptide identifications from one run to another on the basis of matching retention time and mass to charge ratio.
Statistical analysis
Protein group intensity values calculated by MaxQuant (in proteinGroups.txt) were used for all further statistical analysis in R. 52 Data were analysed using different statistical models to investigate whether relative protein abundance (1) changed with time after stroke onset, (2) differed between patients with different extents of stroke based on imaging results, (3) responded differently to treatment, and (4) differed between patients with different outcomes after stroke. Regardless of the statistical model used, the limma package was always used to fit the model and perform the following processing tasks. 53 Intensity values were always normalised using cyclic loess normalisation, 54 and the method of Ritchie et al 55 was used to calculate sample reproducibility and down-weight less reproducible samples. After initial model fitting, empirical Bayes was used to calculate moderated test statistics, 56 and Benjamini-Hochberg correction was applied to adjust P values for multiple testing. Missing values were simply excluded from the analysis with degrees of freedom adjusted accordingly.
For the time course analysis: 19, 15, 20, 19, and 10 patient samples were available at time points baseline, T0 (prior to treatment), 12 to 24 hours, 3, and 90 days after treatment, respectively. Although the T0 time point was always after baseline for any particular patient, the 2 time points were overlapped in terms of time since stroke onset. Patient was included as a blocking factor as the same patients were followed for the course of the study. Time was included as a fixed effect, and an adjusted P value was calculated for each protein based on a moderated F test calculated across all time points.
To determine the effect of treatment, we specifically focused on samples immediately prior to and after treatment for each patient. Patient was again used as a blocking factor and both an interaction between time (before or after) and treatment (A or B) was included as a fixed effect.
Results
In January 2014, 25 patients with a known stroke onset time had been randomised in Australia for the EXTEND trials. From these pre-selected 25 patients, 21 had a significant number of blood samples available and were therefore used for this discovery project. Regarding the low number of samples available of this time point (due to patient death, loss of follow-up, or collection time still to happen), the analysis of 12-month sampling was not included in this project. Patients’ characteristics are reported in Table 1.
Patients demographic characteristics for the 21 patients recruited in the EXTEND randomised arm.

Abbreviations: AF, atrial fibrillation; CE, cardioembolic; CTp, perfusion computed tomography; DWI, diffusion-weighted imaging; F, female; HTA, arterial hypertension; LAA, large artery atherosclerosis; M, male; MRI, magnetic resonance imaging; mRS, modified ranking scale; NIHSS, National Institutes of Health Stroke Scale; PH, parenchymal haemorrhage; Periph. vasc. disease, peripheral vascular disease; PWI, perfusion-weighted imaging; SVO, small vessel occlusion; TOAST, trial of ORG 10172 in acute stroke treatment; und/inc, undetermined/unclassified.
Missing data are represented by —.
A total of 83 serum samples from 21 stroke patients were analysed in triplicate for the estimation of the relative abundance of proteins (numbers of samples analysed at each time point are reported in Table 2).
Numbers of samples from the 21 patients recruited in the randomised EXTEND arm analysed, at each time point.

An additional 9 patients (Table 3) were selected from the EXTEND cohort (patients not meeting the inclusion criteria for the randomised trial arms) to enrich the imaging profiles (with extreme values of DWI and PWI volumes). For these 9 additional patients, only the baseline samples were collected and processed.
Patients demographic characteristics for the 9 patients recruited in the EXTEND cohort to enriched the imaging profiles.

Abbreviations: AF, atrial fibrillation; CE, cardioembolic; CTp, perfusion computed tomography; DWI, diffusion-weighted imaging; F, female; HTA, arterial hypertension; LAA, large artery atherosclerosis; M, male; MRI, magnetic resonance imaging; mRS, modified ranking scale; NIHSS, National Institutes of Health Stroke Scale; PH, parenchymal haemorrhage; Periph. vasc. disease, peripheral vascular disease; PWI, perfusion-weighted imaging; SVO, small vessel occlusion; TOAST, trial of ORG 10172 in acute stroke treatment; und/inc, undetermined/unclassified.
Missing data are represented by —.
A total of 614 different protein groups were identified and quantified across our 92 samples at an FDR of 1%. This included 33 common contaminants and 6 decoys (automatically added by the Andromeda search engine), which have been excluded from all further analyses. An overview of the quantitative data is presented as a multidimensional scaling plot in Figure 1 and clearly shows that samples from the same patient tend to be more similar than between patients.
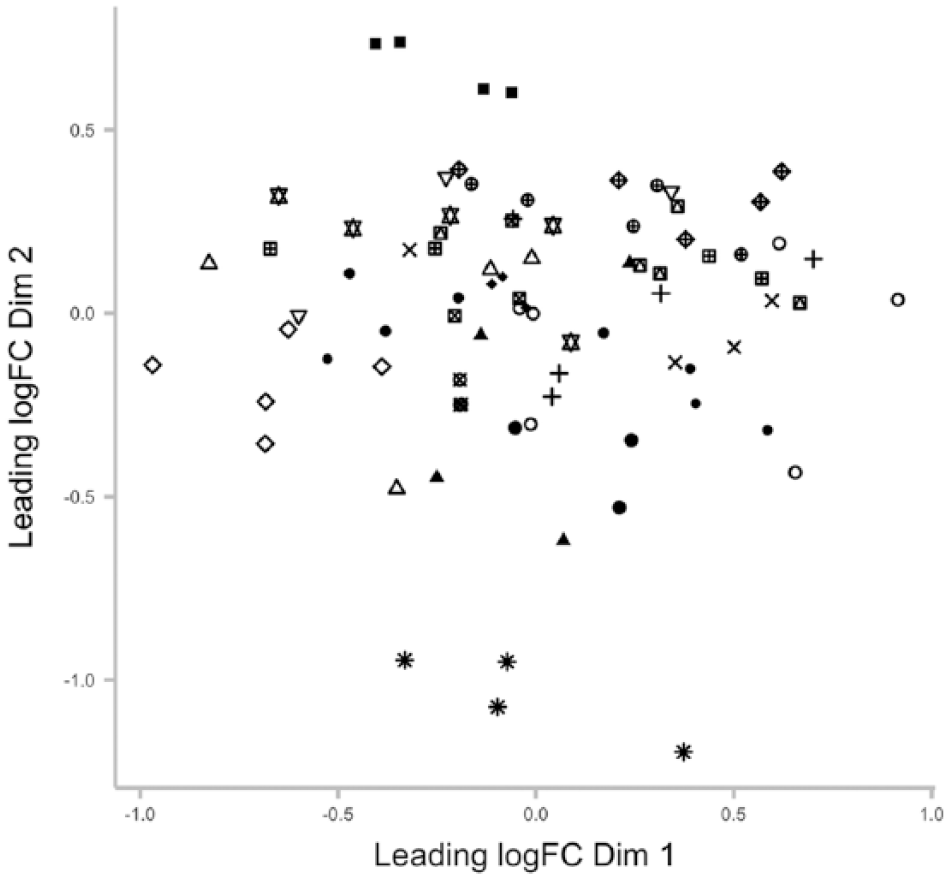
Multidimensional scaling plot showing distances between samples based on top 50 most different proteins between samples. All patients measured at multiple time points are included and distinguished by symbols.
Time
Proteomic profiles over time were investigated using the 83 serum samples collected from the 21 patients randomised into EXTEND. Changes of protein expressions over time were evaluated using Degust, an interactive Web tool for visualising differential gene expression data (http://victorian-bioinformatics-consortium.github.io/degust/). Filtering with an FDR of 10% (FDR ≤ 0.1), 23 molecules were identified as significantly varying over time. A heatmap was generated, showing regulation of these 23 protein expressions over time (Figure 2) and highlighting the strong biphasic nature of some of these protein profiles.

Heatmap of the 23 proteins significantly changing over time. Heatmap showing log fold change for proteins with a significant change in expression as a function of time (adjusted P ≤ 0.1 based on F test). Relative expression values are shown as log 2 fold change relative to the average across all times.
Interesting patterns of proteins expression over time were highlighted in Figure 2 regarding the timing of their expression changes and their potential clinical utility. For example, FIBG and V9HVY1 showed an early significant upregulation (peaking at T0) then gradually decreasing and reaching a level of expression of −2 log of its baseline concentration at 3 months after stroke. The CRP, SAA1, and D3DQX7 presented an expression level gradually increasing after stroke and reaching a peak at 3 days after stroke before drastically decreasing. In contrast, the expression of APOA4 and E3UN46 decreased during the first 3 days after stroke before returning to their baseline value at 3 months after stroke (Figure 3).
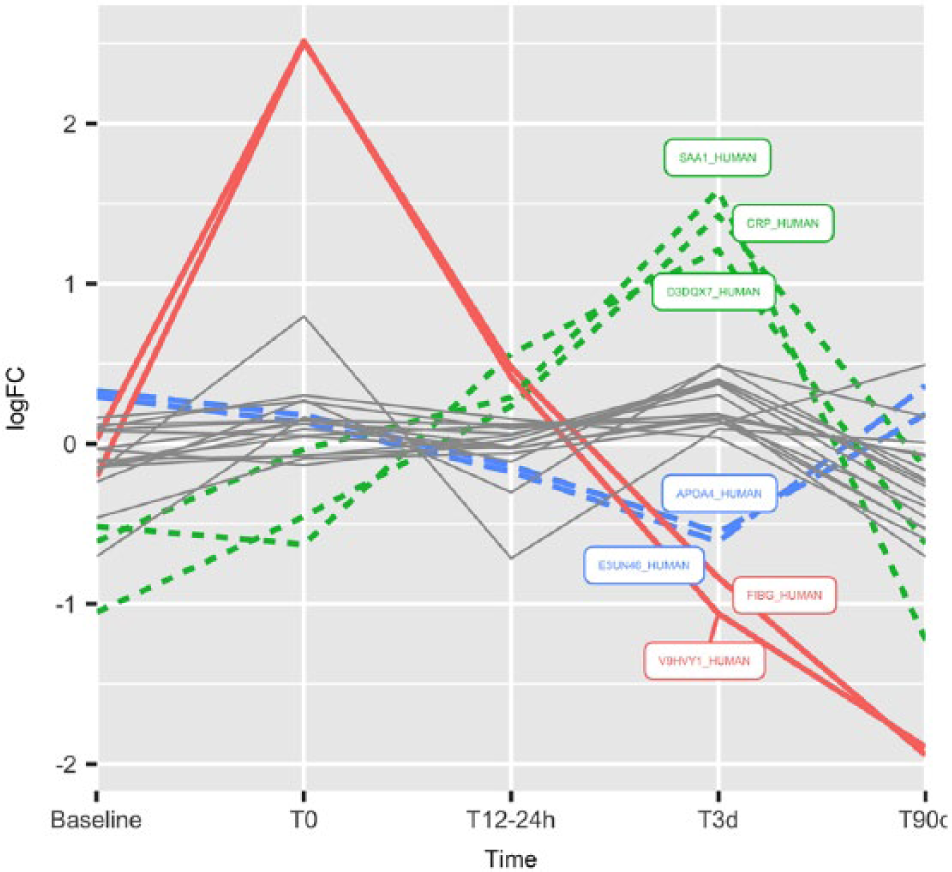
Expression profile for proteins showing significant (FDR = 0.1) changes over time. Expression is shown as log 2 fold change relative to the average across all time points. Seven proteins with 3 distinctly different expression profiles are highlighted with bold coloured lines. FDR indicates false discovery rate.
The 23 proteins significantly varying over time were loaded into the Search Tool for the Retrieval of Interacting Genes/Proteins 10 (STRING10; http://string-db.org/). The STRING builds functional protein association networks based on compiled available experimental evidence. 57 From the initial 23 proteins varying significantly over time, only 10 were successfully matched to proteins within the STRING10 database. The 13 unmatched proteins represent those for which insufficient interaction data exist. An interaction network for the 10 proteins within the STRING10 database was highly connected with evidence available to connect all proteins with the exception of C09_HUMAN (represented by its gene name C9; Figure 4).

Interactions between the time-changing proteins. String-db plots shows interactions between proteins that showed significant change over time. A green line indicates neighbourhood evidence; a blue line – concurrence evidence; a purple line – experimental evidence; a yellow line – text mining evidence; a light blue line – database evidence; and a black line – expression evidence.
Imaging parameters
To investigate whether the protein profiles were associated with the patient imaging characteristics, volume of core and penumbra (defined as the difference between perfusion volume and core volume) was used as continuous variables. Baseline samples (or T0 when baseline was not available) from all 30 patients were analysed. No single protein was shown to be significantly associated with the core (defined as DWI volume) or the penumbra (defined as DWI-PWI volumes) volumes. No proteins were significantly associated with patients presenting with clinical diffusion mismatch (defined as the combination of NIHSS ≥ 8 and DWI < 25 mL; n = 14).
Finally, protein expressions were compared regarding the type of imaging used. Based on the analysis of the serum sample collected immediately after the completion of the imaging (baseline when CTp was used and T0 when MRI was used). No proteins were significantly different between the CTp and the MRI groups. Nevertheless, there was a clear difference in adjusted P value with the first 2 proteins and the rest of the data set. These 2 proteins (Uniprot IDs: Q8N5F4_HUMAN and Q6MZQ6_HUMAN) reaching an adjusted P value of <0.1 are currently uncharacterised proteins but both contain some immunoglobulin domains.
Treatment
Treatment group allocation remained blinded until completion of the protein analysis between treatment groups A and B. Treatment allocation (rt-PA versus placebo) is not presented in the patient characteristics summary table (Table 1) as EXTEND is still an ongoing trial.
Changes due to treatment administration were evaluated by comparing protein expression of baseline samples with T0 samples (or T12-24 if T0 was not available) in each patient. One patient was excluded for treatment effect analysis as its initial baseline sample was collected after treatment administration and this patient had therefore no real baseline available.
In total, 26 proteins were found to be significantly differently expressed after treatment between the 2 treatment groups (FDR ≤ 0.05). Their protein IDs, average expression levels, associated adjusted P value, and the direction of the change are presented in Table 4.
Differentially expressed proteins before and after treatment administration.
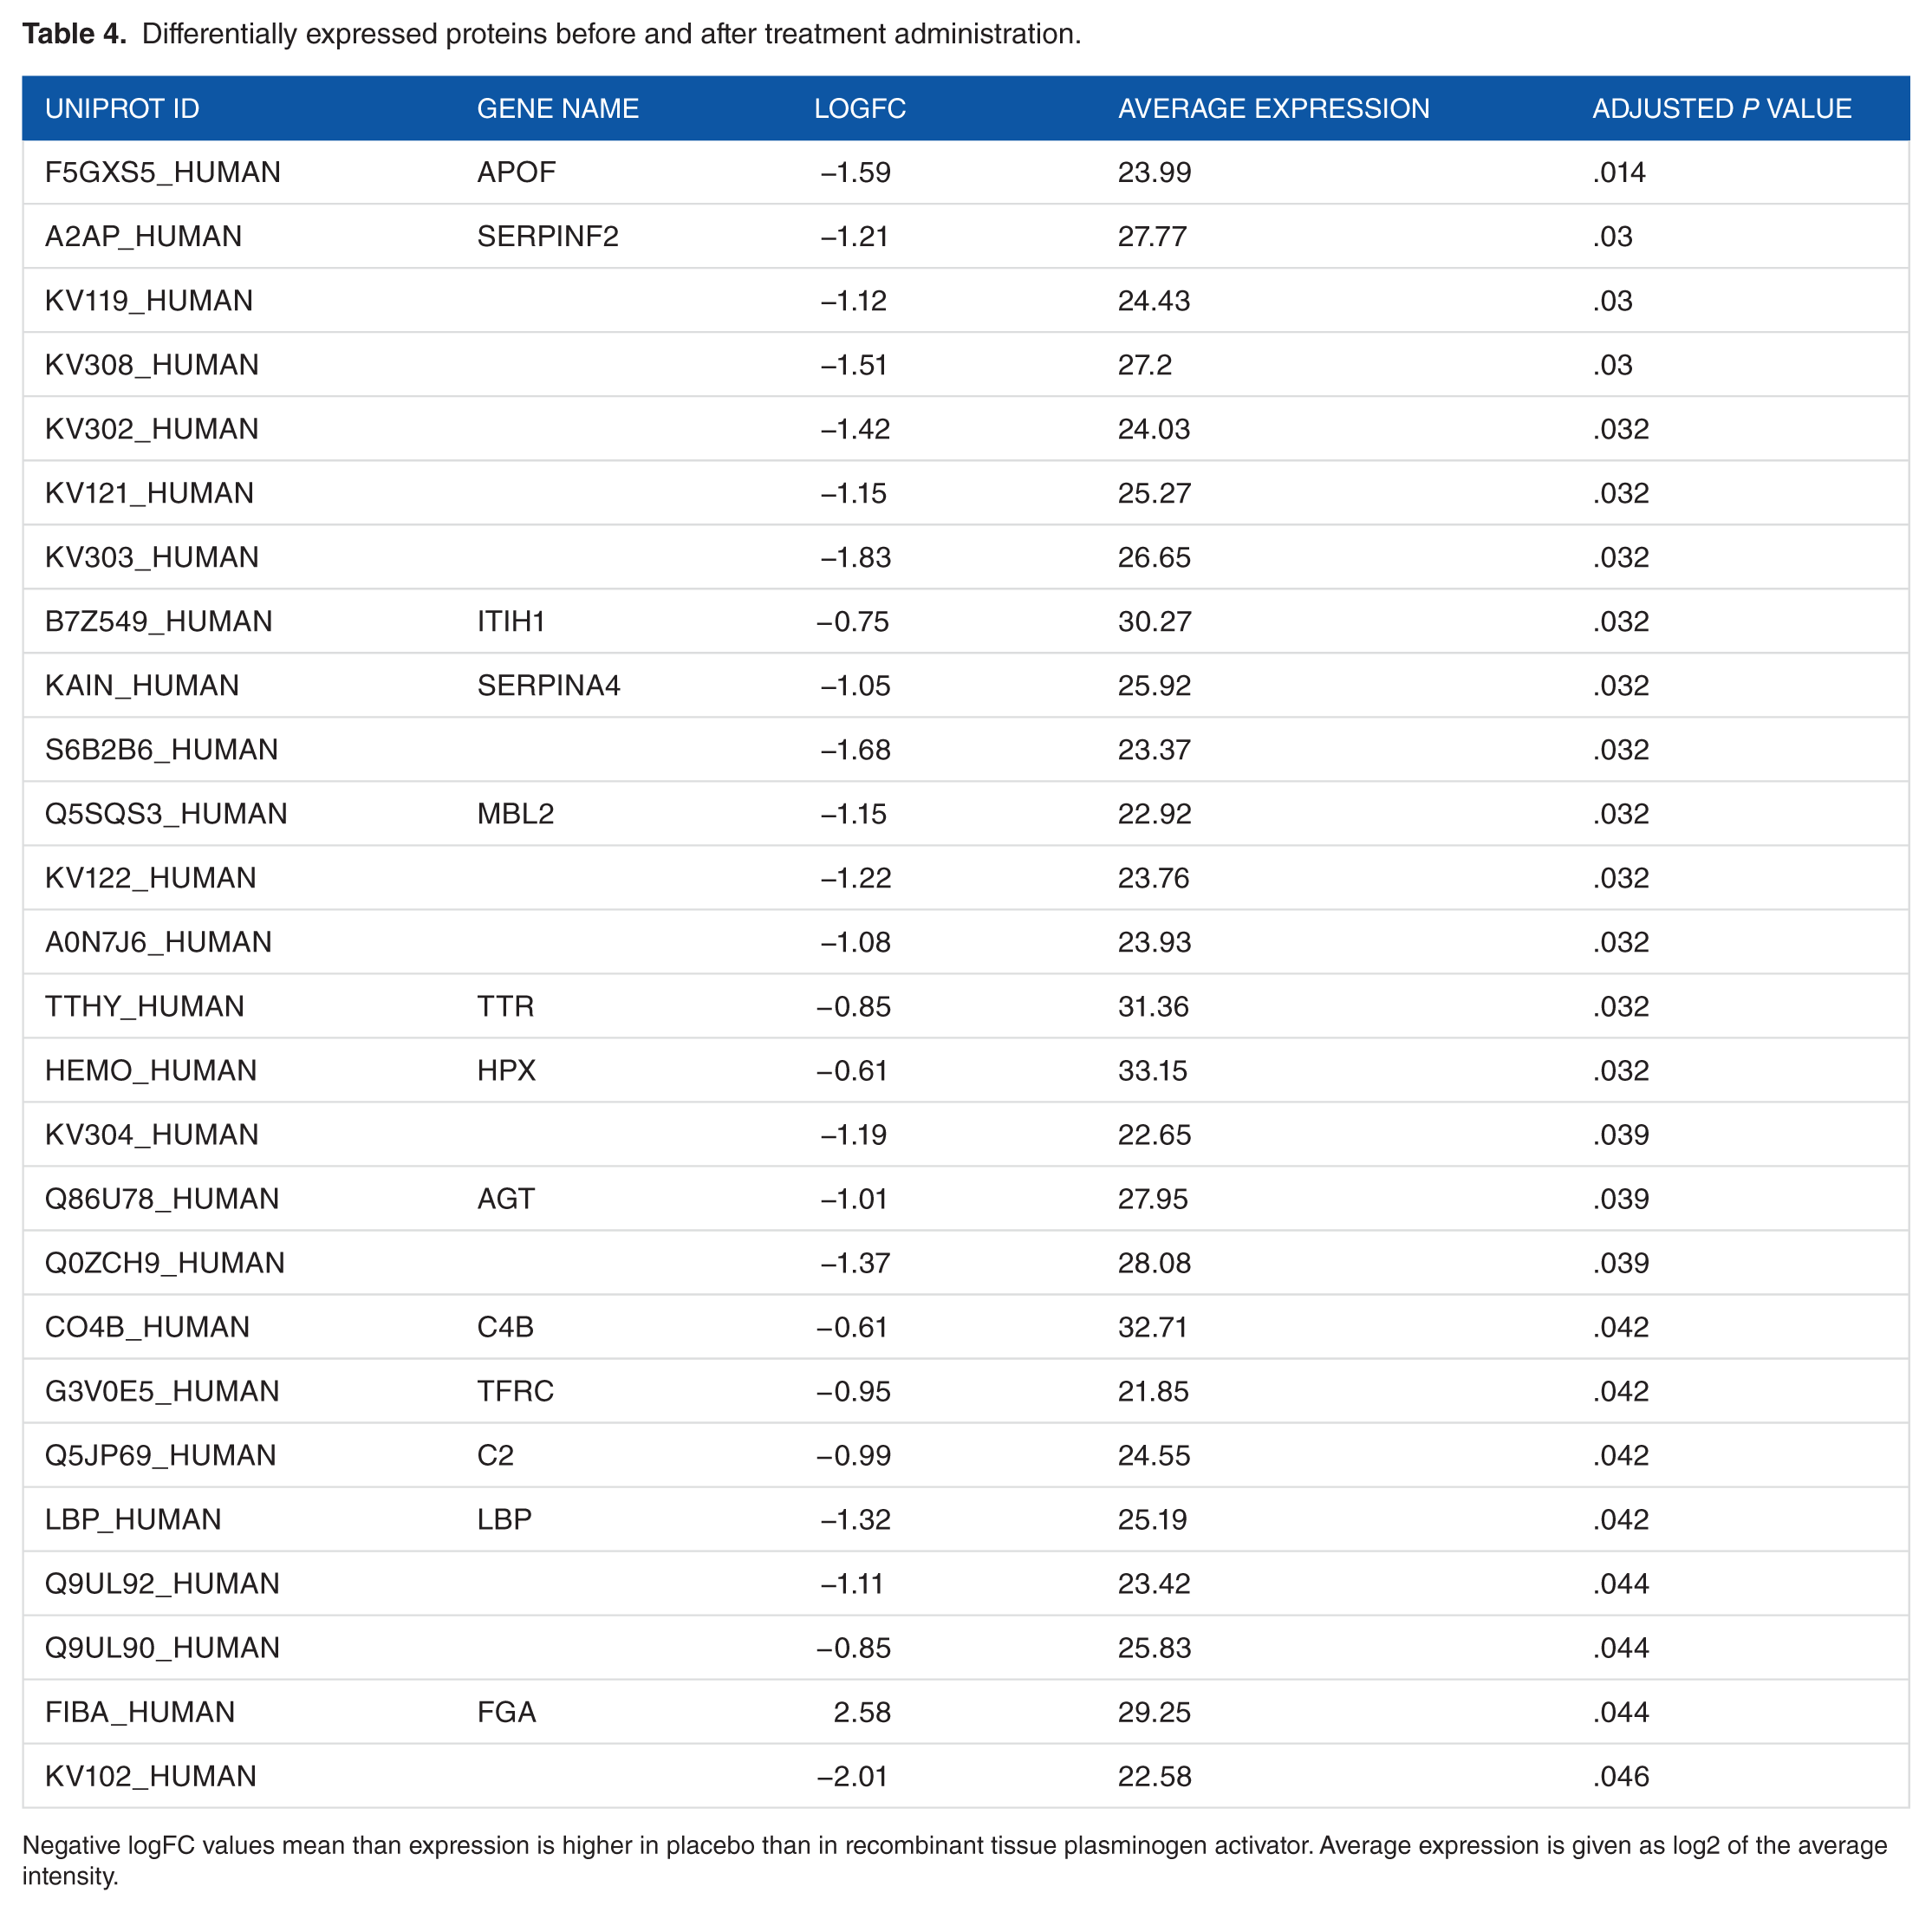
Negative logFC values mean than expression is higher in placebo than in recombinant tissue plasminogen activator. Average expression is given as log2 of the average intensity.
The 26 differentially expressed proteins by treatment administration were loaded into STRING10, and 13 were successfully matched showing an interaction network (Figure 5).

Interactions between the differentially expressed proteins before and after treatment analysis. String-db plots shows interactions between proteins that showed significant change between the 2 treatment groups. A green line indicates neighbourhood evidence; a blue line – concurrence evidence; a purple line – experimental evidence; a yellow line – text mining evidence; a light blue line – database evidence; a black line – expression evidence. Halos around protein names show logFC with green showing proteins that are higher in patients treated with rt-PA than in patients receiving placebo.
Outcome, severity, stroke subtypes, cardiovascular risk factors, and risk of PH
Functional outcome, clinical severity, stroke subtypes, cardiovascular risk factors, and risk of PH profiles were evaluated using samples collected from the 21 patients with stroke recruited in the randomised arm of EXTEND as multiple blood collection and clinical evaluation time points were available.
Potential biomarkers for good or bad outcome prediction were evaluated using the correlation of proteins expression on baseline sample and shift of mRS score between prestroke mRS and mRS at 3 months. Expression of von Willebrand factor (VWF) was significantly associated with an increase in mRS at 3 months (adjusted P = .04).
Protein expression levels were also regressed with stroke severity defined by NIHSS score at all collection time points. No significant changes in protein expression were identified in this context.
Using baseline sample (or T0 when baseline sample was not available), there were no significant changes in protein expression associated with strokes caused by large artery atherosclerosis or by cardioembolism.
Similarly, past medical history of hypertension, diabetes, atrial fibrillation, lipid disorder, ischaemic heart disease, and peripheral vascular disease were also each compared with protein levels measured in the baseline sample (or T0 when baseline sample was not available; n = 3-18). No significant differences in protein profiles were identified with any of the different cardiovascular risk factors investigated.
Finally, no specific proteins were significantly associated with the presence of a PH after stroke (by comparing baseline sample or T0 when baseline was not available and T12-24 between patients with PH and patients without PH; n = 5 and 16, respectively).
Discussion
The results of this study demonstrate the usefulness of the proteomic approach for identifying candidate serum biomarkers in the acute stroke setting. This clinical experiment is novel in attempting to identify biomarkers acting as a stroke clock and novel in examining the possibility of correlation between well-used imaging biomarkers and their potential bloodborne equivalents.In addition, this is to our knowledge the first time that MS technology has been used to achieve these aims.
Microarray studies have dominated the stroke biomarker research field in the past decade. 31 Following the lead of Frank Sharp’s team, microarray studies have shown some promising results.19,20,22,58 In an animal model, our team recently identified reproducible patterns of gene expression changing over time after IS and demonstrated that this change occurs hyperacutely after the ischaemic event (manuscript under review).
However, measurement of RNA with microarrays has several limitations with respect to translation of their results into the clinical setting. First, the technology for rapid quantitation of RNA is in its infancy. Second, because not all RNAs code for proteins, discovery at the RNA level does not guarantee finding a matched protein that might be easier to measure. Finally, serum protein levels may differ from the expression patterns due to post-translational changes and regulatory feedback mechanisms and therefore gene expression may not be an accurate reflection of protein expression during cerebral ischaemia.59–61
Modern proteomic technology allows a high-throughput method to quantitatively analyse a large number of proteins present in a disease state. By taking an agnostic and data-driven approach rather than hypothesis-driven approach, an unbiased evaluation of the proteome can identify proteins or pathways not previously considered as potential candidate biomarkers.
Candidate biomarkers have rarely been selected in the context of looking for a stroke clock. Turck et al analysed blood samples taken at 2 different time points (within 3 hours and within 36 hours) after stroke but had to combine 2 separate cohorts of patients to achieve their aim. 62 The only study collecting sequential human blood samples in the same individual early after stroke was conducted by Tang et al 20 in 2006 but their attention focused on elaboration of a diagnostic tool capable of differentiating patients with IS from controls, and the earliest blood samples were collected 3 hours after the ischaemic event.
In this experiment, we identified 23 proteins whose expression significantly varied over time after IS. Proteins expression profiles showed a range of patterns including downregulation and upregulation and early or delayed peaks of expression. Some proteins (such as the apolipoprotein A-IV) showed complex expression profiles with more than one peak of expression and varied in opposite directions over time. This highlights the importance of accounting for time when searching for biomarkers in dynamic diseases such as stroke.
Other apolipoproteins (APOC-I and APOC-II) have been previously reported as plasma biomarkers capable of accurately distinguishing between ischaemic and haemorrhagic strokes. 44 Nevertheless, these molecules are yet to reach the clinical world.
Not surprisingly, pathway analysis revealed that a number of these proteins (such as vitamin K–dependent protein S [PROS], haptoglobin, prothrombin, fibrinogen, and coagulation factors IX and X) are involved in the coagulation cascade.
The fibrinogen profile appears to have a high potential for clinical utility in the acute stroke setting. Indeed, fibrinogen expression differed dramatically during the first 24 hours after IS. More interestingly, levels of expression even increased between the samples collected at baseline and T0. As our baseline sample was collected 4.5 hours after symptoms onset at the earliest, we postulate that changes of fibrinogen availability might progressively increase from stroke onset and reach a peak of expression during the acute phase of stroke. Comparison of 2 consecutive levels of fibrinogen might therefore be used to estimate the time window from symptoms onset and help to decide if a patient is eligible for thrombolysis.
The epididymis secretory sperm-binding protein (gene V9HVY1_HUMAN) has a similar expression profile to the fibrinogen expression that fits with its role in the fibrinogen complex (http://www.uniprot.org/uniprot/V9HVY1).
In contrast, CRP expression peaked at 3 days after stroke. The CRP has extensively been studied as a molecule with the potential to differentiate between haemorrhagic stroke and IS. 30 Our data suggest that CRP might be more useful as a later time point than for early stroke diagnosis.
Three members of the serum amyloid protein A family were also present in the molecules significantly changing over time after IS. As serum amyloid proteins have rarely been associated with IS,44,63,64 this result offers a new incentive to study this class of molecules more extensively and specifically.
Only one other study has investigated the changes of candidate biomarkers across time using proteomics technologies in blood of patients with IS.
In 2010, Ning et al reported differences of protein expression before and after treatment in thrombolysed patients with stroke. They demonstrated that rt-PA treatment changed the plasma degradomic profiles in patients with acute stroke. More specifically, rt-PA treatment induced changes in the expression of some molecules known to be involved in the thrombolysis pathway such as fibrinogen and α2 macroglobulin and in the IS cascade such as transthyretin and spectrin. 65 Our experiment confirmed Ning’s results regarding fibrinogen and transthyretin changes after administration of rt-PA. However, brain-specific angiogenesis inhibitor (BAI-1) and utrophin (2 molecules newly identified by Ning et al as potential candidate IS biomarker) were not significantly differently expressed between our 2 treatment groups.
We also identified VWF as a marker of functional outcome after IS. Indeed, levels of VWF expression were associated with a shift of mRS score before and at 3 months after stroke. Known to be a key player in thrombus formation at sites of vascular damage, high plasma levels of VWF have previously been identified as a strong predictor of stroke as well as being associated with stroke subtypes and outcome.66–68
Recent studies, where blood samples were processed by microarrays or ELISA, have identified specific signatures for the different stroke causes.69–71 Due to the low number of patients in our data set presenting with each of the TOAST entities, we did not identify any significant correlation between protein expression and stroke types.
Similarly, we did not identify any protein biomarker significantly associated with DWI or the penumbral volume. This is interesting despite some molecules having been previously described as significantly associated in some imaging-based selected populations. For example, Rodríguez-Yáñez et al 72 showed that serum levels of interleukin 10, tumour necrosis factor α, and glutamate were significantly higher in patients with stroke presenting with clinical diffusion mismatch, whereas levels of neuron-specific enolase, interleukin 6, and MMP-9 were shown to be significantly lower.
These differences in discovery may reflect the difference in sensitivity of the different methods used here and in previous studies.
This might also explain why some molecules known to be associated with the stroke physiopathology such as chemokines and cytokines were not detected in this experiment. A total of 22 proteins comprise more than 90% of the total protein mass in human serum (and albumin alone accounts for more than 50%), and only 1% of the entire protein content of serum consists of proteins that are considered to be of low abundance and possibly of greater interest in the search of potential biomarkers.73,74 The masking effect of these high-abundance proteins could be reduced using depletion strategies such as antibody-based affinity chromatography and immunoaffinity depletion columns.74,75 Additional offline fractionation and longer liquid chromatography (LC) gradients might also be used for increased protein identification. Nevertheless, this study was performed with the hypothesis that it was a pre-requisite to check whether high-abundance proteins had a critical role in the IS pathophysiology and might serve as good biomarkers before studying lower abundant proteins. Combining a high-resolution MS instrument with high-performance LC and 5 hours elution gradient – which represented a total of 45 days of instrument running time – allowed us to identify a total of 574 different protein groups.
We are aware that candidate biomarker discovery with MS has rarely translated into clinical utility and this is mainly due to false discovery and lack of reproducibility. 76 The gap between biomarker discovery and biomarker validation remains a challenge. Our results highlighting major temporal changes illustrate that describing precisely when a sample is collected will have a significant impact on stroke biomarker discovery. They also suggest that it may be possible to generate a predictive stroke clock. We are also conscious that this article describes a discovery study with a relatively small group of patients. Validation by other measuring techniques such as ELISA or quantitative polymerase chain reaction as well as replication in a larger population and compared with control subjects will be important steps towards the use of such biomarkers in the clinic.
Conclusions
Our data suggest that serum biomarkers acting as a stroke clock will complement multimodal imaging in the future. They will improve the selection of patients for reperfusion therapies and therefore ultimately increase the number of patients presenting with acute IS that will benefit from rt-PA or newer therapies, including clot retrieval.
Footnotes
Funding:
The author(s) received no financial support for the research, authorship, and/or publication of this article.
Declaration of conflicting interests:
The author(s) declared no potential conflicts of interest with respect to the research, authorship, and/or publication of this article.
Author Contributions
MD conceived and designed the study, participated in the samples processing and in the statistical analysis and drafted the manuscript. IRC performed the statistical analysis and helped to draft the manuscript. PF performed the samples processing and helped to draft the manuscript. TKS helped to conceived the study and participated in the samples processing. HMD helped to draft the manuscript. GAD participated in the study design. DWH conceived and designed the study, supervised its execution, participated in the statistical analysis and helped to draft the manuscript.