
Abstract
Dynamic contrast-enhanced perfusion and permeability imaging, using computed tomography and magnetic resonance systems, are important techniques for assessing the vascular supply and hemodynamics of healthy brain parenchyma and tumors. These techniques can measure blood flow, blood volume, and blood-brain barrier permeability surface area product and, thus, may provide information complementary to clinical and pathological assessments. These have been used as biomarkers to enhance the treatment planning process, to optimize treatment decision-making, and to enable monitoring of the treatment noninvasively. In this review, the principles of magnetic resonance and computed tomography dynamic contrast-enhanced perfusion and permeability imaging are described (with an emphasis on their commonalities), and the potential values of these techniques for differentiating high-grade gliomas from other brain lesions, distinguishing true progression from posttreatment effects, and predicting survival after radiotherapy, chemotherapy, and antiangiogenic treatments are presented.
Introduction
Each year, over 250,000 primary brain and central nervous system cancers are diagnosed worldwide, 10% of which occur in North America. 1 These types of cancer have 60% probability of death, 2 and quality of life is often seriously diminished, even in treated patients. 3 Gliomas, tumors derived from neuroglia, represent a majority of primary brain cancer cases. Based on their pathological features determined after biopsy, the World Health Organization (WHO) classifies gliomas into the following four grades: Grade I (low proliferative) and Grade II (infiltrative) are considered low-grade gliomas, whereas Grade III (histological evidence of malignancy) and Grade IV (cytologically malignant, mitotically active, and necrosisprone neoplasms) are high-grade gliomas.4,5 While low-grade gliomas may be managed with observation or surgery alone, higher grade tumors typically require multimodality treatment.
Current strategies include maximum safe surgical resection followed by radiotherapy and chemotherapy. 6 Although there is evidence that favorable outcome is associated with near-total resection of the tumor, a high-grade, malignant glioma often cannot be completely removed. 7 Even with complete resection, rapid recurrence after surgery alone is common, and adjuvant radiotherapy is typically added to delay the time of recurrence. However, radiation toxicity to the surrounding normal tissue has to be minimized, and thus, the radiotherapy target tissue volume often has to be restricted. Typically, the applied radiation field is optimized using three-dimensional conformal radiotherapy, 8 intensity-modulated radiotherapy, 9 or stereotactic surgery 10 approaches. Such precision radiotherapy techniques require accurate tumor boundary delineation, typically on the basis of standard contrast-enhanced magnetic resonance (MR) imaging. Complementary functional imaging information better identifies biologically significant tumor volumes (including quantitative perfusion and permeability surface data), enhances the treatment planning process, 11 optimizes treatment decision-making, 12 and enables monitoring of the treatment 13 noninvasively, resulting in improved patient care and treatment outcome.
The growing tumor
Neovascularization and necrosis are biologic hallmarks of malignant glioma that can potentially be interrogated through perfusion imaging. Tumor growth is dependent on the availability of an abundant supply of oxygen and nutrients made possible by efficient blood flow (BF). In primary and metastatic brain tumors, the integrity of the blood-brain barrier (BBB) is compromised. 14 The number of pericytes, 15 astrocytes, 16 and tight junction proteins 17 are reduced, affecting the structural integrity and vascular function of BBB. In addition to BBB dysfunction, decreased tissue oxygen concentration (hypoxia) is another characteristic of rapid tumor growth. 18 Once the tumor has grown beyond the limit of oxygen diffusion (a few millimeters), the normal supply of blood cannot meet the oxygen demands caused by the elevated proliferative state of the tumor. 19 To address this need, an adequate blood supply is provided through several mechanisms including co-option, angiogenesis, and vasculogenesis. 20 These tissue perfusion and/or vessel permeability altering mechanisms are correlated with histopathologic changes and molecular markers related to tumor growth (eg, vascular endothelial growth factor [VEGF]) and, therefore, could be used as a biomarker of tumor malignancy, margin, and invasion. 21
Tumor identification and assessment
Histopathology remains the gold standard to identify and quantify the extent of a potentially malignant tumor; however, its application and ability to correctly define tumor grade is limited due to the invasive nature of the technique and potential sampling bias. 22 Tomographic (or cross-sectional) imaging-based techniques provide anatomical and functional information throughout the tumor, reducing sampling bias, and are minimally invasive.
The McDonald criteria 23 is perhaps the most well-known metric to evaluate glioblastoma (GBM) treatment response. It uses the product of the maximal orthogonal diameters of the enhancing tumor on T1-weighted MR as a measure of tumor volume. 23 With the introduction of new systemic therapy agents such as temozolomide and bevacizumab, novel patterns of imaging response such as pseudoprogression and pseudo-response, reflecting treatment-related vascular changes, have emerged, requiring new imaging approaches to assess tumor response.24–26 The Response Assessment in Neuro-Oncology (RANO) group updated the McDonald criteria in 2010, and the revised document 26 suggests that specific functional imaging techniques, particularly perfusion and permeability, are needed to more appropriately characterize tumor progression and treatment response. Such information can be obtained from computed tomography (CT) or MR imaging, which acquire cross-sectional images that can define the location and size of the tumor. Of particular interest is extravasation of a contrast agent from the leaky BBB, as well as perfusion differences between the rim and core of the tumor. These concepts are described in detail in the following section.
Image-based Measurement of Perfusion and Permeability
A number of tomographic imaging techniques have been used for quantitative measurement of perfusion and permeability including MR-based (1) dynamic contrast-enhanced (DCE), (2) arterial spin labeling (ASL), and (3) dynamic susceptibility contrast (DSC) imaging, as well as (4) CT-based DCE imaging. All the approaches rely on endogenous (ASL) or exogenous agents (DSC, DCE). Exogenous agents are commonly termed contrast (agent) or tracer. For all techniques, quantitative maps are produced from the tomographic image data by applying the principles derived from indicator-dilution theory or kinetic modeling.24,25 The acquisition requirements for these approaches have been recently reviewed. 27
Briefly, MR ASL selectively labels arterial blood (ie, it uses an endogenous tracer) in the neck and uses a subtraction imaging technique to assess BF in the brain tissue. ASL is a technology that is gaining interest in neuro-oncology, 28 since it does not require the injection of exogenous contrast agent and does not use radiation. It has been proposed 29 for assessing tumors but is not widely used, though it may have a role in posttherapy surveillance imaging or in patients unable to receive exogenous contrast agents. 27 The main challenges of the ASL technique include rapid T1 decay of the ASL measurements, limiting investigation to where the flow is fast and lower signal-to-noise ratio and spatial resolution compared with DCE and DSC. Also, ASL cannot be performed after injection of T1 contrast agents. 30 A number of different implementations of ASL are currently under assessment including continuous ASL, pulsed ASL, pseudocontinuous ASL, and velocity-selective ASL. Recently, a working group reviewed these emerging clinical techniques and published advice on the standardization of the ASL method, hopefully leading to improved clinical applications of this technique in future. 31
MR DSC and DCE approaches are conceptually similar except that different MR acquisition techniques are used that cause the measured signal to either decrease or increase, respectively, with increasing contrast agent concentration. In DSC approaches, depending on contrast agent concentration, a susceptibility gradient is generated between the tissue and the vasculature, which decreases the T2*-weighted signal.
32
DSC MR technique is based on the assumptions that the contrast agent dilution in the blood is a function of BF and blood volume (BV) and that contrast agent remains intravascular (ie, does not leak into brain parenchyma) during imaging.32,33 Challenges when deriving quantitative maps from MR DSC data are numerous and principally derive from the nonlinear relationship between contrast agent concentration and measured signal, which lead to nonstationary noise characteristics
34
and difficulties with partial volume correction.
35
Also, any leakage of the contrast agent to parenchymal tissue results in violation of the DSC MR assumption and can underestimate BV, particularly when contrast leakage is high, for example, due to damaged BBB as is common with brain tumors.
36
Both ASL and DSC approaches are typically implemented using an echo-planar imaging sequence, which is sensitive to geometric distortions. Furthermore, MR ASL or DSC approaches cannot estimate permeability directly. While there have been efforts to derive
Herein, we concentrate on CT and MR DCE techniques, specifically focusing on their common features. These two approaches are also most commonly used for studying tumor perfusion and are the only MR and CT approaches that are able to estimate permeability. MR and CT DCE imaging characterizes tissue hemodynamics by tracking the passage of a bolus of contrast agent as it traverses through the microvasculature and brain parenchymal tissue. In both modalities, the passage of the contrast agent leads to a corresponding time-course of signal enhancement that can be analyzed.
Kinetic modeling to quantify hemodynamics and BBB permeability surface
MR DCE analysis techniques consist of three main kinetic modeling steps, whereas the corresponding CT analysis only requires the last step
38
:
Image signal intensity is converted to contrast agent concentration to obtain the time-concentration curve, Image signal intensity from an artery supplying the brain tissue is similarly converted to produce and estimate the arterial input function, An appropriate tracer kinetic model is then employed to calculate the hemodynamic parameters of interest, such as BF, BV, transit time, and permeability surface area product (PS). (Parenthetically, similar modeling approaches can be used to analyze DSC MR data except for PS).27,39
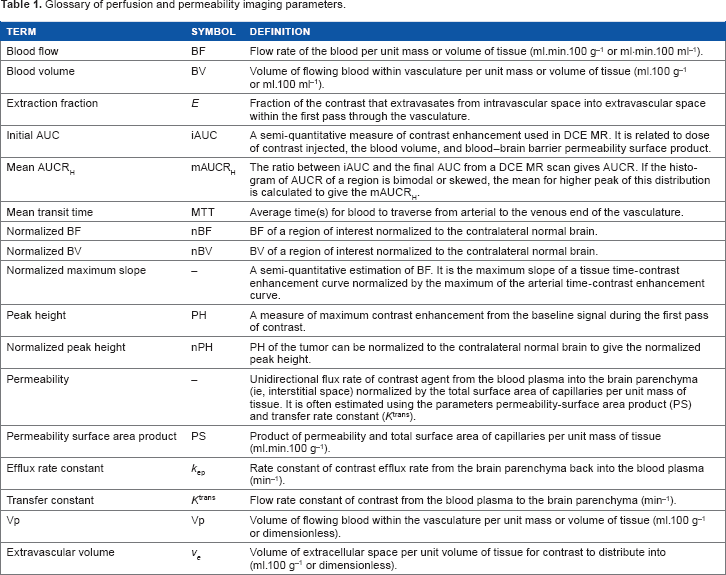
Glossary of perfusion and permeability imaging parameters.
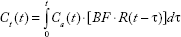
The tissue time-concentration curve, 
After convolution, this yields an expression for the tissue time-concentration curve.
The impulse residue function,
Perfusion quantification
In practice, contrast agent is injected intravenously over a period of time (typically over 15-25 seconds for CT, <10 seconds for MR), such that the arterial input function,
A commonly used semiquantitative parameter in brain cancer imaging is the normalized BV (nBV). The nBV is defined as the BV in the tumor divided by the BV in the same volume of normal contralateral brain. Peak height (PH) is another semiquantitative measure defined as the maximum contrast enhancement from the baseline signal during the first pass of contrast agent. Normalized blood flow (nBF) and normalized peak height (nPH) of the tumor are defined similar to nBV.
Permeability quantification
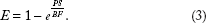
If the permeability parameter estimates are of interest (eg, the rate of extravasation of contrast agent from the intravascular space into the extravascular extracellular space (EES) as assessed by PS or
Here, we focus on the Johnson-Wilson model,
44
in particular, its modification by St Lawrence and Lee.
45
The modified Johnson-Wilson model is a more physiologically realistic distributed parameter model and allows the simultaneous determination of BF, BV, and PS. The modified Johnson-Wilson model has a closed-form solution to the impulse residue function 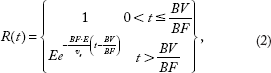
Schematic representation of the Johnson-Wilson model, as well as the modifications due to St Lawrence and Lee, is presented in Figure 1. These distributed parameter models enable the separation of BF and (A) Schematic drawing of the modified Johnson-Wilson model,
44
where the central cylinder represents all the vessels in the tissue region and the annulus around the cylinder is the interstitial space into or out of which contrast can diffuse. The interstitial space is assumed to be a 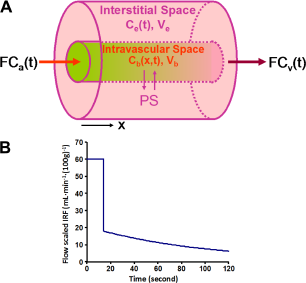
For the modified Johnson-Wilson model, Eqs (1) and (2) lead to the following for the tissue curve, 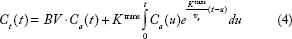
Differences between CT- and MR-based DCE
Comparison of MR and CT DCE techniques.
DCE-CT perfusion and permeability imaging–-implementation details
DCE-CT refers to the acquisition of serial CT images to track the passage of a bolus of iodinated contrast agent. The typical DCE-CT protocol takes 2-3 minutes, and it involves rapid acquisition of images (1-2 seconds per image) during the initial phase of imaging (45 seconds) to capture the first pass of contrast agent for the calculation of BF and BV. To decrease the radiation dose, the second phase that involves less-frequent acquisition (10–15-second image interval) is required to calculate PS or
The clinical use of DCE-CT was initially slow to develop due to its relatively limited scan volume (2-4 cm coverage) and associated radiation dose (2-5 mSv).
40
Larger multirow detector technology now allows for the coverage of 16 cm of the anatomy.
50
Shuttle mode imaging can also increase the scan coverage.
51
More advanced reconstruction methods, such as adaptive statistical iterative reconstruction technique,
52
and reducing the temporal resolution of image acquisition (≤3 seconds) in the first phase
53
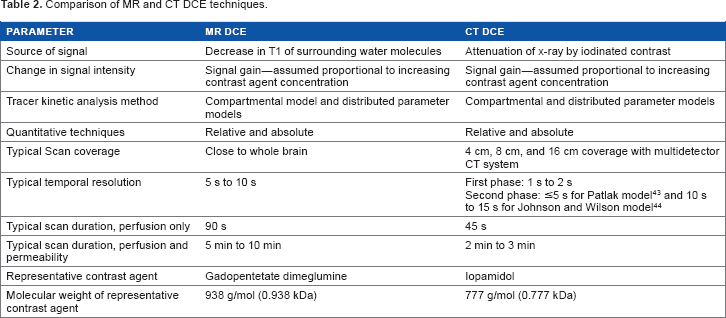
have both been demonstrated as effective ways to reduce the dose. Figure 2 shows an example for CT DCE perfusion and permeability images obtained in an anaplastic oligodendroglioma patient.
CT Perfusion technique in a patient with an anaplastic oligodendroglioma, prior to subtotal resection of the tumor. A series of images were acquired with contrast injection. In the top row of the figure, the artery region (blue line in the left panel), normal (green region in the central panel in the top row), and tumor (purple line in the central panel in top row) are shown in a CT image at peak enhancement and in a baseline CT image before contrast arrival. The corresponding background subtracted time-density curves (normalized to the same maximum) are also shown using the same color-coding scheme. In the bottom row of the figure, the time-averaged CT image, BF, BV, and PS maps in the same CT slice as in the top row are shown. White arrows point to the tumor in the different images and functional maps.
DCE-MR perfusion and permeability imaging–-implementation details
DCE-MR refers to the acquisition of serial MR images using a T1-weighted sequence. The increase in T1 relaxation rate from the corresponding increases in contrast agent concentration results in an increase in MR signal intensity. DCE-MR scan duration is normally less than two minutes, but scans from three to six minutes are required if the rate of extravasation of contrast agent from the intravascular space into the EES (ie, PS or MR DCE technique in a GBM patient postresection. Analogous to CT DCE example (Fig. 2), a series of pre- and postcontrast agent injection images are acquired to measure contrast concentration over time (see text) in order to derive contrast agent vs time–-concentration curves and parameter maps, such as cerebral BF, cerebral BV, and PS using the modified Johnson-Wilson model. White arrows point to the recurrent tumor.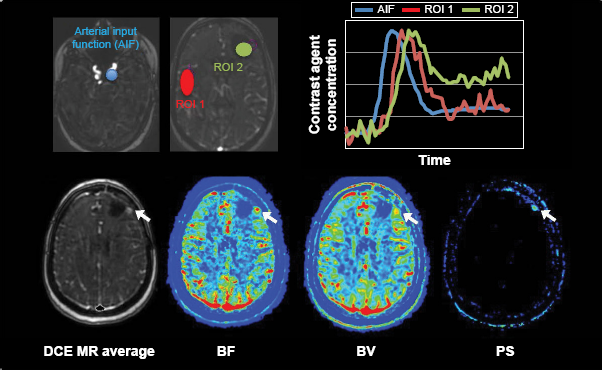
Applications of Perfusion and Permeability Biomarkers in Brain Cancer
Multiple applications for perfusion and permeability imaging of brain tumors have been explored to enhance the treatment planning process, to optimize treatment decision-making, to enable treatment monitoring, and to assess prognosis. In this section, we selectively target and review three key applications: differentiating malignant brain lesions, distinguishing true progression from posttreatment effects, and predicting survival after treatment therapies.
Differentiation of malignant brain lesions
Solitary brain metastases with no history of primary cancer are found in approximately 15% of patients and may have similar imaging features to primary malignant gliomas on conventional MR images. 55 Two factors should be considered when using perfusion imaging to differentiate solitary brain metastases from malignant gliomas. First, current evidence suggests that BV in the contrast-enhancing metastatic lesion depends on the primary tumor site. 56 Metastases from melanoma and renal carcinoma, for example, are reported to have higher BV than malignant gliomas. 57 Studies that considered different sites of origin as one entity (or those that did not report primary tumor) showed that the BV of the enhancing metastatic lesions was either similar58,59 or lower60,61 than the malignant gliomas. Together, these studies suggest that the differentiation of brain metastasis from malignant glioma based on the BV of the contrast-enhancing lesion alone is challenging. Second, BV in the nonenhancing lesion shows promise for distinguishing metastases from primary malignant gliomas. For example, on CT or MR imaging, a low-intensity region (CT, T1 MR) or high-intensity lesion (T2 MR) around an enhancing lesion may represent edema or infiltrating tumor or a combination of both. In the case of metastases, infiltration more than 1-2 mm beyond the enhancing tumor is rare 62 so this region most often represents edema, while in malignant glioma, infiltration 1-2 cm is not uncommon. The high BV in the nonenhancing malignant glioma lesion can be attributed to their aggressive and infiltrative growth, which often extends into the surrounding T2-hyperintense region. The median sensitivity and specificity for distinguishing between nonenhancing lesions and gliomas using BV were 90% (range: 77%-100%) and 95% (64%-100%), respectively.60,61,63 In contrast, the median sensitivity and specificity for contrast-enhancing lesions' vs gliomas' nBV (see definition in Table 1) were 87% (80%-91%) and 72% (64%-88%), respectively.63,64
Perfusion imaging can also differentiate malignant gliomas (Grades III and IV) from other primary brain tumors. These include differentiating primary malignant gliomas from lymphomas,65,66 meningiomas, 67 hemangioblastomas, 67 and schwannomas. 67 Some studies have used perfusion imaging to differentiate subtypes of primary brain tumors.68,69 Grade II and III oligodendroglial tumors showed higher nBV than both Grade II and III oligoastrocytic and astrocytic tumors, and oligoastrocytic tumors showed higher maximum nBV than astrocytic tumours. 70 A sensitivity and specificity of 100% and 88%, respectively, were found when nBV was used to differentiate Grade II and III oligodendroglial tumors from astrocytic tumors. Although there were differences in BV between the different types of primary brain tumors, the number of brain tumor types make this method of differentiation impractical.
Perfusion can help distinguish between high-and low-grade gliomas.
71
High-grade gliomas, particularly Grade IV, are highly infiltrative tumors with recurrence typically arising within 2 cm of the irradiated volume.
72
An active area of study is to evaluate the prognostic value of perfusion imaging for predicting the overall survival of patients with high-grade gliomas. An example of presurgery CT perfusion and MR images of two high-grade glioma patients is shown in Figure 4.
Illustrative presurgery CT perfusion and MR images of two patients both with Grade IV gliomas. Both patients presented with a contrast-enhancing lesion on postgadolinium T1-weighted MR images, which also had elevated BF, BV, and PS. Patient A presented with low BF, BV, and PS in the nonenhancing lesion (NEL, asterisk). Patient B presented with regions of elevated BF, BV, and PS in the NEL (red arrows). The survival for patient A was 41.6 months and patient B was 16.7 months. Color bar scale for maps is as follows: 10-75 mL minute-1 (100 g)-1 for BF, 0.5-10 mL (100 g)-1 for BV, and 1-10 mL minute-1 (100 g)-1 for PS. This figure was reproduced from Ref. 98 with the permission of the copyright holder.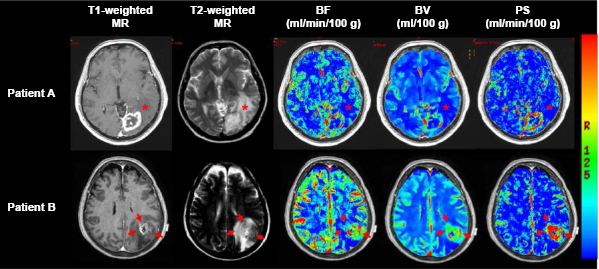
It is important to note that differentiation of tumor grade in oligodendroglial tumors based solely on perfusion imaging should be interpreted with some caution since there is evidence that oligodendroglial tumors can have higher BV than astrocytic tumors, irrespective of the tumor grade. 70 However, high-grade oligodendroglial tumors may or may not have higher BV than low-grade oligodendroglial tumors.70,73 Therefore, perfusion imaging-based assessment of oligodendroglial tumors should be considered separately from astrocytic tumors, and perfusion imaging alone does not seem to provide a reliable criterion for differentiating oligodendroglial tumor grade.
Differentiation of progression from posttreatment effects
A change in the size of the contrast-enhancing tumor is used as a radiologic measure of progression, but it can be confounded by other sources of contrast enhancement. Pseudoprogression and treatment-induced necrosis (TIN) are posttreatment scenarios with a better prognosis than true progression, but their changes in contrast enhancement pattern can be indistinguishable from tumor progression. 74 Erroneous diagnosis of pseudoprogression or TIN as tumor progression can lead to unnecessary treatment or premature abandonment of treatment. Interpreting progression incorrectly may delay the treatment.
Pseudoprogression occurs in 20%-30% of malignant glioma patients treated with chemoirradiation and manifests as a transient increase in tumor contrast enhancement at one to three months posttreatment that eventually subsides.75,76 Although its pathophysiology remains unclear, chemoirradiation is believed to induce a transient local inflammatory reaction, edema, and increased vessel permeability, which manifests as increased signal on contrast-enhanced images.
77
Also, radiation injury can induce an increase of VEGF, which can subsequently lead to perfusion increase. However, there is evidence that when using DSC MR perfusion imaging, true progression had a higher maximum nBV than pseudoprogression when confirmed by radiologic and clinical follow-ups (sensitivity and specificity of 81.5% and 77.8%, respectively).76,78 Another study showed that both nBV and nPH could distinguish pseudoprogression from progression with sensitivities and specificities of both ≥75%.
79
Histogram analysis of nBV to characterize percent changes in nBV skewness and kurtosis is also a potential biomarker for differentiating pseudoprogression from true progression.
80
In another prospective study, a decrease in nBV after three weeks of chemoirradiation was associated with a higher risk of early progression.
75
Also, TIN occurs 3-12 months after radiotherapy in 3%-24% of patients.
77
Radiation-induced necrosis and pseudoprogression were collectively defined as radiation-induced injury in eight MR perfusion studies.
81
Mean and maximum nBV were reported to differentiate radiation-induced injury from true progression with sensitivities and specificities ranging from 86% to 100% and 80% to 100%, respectively.82,83 Radiationinduced injury and true progression often coexist in patients. Hu et al showed that MR perfusion imaging was able to estimate the fractional tumor burden (ie, progression) and posttreatment effect (ie, radiation-induced injury) within the same MR contrast-enhancing lesion.
84
This fractional tumor burden strongly correlated with the histological tumor fraction obtained from stereotactic biopsy (
Survival after radiotherapy and chemotherapy
The value of perfusion imaging in predicting progression-free survival (PFS) and overall survival has been investigated in numerous studies. The interpretation of perfusion imaging data for predictive survival depends on treatment regimen and imaging schedule. Three perfusion imaging schedules for predicting outcomes have been reported as follows: (1) pretreatment, (2) pretreatment and midtreatment, and (3) pretreatment and posttreatment. Figure 5 shows an example of perfusion and permeability surface maps at preradiotherapy, near-end-of-radiotherapy, and with tumor progression.
Preradiotherapy gross tumor (T1-weighted MR), near-end-of radiotherapy enhancing lesion (averaged CT), and progressive tumor (T1-weighted MR); and the corresponding parametric maps of BF, BV, PS, standard uptake value (SUV), and SUV:BF ratio acquired using CT perfusion and FDG-PET. Blue outlines show the contrast-enhancing lesions delineated by a radiation oncologist. Yellow outline is the 2 cm bounding box that was set for performing analysis of neighboring pixels. This figure originally appeared in the 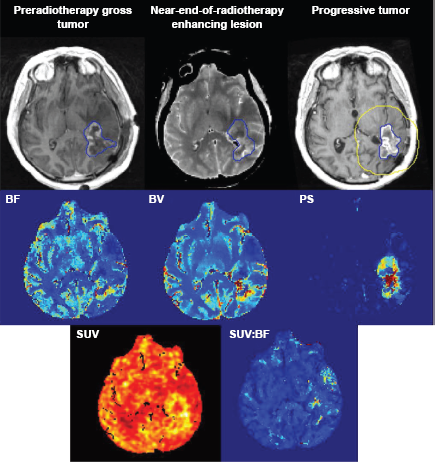
When pre-chemoirradiation MR perfusion images were considered, a higher mean and maximum nBV were associated with poor PFS and lower overall survival for gliomas of all grades.85–87 The two-year overall survival rate for Grade III astrocytomas was significantly lower for patients with maximum nBV > 2.3 (33% vs 100%,
The prognostic value of comparing pre- and midradiotherapy perfusion imaging parameters has been investigated.91,92 Based on the parametric response map analysis, a decrease in tumor BV and BF at one and three weeks into chemoirradiation were predictive of poor overall survival.91,92 Specifically, patients with >6.8% of tumor volume, showing a decrease in nBV, had reduced overall survival than those with ≤ 6.8% of tumor volume, showing a decrease in nBV (median overall survival of 7.1 and 20.4 months, respectively;
Tumor perfusion after the completion of chemoir-radiation and its association with survival have also been investigated.93,94 An increase in the maximum nBF between baseline and follow-up imaging was a better prognosticator of shorter PFS (hazard ratio [HR] = 2.67,
In summary, a high BV before and after chemoirradiation and a decrease in BV during chemoirradiation are associated with poor survival. A high BV before and after treatment is characteristic of tumor growth and progression, while a decrease in BV during treatment may be indicative of tumor hypoxia.
Survival after antiangiogenic therapy
Radiologic assessment of response to antiangiogenic agents, especially those that target VEGF, should be interpreted with caution because a decrease in contrast enhancement is not necessarily indicative of true response (ie, it may be a pseudoresponse). 26 Batchelor et al 99 showed that patients treated with cediranib demonstrated decreased MR signal enhancement as early as one day after the initiation of treatment, despite considerable variability in tumor response. Given the vascular effects of antiangiogenic agents, DCE perfusion imaging may potentially play an important role in providing insight and assessing response to these agents.
For recurrent GBMs, high nBV and
The inconsistent relationships found between various perfusion and permeability imaging parameters and overall survival suggest that not all patients responded equally to antiangiogenic agents. Sorensen et al showed that 25% of patients with recurrent GBMs treated with cediranib exhibited elevated perfusion, and these patients had higher PFS and overall survival than those with stable or decreased perfusion.
106
This finding was confirmed in patients with newly diagnosed gliblastomas that were treated with radiotherapy, temozolomide, and cediranib. Patients with increased perfusion had a significantly longer median overall survival than patients with decreased perfusion (overall survival of 504 vs 321 days; log-rank
Summary
We provided an overview of DCE-CT and MR perfusion and permeability principles, parameters, and applications in brain cancer. These perfusion and permeability quantification approaches may serve as potential biomarkers for differentiation of malignant lesions and posttreatment effects and for investigations on survival after radiotherapy, chemotherapy, and antiangiogenic treatments.
Abbreviations
arterial spin labeling
blood-brain barrier
blood flow
blood volume
computed tomography
dynamic contrast-enhancement
dynamic susceptibility contrast
extravascular extracellular space
glioblastoma
hazard ratio
magnetic resonance
normalized blood flow
normalized blood volume
progression-free survival
permeability surface area product
response assessment in neurooncology
treatment-induced necrosis
World Health Organization.
Author Contributions
Wrote the first draft of the manuscript: AE. Contributed to the writing of the manuscript: AE, TY, CE, GB, SY, JE, EF, TYL, and RF. Agree with manuscript results and conclusions: AE, TY, CE, GB, SY, JE, EF, TYL, and RF. Jointly developed the structure and arguments for the paper: AE, TYL, RF. Made critical revisions and approved final version: AE, TY, CE, GB, SY, JE, EF, TYL, and RF. All authors reviewed and approved of the final manuscript.
Footnotes
Acknowledgments
We would like to acknowledge the support of the Canadian Institutes for Health Research (CIHR); the Medical Imaging Trials Network of Canada (MITNEC) was funded by the CIHR. TYL and RF are investigators with MITNEC. AE was University of Calgary Eye's high postdoctoral scholar. CDD was a Heart and Stroke Foundation of Canada Fellow. AE and CDD were also supported by the International and Industrial Imaging Training (I3T) program funded by the Natural Science and Engineering Research Council of Canada Collaborative Research and Training Experience (NSERC CREATE) program. RF is the Hopewell Professor of Brain Imaging.