
Abstract
A 112-amino-acid protein irisin (IRI) is widely expressed in many organs, but we currently do not know whether appendix tissue and blood cells express it. If appendix tissue and neutrophil cells express IRI, measuring its concentration in biological fluids might be helpful in the diagnosis of acute appendicitis (AA), since neutrophil cells are the currently gold-standard laboratory parameters for the diagnosis of AA. Therefore, the purpose of this study was to investigate the suitability of enzyme-linked immunosorbent assay-based measurements of the proposed myokine IRI for the discrimination of patients with AA from those with acute abdominal pain (AP) and healthy controls. Moreover, immunoreactivity to IRI was investigated in appendix tissues and blood cells. Samples were collected on admission (T1), 24 hours (T2), and 72 hours (T3) postoperatively from patients with suspected AA and from patients with AP corresponding to T1-T3, whereas control subject blood was once corresponding to T1. IRI was measured in serum, saliva, and urine by using enzyme-linked immunosorbent assay, whereas in appendix tissue and blood cells, IRI was detected by immunohistohcemistry. Appendix tissue and blood cells (except for erythrocytes) are new sources of IRI. Basal saliva, urine, and serum levels were higher in children with AA compared with postoperative levels (T2) that start to decline after surgery. This is in line with the finding that IRI levels are higher in children with AA when compared with those with AP or control subject levels, most likely due to a large infiltration of neutrophil cells in AA that release its IRI into body fluids. Measurement of IRI in children with AA parallels the increase or decrease in the neutrophil count. This new finding shows that the measurement of IRI and neutrophil count can together improve the diagnosis of AA, and it can distinguish it from AP. IRI can be a candidate marker for the diagnosis of AA and offers an additional parameter to neutrophil count. The promising receiving operating curve results indicate the following sensitivities and specificities, respectively, for IRI: serum 90% and 55%, saliva 90% and 60%, and urine 90% and 50%. Serum neutrophil count gave a sensitivity of 90% and a specificity of 90%. This promising result now needs to be confirmed in a larger group of patients.
Introduction
Appendicitis is the most frequent problem at any time and age.1,2 Diagnosis of acute appendicitis (AA) is currently based on right lower quadrant abdominal pain (AP) of short duration, nausea, and/or vomiting developing soon after the AP begins, anorexia, abdominal rigidity, painful urination, constipation or diarrhea with gas, and high fever (>38°C). 2 Several biochemical parameters, such as the white blood cell (WBC) count, capsular (C) polysaccharide of pneumococ-cus-reactive protein (CRP) level, and neutrophil percentage, are currently used to aid clinical diagnosis.3,4 These clinical symptoms and laboratory results are not specific enough to distinguish AA from a number of other conditions, especially nonspecific AP. 5 In many cases, appendices are surgically removed due to inadequate diagnostic laboratory evidences. This is especially true in childhood cases because of the patient not being able to describe the symptoms and the background to the disorder developing. Therefore, accurate diagnosis of appendicitis during its acute phase is important to be able to treat this disorder and reduce any associated morbidity and mortality and reduce lengthy hospital for some patients. 6
Unnecessary removal of the appendix through an incision in the right lower abdominal wall due to a lack of reliable laboratory data has become a burden not only to the healthcare systems and patient suffering but also to a reduced quality of life in adults, especially in children. 2 We hypothesized that the recently discovered peptide hormone, irisin (IRI), 7 might help in the current diagnosis of appendicitis and distinguish it from nonspecific AP. Over the years, neutrophil count has been proposed in trying to improve the diagnosis of AA, the count being increased during appendicitis.3,5 More recently, Aydin et al 8 had found that neutrophil cells were another main source of IRI that spread within the vascular structures. If so, there might be a link between increased neutrophil count and IRI concentration in cases of appendicitis. Since theoretically this means that an increase in neutro-phils might result in an increased IRI, measurement of IRI might help in the diagnosis of appendicitis and distinguish it from nonspecific AP.
There is now intense interest in IRI, which is cleaved from fibronectin type III domain-containing protein 5 (FNDC5) transmembrane protein; it was discovered initially in skeletal muscle 7 and later in other tissues.9–11 Data on IRI and exercise in humans are not consistent. The majority of researchers have reported that IRI concentration was raised after exercise in skeletal muscle, whereas others were found it to be lower and comparable.12–14 IRI concentration also increases in some metabolic disorders (eg, hypothyroidism, type-2 diabetes mellitus, metabolic syndrome, insulin resistance, chronic renal disease, and anorexia nervosa), whereas its concentration increased in other metabolic diseases or remained unchanged.12,14 In some cases, there was controversy over IRI levels, which might be due to unreliable IRI kits, 14 as well as some (pre or post) analytical mistakes or differences in experimental design used in the tests. 15
The function of IRI is to convert white adipose tissues into brown adipose tissue and an ability to induce a
Based on current scientific information and the hypothesis proposed earlier, the purpose of this study was threefold: (1) to determine immunohistochemically whether appendix tissue synthesizes IRI and compare the IRI levels in cases with and without appendicitis. Should the appendix tissue synthesize its own IRI, it might contribute to overall IRI secretion into the blood stream and other biological fluids in appendicitis; (2) to test how IRI levels change in the blood, urine, and saliva in cases with and without appendicitis and compare them with the levels in patients with AP and in healthy controls; and (3) to compare receiving operating curves (ROCs) for serum, urine, and saliva IRI with those for neutrophils to find helpful parameters for the diagnosis of appendicitis. Since an infected appendix increases neutrophil levels, this is currently the gold standard biomarker for the diagnosis of appendicitis. Increased neutrophils in appendicitis might raise IRI levels, which could then be used as a new indicator of AA.
Materials and Methods
Patients, Samplings, and Ethical Approvement
Twenty control healthy children who were tested negative for cryptor-chidism, inguinal hernia, phimosis, and vulvar fusion at the pediatric surgery department and had no known diseases were recruited. Another 20 patients with appendicitis diagnosed by undergoing appendectomy and 20 patients with AP but without appendicitis were included in the study, giving a total of 60 subjects, aged 7–11±2.2 years. The children were body mass index (BMI) matched. Informed consent was obtained from the parents of all the children before any surgical procedure. All experiments with human samples were approved by the Clinical Research Ethics Committee of Faculty of Medicine, Firat University (date 02/23/2015, session #7), and conducted based on the principles of the Declaration of Helsinki. All the children appetites were evaluated by using a visual analog scale, as previously explained, and also their parents questioned as to whether their sick children had a normal appetite or loss of appetite before entering our hospital. 19 Children with congenital anomalies and/or life-threatening conditions were excluded from the study. None of the children, other than those with AP, suffered from other endocrinological disease or received any related medications. The diagnosis of appendicitis was based on the clinical presentation, ultrasound or computed tomography, and high serum (WBC) count and neutrophil percentage. Sixty urine, saliva, and serum samples [20 samples before surgery (basal), 20 samples at 24 hours after surgery, and 20 samples at 72 hours after surgery] were checked for IRI as previously described. 12 Similar 20 samples from children with AP taken at corresponding times, as also from control subjects (applied to suspected disease, but diseases free after medical checking), but only at T1 in the latter case. Blood specimens for biochemical analysis were drawn from a forearm vein. No extra blood was taken from children other than diagnose purpose or to follow surgery so that the remaining part of blood was used here; urine and saliva were noninvasive.
Tissue and Blood Cells’ Immunochemical Staining
Biological samples were stained using the avidin-biotin-peroxidase complex method as previously described, 20 and as summarized below. First, blood cells were centrifuged at 4000 rms for 10 minutes, and the supernatant was discarded. The cells were washed and then fixed in 4% paraformaldehyde before being embedded in paraffin wax. Tissue samples were also embedded in paraffin wax. These samples were sectioned at 4–5 µm and deparaffinized and passed through a graded alcohol series. After incubating them in citrate buffer at pH 6, they were heated in a microwave oven to recover antigenity before being stained with IRI primary antibodies (diluted 1/400; Phoenix) for six hours at room temperature. Goat antirabbit IgG was used as the secondary antibody. Antibodies were applied, and further washing steps with phosphate-buffered saline were given between and after antibody usage. Two control methods were applied: (1) primary for antibody specificity, the primary antibody step was omitted and only added phosphate-buffered saline in its place and (2) in the other immunohistochemical staining controls, instead of IRI primary antibodies, IgG was added for the immunizations. IRI-positive samples were red colored with a substrate of 3-amino-9-ethylcarbazole + 3-amino-9-ethylcarbazole chromogen, and they were counterstained with hematoxylin before being covered with lamellae. Immu-nostained samples were photographed under light microscopy using an Olympus BX50 camera (Olympus, Tokyo, Japan). Quantitation of the staining in the sections was done using the light microscopy to give an immunoreactive histoscore, based on the modification of Aydin et al, 21 which was determined by screening 200 cells in the staining area for each preparation.
Analytic Measurements
WBC count and neutrophil percentage were measured using an ABX Pentra DX SPS Evolution device (HORIBA, Ltd., Kyoto, Japan). Erythrocyte sedimentation rate was measured using a Vacuplus ESR-120 Full Automated ESR analyzer, and CRP was measured using a Siemens Dade Behring BN II Nephelometer device.
IRI was measured using enzyme-linked immunosorbent assay (ELISA) (Sunred Biological Technology Human Irisin ELISA Kit: catalog no: 201-12-5328). The minimum detection limit of IRI was 0.02 ng/mL, the intraassay variation and the interassay variation being <10%. Assay validation for urine and saliva was performed according to the previously published method. 15
Statistical Analysis
SPSS 21.00 software package was used for statistical analyses. Results are shown as the mean ± standard deviation (SD) for the number of assays indicated. Comparisons between groups were done using the Mann–Whitney
Results
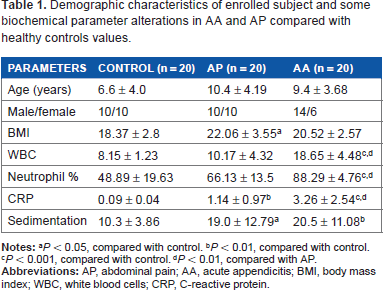
All the surgical procedures were successful, and no complication occurred. There was no significant difference in age and BMI among the three groups. Demographic characteristics of the enrolled subjects and their biochemical parameter alterations with acute appendicities and AP in comparison with control subject values are given in Table 1. Children with appendicitis had significantly raised WBC counts and neu-trophil percentage. Serum IRI and saliva IRI were positively correlated (r: 360,
Demographic characteristics of enrolled subject and some biochemical parameter alterations in AA and AP compared with healthy controls values.
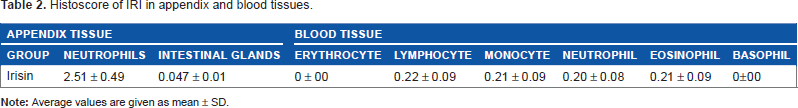
Immunohistochemistry results indicated that appendix tissues (Fig. 1) and blood cells (lymphocytes monocytes, neutrophils, and eosinophils) showed a strong IRI immu-noreactivity, whereas no expression was seen in basophils and erythrocytes (Fig. 2). Neutrophil cells throughout appendix tissues were strongly immunoreactive (Fig. 1). Furthermore, intestinal gland showed mild IRI immuno-reactivity (Fig. 1). IRI was localized in the nucleus of blood cells. Histoscores of IRI in appendix and blood tissues are given in Table 2.

Irisin immunoreactivity of appendix tissues. Neutrophil cells dispersed through appendix tissues (red arrow;

Irisin expression of lymphocytes (
Histoscore of IRI in appendix and blood tissues.
Intraassay variation (coefficient variation) for saliva serum and urine samples was <10% and <15% for saliva serum and urine samples. The kits we used also showed linearity for saliva, serum, and urine samples. Recovery assay results varied between 95% and 104%. These results also indicated that Sunred Biological Technology (Human Irisin ELISA Kit: catalog no: 201-12-5328) kits measure IRI concentrations in saliva and serum as sensitively as in serum.
Children with appendicitis had higher basal (preoperative) serum, saliva, and urine IRI levels compared with the normal subjects and children with AP. However, IRI levels in biological fluids started to decrease at 24 hours postoperatively, returning to basal (preoperative) levels at 72 hours (Fig. 3).
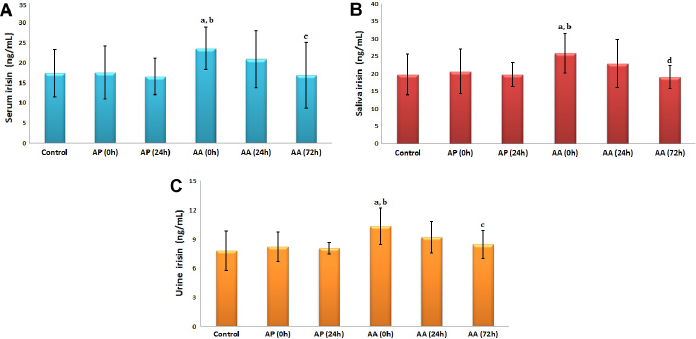
Alteration of timing (0, 24, and 72 hours) IRI concentrations in serum (
ROC analysis indicated that serum IRI gave a specificity of 55% and a sensitivity of 90% when the cutoff value was taken as 17.2 ng/mL; for saliva (sensitivity: 90% and specificity: 60%) at a cutoff value of 19.6 ng/mL; for urine (sensitivity: 90% and specificity: 50%) at a cutoff value of 7.82 ng/mL; for serum CRP value (sensitivity: 90% and specificity: 85%) at a cutoff value of 0.14 mg/dL; and for serum neutrophil count (sensitivity: 90% and specificity: 90%) at a cutoff value of 80.7% (Fig. 4).
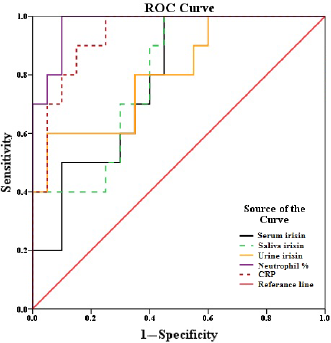
Comparison of sensitivity and specificity values for serum (17.2 ng/mL), saliva (19.5 ng/mL), urine IRI (7.82 ng/mL), neutrophil percentage (80.7%), and C-reactive protein (CRP; 0.141 mg/dL) with ROC in case of acute appendicities. The numbers in parenthesis give cutoff values.
Discussion
AA is the most frequent worldwide disease at any age (both children and adults), characterized by inflammation of the appendix vermiformis, and requires emergency surgical intervention. 5 Even though IRI was discovered in skeletal muscle, 7 it was later shown that biological tissues almost ubiquitously have IRI immunoreactivity, 10 including adipose tissue, 11 but blood cells and appendix tissues had not been examined. Therefore, it was important to determine whether blood cells and appendix tissue synthesize IRI. If so, they might help in the early diagnosis of AA, especially in blood cells, notably because a combination of high WBC count and neutrophilia is currently used to diagnose appendicitis with 95% accuracy. 22
We show for the first time by immunohistochemistry that appendix tissues and WBCs (neutrophils, lymphocytes, monocytes, and eosinophils) are other important sources of IRI, localized in their nucleolus. Erythrocytes, which lack nuclei, 23 proved IRI negative, and therefore, we suggest that they might serves as the best negative control in the future studies. Until now, our negative control has been the omission of IRI antibody, adding only phosphate buffer instead. Therefore, the normal mature erythrocyte can be used as a good second negative control.
We have focused on the role of serum, saliva, and urine IRI in AA and AP in children. Increased levels in the saliva and urine of children with AA were seen, which dramatically decreased after operation. AA directly increases the neutro-phil population in the inflamed tissue, and this is the current gold standard biochemical marker for its diagnosis. This rise in neutrophils may result in the production and release of IRI into the bloodstream and other biological fluids, including saliva and urine, as seen in this study. Appendix tissues also might contribute to the IRI pool in the body, since our results indicate that appendix tissue itself is also a good source of IRI.
There has been some uncertainty about the immunohistochemical assay, despite many articles using this technique to check the presence of IRI in tissues, using many different antibodies from different companies (Abcam, Phoenix, and others) as a function of exercise or other metabolic parameters.13,14,22 However, most present IRI antibodies on the market detect the FNDC5 gene product, which carries a guanine to adenine mutation in the adenine–thymine–guanine start codon, probably resulting in a shorter FNDC5 protein lacking the part from which IRI is generated. Therefore, none of the antibodies was properly validated due to this mutation. The IRI antibody we used came from Phoenix; 24 it most commonly used as an antibody to IRI C-terminal/FNDC5 (57–127) for the immunohistochemical screening of biological tissues, which was raised against Asp–Val–Arg–Met–Leu–Arg–Phe–Ile–Gln–Glu–Val–Asn–Thr–Thr–Thr–Arg–Ser–Cys–Ala–Leu–Trp–Asp–Leu–Glu–Glu–Asp–Thr–Glu–Tyr–Ile–Val–His–Val–Gln–Ala–Ile–Ser–Ile–Gln–Gly–Gln–Ser–Pro–Ala–Ser–Glu–Pro–Val–Leu–Phe–Lys–Thr–Pro–Arg–Glu–Ala–Glu–Lys–Met–Ala–Ser–Lys–Asn–Lys–Asp–Glu–Val–Thr–Met–Lys–Glu. Our previous immunohistochemistry results were repeatable and have been confirmed by other researchers, 10 which is why we retained the Phoenix IRI antibody for our immunohistochemistry of blood cells and appendix tissue. The same antibody from Phoenix Pharmaceuticals was used for the IRI ELISA test [Phoenix Pharmaceuticals, Inc. (#EK-067-29)] and was consistent with results from mass spectrometry. 25 Thus, the Phoenix product accurately recognizes IRI in biological tissues.
We have also presented new data that serum, urine (a new finding), and saliva IRI concentrations are significantly higher in patients with appendicitis compared with those with AP and control subjects. Appendix tissue and WBCs (neutrophils constitute 40%–60% total WBCs, 20%–40% lymphocytes, 2%–8% monocytes, 1%–4% eosinophils, and 0.5%–l% basophils–this low percentage basophils meant that immunohistochemistry did not find them, as also young neutrophils at 0%–3%) 26 could account for raised serum, urine, and saliva IRI concentrations. These findings show that these tissues are another important source IRI, and along with neutrophils being significantly higher in the appendicitis but not in our patients with AP, this makes it likely that AA can more easily be confirmed using both these biomarkers.
There is also uncertainty about the ELISA IRI assays,13,14,22 as also in IRI immuhistochemistry kits. Sunred Bological Technology kits (Human Irisin ELISA Kit: catalog no: 201-12-5328) were used to measure serum, urine, and saliva IRI concentrations. The Kit Producer's catalog notes that these measure over the range of 0.2–6 ng/mL. They also noted that intra- and interassay variations were <10%. Before using the ELISA assay kits in saliva serum and urine samples, assay validation needs to be done according to the previously published methods. Sunred Biological Technology IRI kits give reliable measurements in these biological fluids. Our measurements in normal subjects were comparable or perhaps slightly higher than those of Jedrychowski et al, 25 whose normal value in control subject measured IRI by tandem mass spectrophotometer (no antibody reaction) was 3.6 ng/mL. 25 Our data are also comparable with Phoenix company (catalog no: 67-29), whose kits work on the antigen–antibody principle and give normal IRI concentrations of 3–12 ng/mL. We found that Sunred Biological Technology Human Irisin ELISA Kit was another reliable kit for measuring IRI. As previously shown, IRI concentrations in biological fluids are hugely different from company to company. To measure IRI using the ELISA method, kits’ values need to be in the range of tandem mass spectrophotometer values, since this method does not use antibody during measurement, making it an indirectly measurement. Tandem mass spectrophotometer IRI concentrations should be accepted as the gold standard, 25 but it should keep in mind that study had no protease inhibitor used to protect IRI from protease. We should also keep in mind that poorly validated assays will lead to controversy, which is why we recommend that each laboratory should carry our validation assays to ensure reliable, consistent, and comparable data. 15
In conclusion, our study suggests that serum, saliva, and urine IRI concentrations are increased during inflammation as seen in AA and that this increase can be used as a predictor of AA in children. These elevated IRI concentrations were higher than in children with AP or healthy controls. IRI is, therefore, a suitable biomarker for clinical use with a high diagnostic accuracy [see the data above on sensitivity and specificity of all the samples and also that of serum neutrophil count (sensitivity: 90% and specificity: 90%)]. Immunohisto-chemically stained appendicitis tissues for the IRI antibody also give an indication (confirmation) of changes in functional parameters, just as the increased neutrophils do.
Conclusions
There are also some limitations with the study. The main limitation of our study is the small number of patients, and no power calculation has been done. The other limitation is that this is a single-center study. Beside above limitations, taking saliva and urine samples for IRI measurement presents a new and amenable way for an early diagnosis of appendicitis, especially for children, for which taking serum is more invasive.
Author Contributions
Conceived and designed the experiments: SA, UB. Analyzed the data: SA, MY, MK, TK, GA. Wrote the first draft of the manuscript: SA. Contributed to the writing of the manuscript: UB, SA, AK. Agree with manuscript results and conclusions: SA, UB, AK. Jointly developed the structure and arguments for the paper: SA, UB, MS, AK. Made critical revisions and approved final version: SA, UB, MS, AK. All authors reviewed and approved of the final manuscript.