
Abstract
Objective
The purpose of this research work was to evaluate complex cystic breast lesions by advanced MRI techniques and correlating imaging with histologic findings.
Methods and Materials
In a cross-sectional design from September 2013 to August 2015, 50 patients having sonographically detected complex cystic lesions of the breast were included in the study. Morphological characteristics were assessed. Dynamic contrast-enhanced MRI along with diffusion-weighted imaging and MR spectroscopy were used to further classify lesions into benign and malignant categories. All the findings were correlated with histopathology.
Results
Of the 50 complex cystic lesions, 32 proved to be benign and 18 were malignant on histopathology. MRI features of heterogeneous enhancement on CE-MRI (13/18), Type III kinetic curve (13/18), reduced apparent diffusion coefficient (18/18), and tall choline peak (17/18) were strong predictors of malignancy. Thirteen of the 18 lesions showed a combination of Type III curve, reduced apparent diffusion coefficient value, and tall choline peak.
Conclusions
Advanced MRI techniques like dynamic imaging, diffusion-weighted sequences, and MR spectroscopy provide a high level of diagnostic confidence in the characterization of complex cystic breast lesion, thus allowing early diagnosis and significantly reducing patient morbidity and mortality. From our study, lesions showing heterogeneous contrast enhancement, Type III kinetic curve, diffusion restriction, and tall choline peak were significantly associated with malignant complex cystic lesions of the breast.
Introduction
Although sonographic features of complex cystic lesions of the breast have been described vividly in literature, evaluation of such lesions on MRI is still in progress. Cystic lesions of the breast include a wide spectrum of breast diseases ranging from a simple cyst to the rare papillary intracystic carcinoma. Complex cystic masses are defined as lesions that contain anechoic (cystic) and echogenic (solid) components. 1 The solid component can be in the form of either thick walls/septations (≥0.5 mm) or mural nodules.
Breast MRI has become an integral and necessary component of any breast imaging practice. The clinical uses of breast MRI are now standardized and much more defined than they were several years ago. In the past few years, great strides have been made in the realm of defining indications and findings on breast MRI. Breast Imaging Reporting and Data System (BI-RADS®) lexicon 2 has a section regarding breast MRI that has already been revised in its latest edition.
As a cross-sectional imaging technology, breast MRI provides new insights in the analysis of breast lesions. The distribution of fibroglandular tissue and fat is easily seen and wide variations of breast compositions are appreciated. Noncontrast MRI can easily distinguish cysts and blood products based on their T1 and T2 values. Lesion enhancement patterns can differentiate complicated lesions from complex cystic lesions.
Apart from routine MRI of the breast lesions, other newer MR techniques hold great promise in the evaluation of these lesions. These novel MR techniques include dynamic contrast-enhanced MRI (DCE-MRI), diffusion-weighted imaging (DWI) studies, and MR spectroscopic (MRS) analysis of the lesion. DCE-MRI, DWI, and MRS provide information about the chemical environment of the lesion that cannot be obtained from ultrasonography (USG). It has multiplanar capabilities and helps in detecting bilateral, multicentric lesions more so in dense breasts, which lower the sensitivity of lesion detection on USG. In specific clinical conditions like abscess, MRI techniques such as DWI can be extremely helpful in clinching the diagnosis.
Materials and Methods
Study Settings
This study was conducted over a period of two years. Patients presenting with clinically palpable breast lesions or with pain/nipple discharge having complex cystic lesions on ultrasound were taken up for MRI evaluation. The patients were in the age range of 15–70 years, with mean age of 41 years. Average duration from MRI to histopathology result was around one month.
The investigations to be performed were explained to each patient, and written informed consent was obtained from all the patients. This study was approved by the ethics committee of the institute, and conducted in accordance with the principles of the Declaration of Helsinki. All patients underwent fine needle aspiration cytology (FNAC)/biopsy post MRI scan.
Image Acquisition
MRI was carried out using a Siemens Magnetom Skyra 3.0 T scanner (Siemens Healthcare) and a dedicated bilateral breast surface coil. History of any previous intervention, surgery, metallic implants, pacemaker, or any other ferromagnetic material was taken. The patient was placed in the prone position, with both breasts in a breast array coil. Adequate comfort of the patient was ensured to minimize patient motion during examination. An 18–20G intravenous cannula was put in the contralateral antecubital vein and connected to a pressure injector (Medrad, Spectris Solaris EP) when performing a DCE-MRI.
Imaging Protocol and Parameters
Inversion recovery axial images were obtained with TI = 230 milliseconds, TR = 3300 milliseconds, TE = 63.0 milliseconds, slice thickness = 4 mm (with interslice gap of 0.6 mm), field of view = 300 × 300, and image matrix = 384 × 384. T2-weighted axial images were obtained with TR = 8060 milliseconds, TE = 159 milliseconds, slice thickness = 4 mm (with interslice gap of 0.6 mm), field of view = 300 × 300 mm, and image matrix = 448 × 448. Precontrast T1 axial images were obtained with TR = 6.0 milliseconds, TE = 2.6 milliseconds, FOV = 320 × 320 mm, slice thickness = 1 mm (with no interslice gap), and image matrix = 336 × 448.
DCE-MRI was performed after injection of 10 mL of Gadoterate Meglumine (Dotarem®, Guerbet) at the rate of 2.5 mL/second by pressure injector followed by saline chase over 10 seconds. Five sequential contrast-enhanced images were acquired. Subtracted images were obtained by extracting the unenhanced images from the corresponding enhanced images on a pixel-by-pixel basis using the standard subtraction software function available on our console. The fourth set of images was assessed for enhancement pattern. The dynamic curves were drawn using the Syngo Mean Analysis software provided by Siemens.
DWI Protocol
Axial DWI with single-shot echo-planar imaging was performed on precontrast scans at b values = 0, 400, and 800, TR/TE: 4400/55, FOV: 138 × 340 mm, matrix of 78 × 192, and slice thickness of 5 mm. The apparent diffusion coefficient (ADC) values were automatically calculated by placing a subregion region of interest (ROI) 3 well within the confines of the lesion. Three-dimensional ROIs were drawn manually on noninterpolated DW images in all lesions and additional normal tissue regions. The solid component showing maximum enhancement was chosen, while necrotic areas were avoided. The scanner software provided the mean value within the ROI, which equals the ADC value (multiplied by 10–3) in millimeter square per second.
MRS Protocol
Single-voxel 1 H MR spectroscopy was performed in the enhancing lesions by using a point-resolved spectroscopic sequence with TR = 1500 milliseconds, TE = 100 milliseconds, acquisition time of approximately 6.3 minutes, and 128 acquisitions. Generally, a voxel size of 1 cm × 1 cm × 1 cm was used for adequate signal-to-noise ratio. Localized shimming, high-quality spatial saturation pulses, fat suppression, and partial water suppression were used to improve the quality of the spectra. Using the tumor itself and a reference solution in the breast coil, both internal and external references were generated. The normalized integral values were automatically generated by the Syngo GRACE software provided by Siemens.
Proton magnetic resonance spectroscopy was analyzed for the presence of water peak at 4.7 ppm, choline peak at 3.2 ppm, and lipid peak at 0.9 and 1.3 ppm.
Lesions were classified as benign or malignant b® lexicon for MRI reporting. Apart from this, emphasis was laid upon the dynamic curve, DWI, and MRS results. Using Mean curve analysis software, we generated an enhancement kinetic curve, which was analyzed with kinetic parameters derived from the curves as described by Kuhl et al. 4 Type I curve showed progressive enhancement pattern, Type II showed plateau pattern, and Type II showed washout pattern on delayed phase images. Lesions showed high signal on DWI and low signal on ADC maps. ADC cutoff value was taken as ≤0.9 × 10⁻³ mm2/second for the presence of diffusion restriction in accordance with the findings established by Kul et al. 5 Choline peak was considered significant when the normalized integral value was more than 1.5 AU/mL.
Statistical Analysis
The data collected were statistically analyzed using appropriate statistical tools. All the statistical data were assessed for the sensitivity, specificity, positive predictive value, negative predictive value, and diagnostic accuracy of these different techniques as compared with the histopathological findings.
The SPSS version 16.0 statistical package for Windows (SPSS Inc.) was used for statistical analysis. The mean age was determined. The statistical significance of various MRI techniques was established with respect to the malignant lesions on histopathology using chi-square and Fisher's exact test. For these tests, a P-value less than 0.05 was considered statistically significant. Receiver-operating characteristic (ROC) curves were drawn for ADC values and a mean was derived.
Results
Of the 50 lesions evaluated on MRI, 17 were classified as malignant, while 33 were called benign. Mean lesion size was 3.17 cm, while the range was between 1.1 and 14.6 cm.
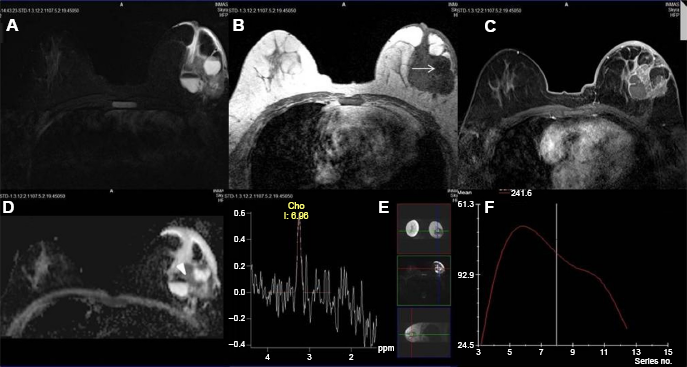
After histopathology, 18 lesions turned out to be malignant, whereas 32 lesions were benign. The false-negative case was an invasive ductal carcinoma, which showed homogeneous enhancement, a Type II curve, and lack of choline peak. No associated lymph nodes, skin thickening, architectural distortion, or nipple retraction was observed. However, it showed diffusion restriction on DWI. Of the 18 malignancies, 14 patients had infiltrating ductal carcinoma, 3 had ductal carcinoma in situ, and 1 had medullary carcinoma. Benign lesions included 12 fibrocystic changes, 7 abscesses, 5 intraductal papillomas, 3 cysts, 2 fibroadenomas, and 1 patient of mastitis, phyllodes tumor, and galactocele each. The spectrum of images obtained using different MRI techniques are shown in Figures 1–4.
Biopsy proven case of benign phyllodes tumor. ( FNAC proven case of breast abscess. ( Biopsy proven case of invasive ductal carcinoma. ( Biopsy proven case of intraductal papilloma. (


Imaging characteristics and statistical analysis of malignant complex cysts

All 13 lesions with Type I curve were benign, while all the 13 lesions with Type III curve were malignant. Type II curve was expressed by 14 lesions out of which 9 (62%) were benign, while 5 (38%) were malignant. With Type III curves, all the lesions were malignant (100%) with a positive predictive value and a specificity of 100%.
All the malignant lesions showed diffusion restriction, whereas 22 of the 32 benign lesions showed no restriction. The mean ADC was 1.2 × 10—-3 (0.729 × 10—-3 for malignant and 1.588 × 10—-3 for benign). The area under the curve (AUC) was 0.920, which implied excellent quality. The DWI alone with an ADC cutoff value of 0.9 × 10—-3 mm2/second showed a sensitivity of 100% and a specificity of 68.8% with a positive predictive value of 64.3%, a negative predictive value of 100%, and a diagnostic accuracy of 80%.
Almost all lesions (17/18) classified as malignant expressed a tall choline peak (integral value more than 1.5 AU/mL), while four benign lesions showed a positive choline peak. MR spectroscopy was 94.4% sensitive and 87.5% specific in identifying a malignant lesion. It showed a positive predictive value of 81% and a negative predictive value of 96.5%, with a diagnostic accuracy of 90%.
Discussion
Breast MRI has become an integral and necessary component of breast imaging, with newer advances being made in this field constantly. BI-RADS® lexicon that was earlier limited to mammography and ultrasonography now has standard definitions for reporting breast MRI. High resolution and contrast provided by MRI proves to be of great help in detecting smaller lesions and characterizing them adequately.
The average age of the women in this study was 41 years (age range: 15–70 years). The incidence of malignancy was almost symmetrically distributed in the various age groups with no statistical significance seen between the different age groups (P-value = 0.19).
In the present study, 18 of the 50 complex cystic masses (36%) were proved malignant. The malignancy rate is slightly higher than that in the study conducted by Berg et al, 6 which reported that 18 of 79 lesions (22.7%) were malignant, and in the study by Pongrattanaman and Prueksadee, 7 which found that 26 of 103 complex cystic lesions (25.2%) were malignant. It is relatively lesser than that observed by Chang et al, 8 in which 40 of 80 (50%) lesions were malignant.
Magnetic resonance evaluation showed that 34% (n = 17) of the lesions had irregular shape, while 32% (n = 16) of the lesions had not circumscribed margins on conventional T1 and T2WI and most of these turned out to be malignant. The cystic lesions appeared hypointense on T1WI and predominantly hyperintense on T2WI and IRM images. Few of these lesions appeared isointense on T1WI. The solid components in these lesions showed low-to-intermediate signal intensity on T2WI.
On DCE-MRI, the predominant pattern of enhancement shown by malignant lesions was of heterogeneous type, while Type III curve (13/18) was the predominant kinetic curve. All malignant lesions showed restriction of diffusion on DWI, which was statistically significant. The overall sensitivity of DWI was 100% with a specificity of 68.7%. Kul et al 5 in their study on 84 patients found that median ADCs of the benign and malignant lesions were 1.26 × 10⁻³ mm2/second and 0.75 × 10⁻³ mm2/second, respectively, and a cutoff value of 0.92 × 10⁻³ mm2/second for ADC provided 91.5% sensitivity and 86.5% specificity. Bansal et al 9 in their study on 3 T system obtained an ADC cutoff value of 1.1 × 10⁻³ mm2/second for malignant lesions, a sensitivity of 92.80%, and a specificity of 80.23%. In our study, the mean ADC value of malignant lesions was 0.729 × 10⁻³ mm2/second and that of benign lesions was 1.588 × 10⁻³ mm2/second. ROC curves were drawn and a cutoff value of 0.88 × 10⁻³ mm2/second provided a sensitivity of 94.4% and a specificity of 81.2%. On MR spectroscopy, all the malignant lesions barring one revealed a tall choline peak, while there were four benign lesions that showed the same. Sardanelli et al 10 proposed that the total choline-containing compound (Cho) peak integral can be used as a marker of malignancy in breast MR spectroscopy and provided an optimal threshold of 0.85 AU/mL for the normalized tCho peak integral with 0.842 (16/19) sensitivity, 0.885 (23/26) specificity, and an AUC of 0.941 (0.879–1.000). Dorrius et al 11 used a threshold of the Cho concentration of 1.5 mM as the distinction between benign and malignant lesions on a 1.5 T machine, the ROC analysis for which revealed an AUC of 1.00. In 2005, Meisamy et al 12 evaluated the addition of the internal water reference method of MRS to DCE-MRI at 4 T for breast lesion assessment. The sensitivity and specificity of diagnosis using tCho concentration alone, with a cutoff threshold of 1.05 mmol/kg (as determined by ROC curve analysis), were 69% and 90%, respectively. Bartella et al 13 in their study on 57 patients with breast lesions found that a choline peak was recorded in 31 (100%) of 31 malignant lesions, thereby achieving 100% sensitivity. The malignancy rates with a raised choline peak were higher and statistically significant when compared with benign lesions.
Conclusion
Although ultrasound remains the mainstay for investigating all cystic lesions of breast including complex solid cystic lesions, magnetic resonance imaging including novel techniques like dynamic contrast enhancement, diffusion, and spectroscopy studies can prove useful in the discrimination of benign from malignant pathologies. MRI findings such as heterogeneous enhancement, Type III kinetic curve, diffusion restriction, and choline peak strongly point toward a malignant solid component of the complex cyst. By using a combination of these modalities, greater level of diagnostic confidence can be achieved and judicious decision of prompt biopsy can be taken for early detection of malignancy. The major limitation was the small sample size and the lack of work on advanced MRI techniques in complex cystic breast lesions.
Author Contributions
Conceived and designed: MBP. Analyzed the data: MBP and PG. Wrote the first draft of the manuscript: PG and DA. Contributed to the writing of the manuscript: PG, DA, PK, and PJK. Agreed with manuscript results and conclusions: MBP, PG, and DA. Jointly developed the structure and arguments for the paper: MBP, and PG. Made critical revisions and approved the final version: MBP, PG, and DA. All the authors reviewed and approved the final manuscript.