
Abstract
It has been long known that DNA molecules encode information at various levels. The most basic level comprises the base sequence itself and is primarily important for the encoding of proteins and direct base recognition by DNA-binding proteins. A more elusive level consists of the local structural properties of the DNA molecule wherein the DNA sequence only plays an indirect supportive role. These properties are nevertheless an important factor in a large number of biomolecular processes and can be considered as informative signals for the presence of a variety of genomic features. Several recent studies have unequivocally shown the benefit of relying on such DNA properties for modeling and predicting genomic features as diverse as transcription start sites, transcription factor binding sites, or nucleosome occupancy. This review is meant to provide an overview of the key aspects of these DNA conformational and physicochemical properties. To illustrate their potential added value compared to relying solely on the nucleotide sequence in genomics studies, we discuss their application in research on transcription regulation mechanisms as representative cases.
Introduction
It is well understood that DNA in living cells is not a uniform linear macromolecule but displays local structural variations that depend on the base sequence. This intrinsic variability in the DNA structure has been found to play a key role in several biological processes. The structure of a DNA molecule is primarily determined by its nucleotide sequence, so that similar DNA sequences have similar DNA structures. The reverse is not always true however: DNA molecules with similar structural properties can arise from different sequences. This redundancy is the reason that the DNA molecule is described as having at least two levels of information.1–3 The first level consists of the basic nucleotide sequence string, which is primarily used as the ‘genetic code’ central to gene coding. A second information level is present in the different properties of the intrinsic DNA structure, where the DNA sequence itself only plays a supporting role. These DNA structural properties are various characteristics of the molecular structure that can be assigned a numeric value based on theoretical simulations or experimental measurements. As the DNA molecule is highly variable at many different levels, from the local stability of the helical duplex to the global conformation of the molecule, so are there many possible DNA structural properties which can be defined. It is not surprising that these structural properties can have a large impact, as most genomic processes involve some sort of change in the DNA structure such as the denaturation required prior to the start of duplication and transcription, protein-induced deformation at DNA-protein complex formation, or the extensive nucleosome packaging of an entire genome. Several studies have shown that to create an accurate model to predict or describe these processes, one must account for the presence of these local structural properties of the DNA molecule. The use of intrinsic DNA structural properties has therefore seen a broad range of applications in genomics in the past decade. In this review we aim to give an overview of the terminology and key aspects of these DNA structural properties, and illustrate their potential added value compared to relying solely on the nucleotide sequence in genomics studies.
We first discuss the basic principles of modeling the properties of the DNA structure from the nucleotide sequence. Epigenetic modifications and specific spatial DNA structures, such as G-quadruplexes, are beyond the scope of this review because their characterization substantially differs from the DNA structural properties as discussed here.4–8 The later sections then discuss two well-studied cases to illustrate the use of DNA structural properties in the classification of genomic elements. Because of the wide array of applications, we have limited ourselves to research on transcription regulation mechanisms as representative cases. The identification of small elements at a position-specific level will be evaluated in the scope of locating potential sites of protein-DNA complex formation in the genome, eg, transcription factor binding sites. The characterization at a coarser level of large genomic elements will be illustrated by gene promoter prediction.
Definitions as used in this review.
Structural property: specific characteristic of the DNA molecular structure, such as stability, rigidity (or the converse flexibility), or curvature.
Conformational property: structural property relating to the static DNA structure, sometimes termed geometrical property, ground-state structure or structural property in the literature.
Physicochemical property: structural property relating to the dynamic DNA structure implying its potential to change conformation, sometimes termed chemical property or mechanical property in the literature.
Structural scale: Look-up table enumerating all oligonucleotides of a given length and their corresponding values for a certain structural property.
Structural profile: vector of values for a given structural property for every position in a DNA sequence, typically derived from a structural scale.
Higher-order model: A mathematical model which explicitly includes terms for interactions between various observations. Eg, a higher-order dinucleotide sequence model is able to account for the dependency between two sequential base pairs.
Functional genomic element: discrete nucleotide sequence present in the genome with a specific biological role.
Structural Properties, Scales and Profiles
The structural properties of the DNA molecule can be roughly divided into two categories, the conformational and the physicochemical properties, although these terms are not strictly defined and there is some conflicting terminology in literature.9–12 In this review, we adhere to the most typically used definitions: The conformational properties refer to details of the static DNA structure and how this is influenced by base pair sequences, resulting in translational (eg, slide, rise and shift) or rotational (eg, roll, twist and tilt) variation between successive base pairs and variations in the width and depth of both the major and minor groove (important in several biological processes). At a coarser level, one can also consider the local bends present in the sequence or the curvature of the DNA molecule across large distances or more global properties such as the shape/form in which the DNA molecule is present; in most living cells this is limited to the A-form, B-form or Z-form. The physicochemical properties on the other hand, refer to the dynamic potential of the DNA structure or the free energy stored within different conformations. As the DNA molecule is anisotropically deformable along any axis, several properties can be defined which capture the extent of resistance displayed by the DNA molecule to various changes. The denaturation temperature is also known to vary depending on the molecular structure of the double stranded DNA molecule. This intrinsic variability in denaturation potential can be described by for instance the stacking energy between base pairs or the global free energy of the DNA duplex.
As mentioned before, the structural properties of a stretch of DNA are determined by its nucleotide sequence. A DNA molecule with the same nucleotide sequence will have the same structural properties. It is therefore theoretically possible to predict the entire DNA structure and all of its properties if one is given the DNA sequence. This is currently being done with great accuracy using molecular simulations.13,14 However if one is only interested in a specific set of properties of the DNA structure, there are many models available for DNA structural property prediction derived from experimental or theoretical data. It has been demonstrated that most structural properties are very local features and primarily depend on the neighboring nucleotides of a certain position. Often one can achieve reasonable predictions of the structural properties by simply accounting for the contribution of every di- or trinucleotide to the structural property. Such oligonucleotide contributions are usually represented in a structural scale, a look-up table listing every possible oligonucleotide and a corresponding value which represents the contribution to a given structural property. The length of this oligonucleotide is referred to as the order of the structural scale, eg, a dinucleotide scale is of the second order. Higher order structural scales will always be more informative yet require exponentially more data to enumerate. Most structural scales exist for dinucleotides as they are typically considered the best trade-off between accuracy and complexity. A number of the most frequently used structural properties and their scales are listed in Table 1.
Examples of structural properties.

The structural profile represents the variability of a structural property along a given sequence of DNA. It is constructed by looking up the corresponding structural scale values for every successive oligonucleotide in the sequence (Fig. 1). This profile will then correspond to the variation that exists for the given structural property over the given sequence. Note that the vector of this structural profile always has a length equal to the length of the sequence subtracted by one less than the order of the structural scale used, eg, converting a sequence with a dinucleotide scale results in a vector with a length equal to that of the sequence minus one. Three types of features are typically derived from the structural profile that aid in the computational analysis of different genomic elements. The raw profile, or the unmodified structural vector as derived from the structural scales, is often used for position specific effects, eg, modeling the induction of a kink into a single dinucleotide. An average structural profile is the mean of the structural values calculated over all positions in a predefined region. This average profile is usually calculated for broader genetic elements, such as promoter regions. Another common procedure after calculation of the structural profile is the smoothing of the values. This is a rescaling of every value according to a smoothing function that takes into account the values of the neighboring positions, typically by using a short sliding window. The smoothing function could be as simple as averaging the values in the window and results in a smoothed structural profile. As the size of the sliding window is increased (ie, more neighboring positions affect the rescaling), the general patterns in the structural profile will become more pronounced. However if the smoothing range is chosen too high, the information loss will be too great and any important patterns in the structural profile might no longer be visible. 2

Modeling structural properties of the DNA.
Several databases exist where one can look up or apply a structural scale of interest. The PROPERTY database is one of the earliest collections of structural scales and is at the time of writing still available and listing 35 different structural properties. 9 In addition the SITECON web tool can calculate structural profiles for 38 different properties, and if provided with a training set can identify informative features therein. 11 The more recent DiProDB contains a list of 125 structural scales. 15 A downloadable tool DiProGB allows for calculation of the structural profiles using these scales, or with any user-provided dinucleotide scale. 16 Unfortunately both databases are limited to dinucleotides scales, which may be insufficient for some structural properties. 17 While higher-order scale collections do exist, they have seemingly never been made available in a straightforward manner. 18
Determining Sites of Protein-DNA Complex Formation
DNA structural properties can aid the targeting and functionality of DNA-binding proteins in a wide variety of manners. The common hypothesis is that proteins will find their binding sites by random hopping and sliding along the DNA structure. 19 Several studies have shown that rigid and curved DNA molecules will aid in this process. 20 Furthermore the specific DNA binding sites of a protein will typically carry recognition features in their structural properties which can be accessed by the protein through ‘indirect’ readout. 21 This is distinguished from ‘direct’ readout, were specific bases in the DNA are recognized by the protein binding domain; both direct and indirect readout can contribute to protein-DNA binding.1,3,21,22 The importance of the DNA structure for protein-DNA complex formation lies in the fact that most proteins require the DNA molecule to be present in a specific conformation during complex formation, typically necessitating the deformation of the DNA binding site. It has been shown that proteins will prefer to bind to DNA molecules which easier accept the needed conformation, either because they naturally exist in this state or because they offer little resistance to take on this new state. The energy required for any such deformation can be compensated by favorable contacts made within the complex. 23 Many reviews on protein-DNA interactions are available, such as Rohs et al 24 The functionality after DNA-binding can also be influenced by the DNA structural properties as many biological processes require the DNA molecule to adapt to a specific conformation, for example a DNA-loop which can facilitate protein-protein interactions at long distances. 25
Consensus structural profiles
The most common approach for characterizing protein-DNA binding sites, is through a consensus profile approach. This is especially widely used for transcription factors (TFs). Transcription factors are an important class of DNA binding proteins that will, upon binding the DNA molecule, either activate or repress the transcription of the neighboring gene. TFs typically recognize a specific motif present in the nucleotide sequence and most cause significant distortion of the DNA molecule upon binding. There is great variation between different TFs and no unique nucleotide or structural motif can be attributed to the ensemble of binding sites, and they therefore present an ideal case how DNA structural properties can be beneficial in identifying their binding sites. In a consensus profile framework, the recognition characteristics of a protein are estimated based on an analysis of its known binding sites typically by searching for features (in the DNA sequence and/or the DNA structural properties) which distinguish this set of sites from the genomic background. The direct read-out preferences of a given protein can be represented by a consensus sequence, often represented as a ‘motif logo’. 26 In a similar manner the indirect read-out can be partially represented by a set of consensus structural profiles. 27 This type of consensus profile can be constructed from a set of known binding sites for a certain structural property by many different methods, such as calculating the average profile, averaging specific regions, Fourier analysis or error minimization.9,11,27–29 The structural profiles of unknown sites can be compared to the consensus profile and scored accordingly (Fig. 2, left hand panel) and the contributions of different structural properties can be estimated by simple linear regression or linear discriminant analysis.9,28,30 However, relying on consensus profiles alone provides poor classification performance for the most simple methodologies, likely due to the large amount of possible structural properties and the importance of the direct recognition mechanism in the specificity of many TF proteins. 30 Most recent binding site classification methods now use a combination of both sequence data and structural properties and as such require more advanced classification methodologies such as Support Vector Machines, Bayesian Networks, Neural Networks, Hidden Markov Models or Conditional Random Fields.10,12,31–35 These methods have the added advantage of inherently selecting or upweighting the most informative structural profiles and, depending on the model design, the most informative positions. Integration of structural properties with the simple base sequence has been shown to improve classification performance compared to existing methods using only sequence information.32,35 A brief overview of methodologies using the structural consensus approach can be found in Table 2. Unfortunately, as of yet there has been no large scale comparison of different methodologies for representing binding sites by incorporating structural profiles. Such a comparative survey is complicated due to the incompatibility of these methods in two ways. First, the structural profiles that are employed cannot always be separated from the methodology itself. Different structural scales capture different aspects of the DNA structure, and this could partly explain any variation in performance. Secondly, these methodologies generally have a specific application focus and often integrate a wide range of independent data into the model, eg, evolutionary conservation scores or cis-regulatory module information. 34 This creates an intrinsic bias in any comparison of different methods and due to the variable nature of TFs and the different organisms in which they reside, no methodology will likely outperform all others in any potential application.

Predicting DNA binding from DNA structural properties.
Summary of DNA-binding protein consensus approaches.

Protein-DNA threading
In some cases, instead of possessing only a set of binding site locations for a given DNA-interacting protein, a detailed 3D structure of the protein-DNA complex is known. With this information, one could use a protein-DNA threading approach as well (Fig. 2). These screen for target sites of DNA-binding proteins by modeling the complex formation. From solved complexes, the bound conformation of the protein and the DNA molecule can be derived, as well as their intermolecular interactions. A common approach to evaluate other target sites is to then ‘thread’ novel DNA sequences (eg, along a genomic region) into the required conformation and calculate the formation energy, or an equivalent approximation, of the resulting complex. Part of the formation energy can be the result of the deformation needed to change the intrinsic DNA superstructure to the required bound conformation (Fig. 2, right hand panel).36,37 Use of the aforementioned deformability scales are one possible way to calculate the energy that is required for this DNA conformation change.38–41 This deformation energy can then be integrated into the energy function of the protein-DNA complex.42,43 The resulting energy can then be used to assess the viability of the formation of the protein-DNA complex at a given genomic site.
While the actual biomolecular mechanism of protein-DNA binding are more firmly rooted in these threading approaches than relying on consensus profiles, there are drawbacks as well. For instance, there is no guarantee that different DNA sequences will display the same conformation when bound by the protein than the sequence that was used to construct the 3D model.1,44,45 The major limitation for the widespread application of protein-DNA threading for binding site prediction however, is not due to its methodological principals but rather due to a lack of ‘solved’ protein-DNA complexes. Threading approaches require the bound protein-DNA complex or that of a related protein to be known, which is not very common for many DNA-binding proteins such as TFs. 46 More often these approaches are used for well characterized protein-DNA complexes, such as the nucleosomes responsible for the higher-order packing of the DNA molecule into chromatin in eukaryotes. Because it affects the genomic accessibility, this DNA packing has a critical role in various cellular processes, among which transcription regulation. Given this interest, predicting nucleosome positioning currently forms the bulk of protein-DNA threading that relies on DNA structural properties.39,41,44,45 While these methodologies do successfully increase prediction, it is well known that there are many other factors that drive the positioning of nucleosomes and that can confound the contribution of certain DNA characteristics in nucleosome formation.47–49 In that respect, there has also been some discussion based on recent evidence suggesting that the main experimental technique for determining nucleosome occupancy may generate biased results, which, if true, would also affect the perceived dependence of nucleosome occupancy on DNA sequence and/or structure.50,51
Identification of Gene Promoter Regions
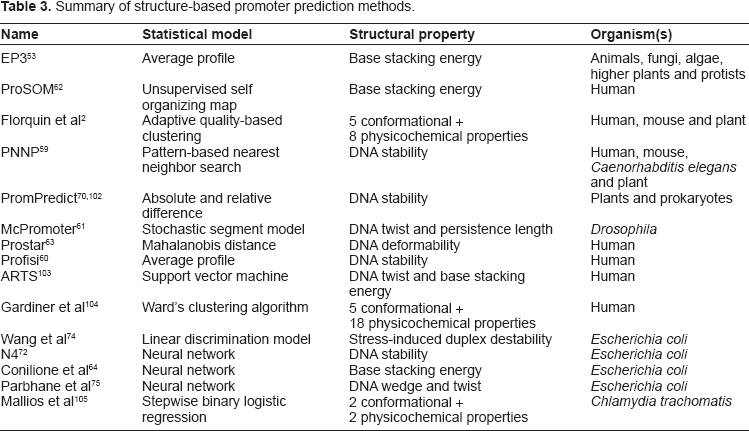
Different genomic regions are known to display unique structural characteristics. 52 Many statistical models have therefore been built to identify the presence of a given genomic region based on its structural properties. The most widely used among these applications are those that attempt to predict the promoter region. Promoters are the regions upstream from genes, where the RNA polymerase is recruited and transcription is started. Promoters seem to share similar structural profiles that can be related to their function. Exploiting the common patterns in these profiles has been known to increase the performance of promoter prediction algorithms. The structural profiles for individual promoters are however very noisy, and identifying these common patterns require complex modeling methods. Even then predictions remain coarse and cannot identify the exact transcription start site (TSS), but only the general promoter region. Furthermore, the structural profiles of promoters differ greatly between eukaryotes and prokaryotes as the transcription complexes are radically different. Most promoter prediction methods are therefore tuned to a single taxonomical domain or even a single species, with few exceptions that typically require retraining for novel organisms. A brief summary of structure-based promoter prediction methods can be found in Table 3.
Summary of structure-based promoter prediction methods.
Predicting eukaryote promoters
In eukaryotes the promoter region can be divided into three parts: the core promoter where the basal transcription complex binds, the proximal promoter where most transcription factor binding sites are located and the distal promoter that can contain enhancer elements. The promoters themselves can be grouped according to the RNA polymerase that binds to them. The targets of the different RNA polymerase have different recognition elements and therefore different structural profiles. 53 Most promoter prediction methods will focus on RNA polymerase II which transcribes protein-coding genes and most microRNAs. On average, these promoters are described as being more rigid than the remainder of the genome, but the actual structural profile of promoter flexibility is much more complex.54,55 The global rigidity is most likely necessary to exclude nucleosomes from the promoter region, as they will compete with the binding of transcription factors and the basal transcription complex. The proximal promoter is usually characterized by a decrease in the rigidity of the promoter. 54 The hypothesis is that the binding sites of transcription factors need to be flexible to allow complex formation. There is likely a careful trade-off between rigid DNA stretches blocking nucleosomes and small flexible regions attracting transcription factors.54,56 Indeed the promoter activity seems to correlate with the proportion of flexible regions in the whole fragment. 57 The core promoter is typically characterized by a gradual decrease in rigidity from upstream of the TSS to downstream.2,54,57 Extreme rigidity values embedded in this region match with known promoter elements. For example, the TATA-box corresponds to a very rigid region in the promoter. This rigid peak at the –30 position can still be observed even if no explicit TATA motif is present, which lead to the hypothesis that this rigidity feature is more important than the actual sequence motif and could partially explain why many promoters lack a clear TATA motif.2,58 Eukaryotic promoters are also typically more stable than the genomic average with peaks of heavy instability at the promoter elements, such as the TATA-box and the TSS. Likely this contrast helps direct the transcription complex to the correct transcription start site. 59 A conceptual overview of the main structural features of eukaryotic promoters is given in Figure 3 (left hand panel).

Conceptual representation of structural features of eukaryotic and prokaryotic promoters.
A number of methods have been proposed to translate the complex structural profiles of eukaryotic promoters into features which can be used in promoter prediction with varying success. The most straightforward approaches classify promoters by comparing an averaged structural profile for a stretch of sequence to a set threshold. Such methods have relied for instance on the base stacking energy as a representation of the stability, or the DNA melting temperature as defined by an extensive calculation of the genome-wide DNA duplex stability.53,60 Averaging out the structural properties will unfortunately ignore the typical structural patterns observed for promoters. Other methods try to directly use the pattern contained in the structural profiles. The McPromoter method does this by dividing the promoter into smaller regions and models the average of the structural profiles in every segment as a single observation from a Hidden Markov Model. 61 Out of all the tested structural properties, the DNA twist, the persistence length and the propeller twist were found most informative for predicting Drosophila melanogaster promoters. The PNNP method uses a pattern-based distance nearest neighbor search where promoters are classified if the maximum deviation from the relative profile is smaller than a threshold. 59 In this manner PNNP is able to model promoters which have a similar pattern in the structural profile but at a different absolute level, as observed for promoters containing CpG islands and those that don't. PNNP predictions based on the DNA duplex free energy gave the best performance. ProSOM uses an unsupervised self-organizing map to cluster the base stacking energy profile of various sequences into subgroups. 62 Classification of promoters in this case consists of attempting to cluster the structural profile of the unknown sequence with a known set of promoters. This approach has the advantage of accounting for different groups of promoters. The general conclusion for most of these methods using only a single or few structural properties, is that they are able to get a classification performance equal to or often greater than methods using a large number of sequence signals in complex statistical frameworks, despite the relative simplicity of their approaches.53,59,60,63
Predicting prokaryote promoters
Prokaryotic genomes have a very high gene density and therefore promoters are typically much shorter than their eukaryotic counterparts, sometimes spanning less than a hundred base pairs. Because of this short intergenic region between coding regions, divergent promoters have been known to overlap. Many sequential genes are typically transcribed in a single run in so-called operons. On average, promoters are less stable, more rigid and have more extreme curvature than other genomic regions in most prokaryotes (Fig. 3, right hand panel).64,65 The role of the DNA curvature in prokaryotic promoters seems to vary greatly, as does the type of curvature pattern found in these promoters. 66 Mostly extreme DNA curvature has been associated with the presence of strong transcription factor binding motifs and it has been postulated to act as a thermosensor under some conditions.65,67,68 The low stability is likely to facilitate helix denaturation prior to the transcription event and is indeed centered around the TSS with the upstream region being less stable than the downstream region. 69 This fact is often exploited for the prediction of promoter regions. Indeed the first time it was observed, the absolute value and the difference in values of the DNA duplex stability immediately upstream of the TSS (<100 bp) were shown to be informative in a simple framework where a sequence was classified as a promoter if it exceeded a certain threshold for both measures.70,71 These measures for DNA duplex stability have been frequently used, eg, in the N4 promoter prediction algorithm where they are integrated in a neural network. 72 The PromPredict method also uses the difference between upstream and downstream DNA duplex stability but groups the sequences according to GC content prior to classification. 69 This is based on the fact that the difference in DNA duplex stability between the TSS and the region downstream varies according to the GC content of the genomic region containing the promoter. These findings have allowed promoter prediction across a wide range of prokaryotes. 73 Related is the SIDD method, which uses the stress-induced duplex destability profile for the classification of promoters with a linear discriminatory model. 74 The stress-induced duplex stability differs from the standard stability calculations because it accounts for torsional stresses present in the DNA molecule as a result of the genomic negative superhelicity. In this framework, the stress-induced stability was found to be more informative for promoter prediction than other stability profiles, the rigidity profile or the curvature profile.
Discussion
The idea of using DNA structural properties to model and describe genomic elements has been around for some time. Originally they were mostly limited to focused, small-scale studies. Only in the past decade have these types of studies moved into the realm of genome-wide applications. As more and more sequence data became publically available and the quality of annotated genomes steadily increased, so did the number of studies that tried to identify specific patterns of DNA structural properties for various types of genomic elements. In contrast, ‘raw’ nucleotide sequence information has been the standard representation of DNA in computational biology for much longer, and techniques such as consensus sequences and position weight matrices have become the default workhorses for the identification of many genomic elements. Highly advanced sequence-based methods have also been developed over the years and many have proven to be successful approaches for functional genomics applications such as those discussed in this review. Sequence-based methods can sometimes even capture part of the local DNA structure, as the DNA structural properties are generally dependent on interactions between neighboring base pairs. This is illustrated by the fact that they are often calculated from higher-order (mostly di- or tri-nucleotide) lookup scales. The advantage of using DNA structural properties is that they explicitly assign actual ‘measurement’ values (ie, the structural scales) to a given sequence of DNA. These values represent conformational and physicochemical characteristics, and can thus reveal structural patterns that would remain hidden when only relying on the corresponding categorical higher-order nucleotides. 75 Thus there is much to be gained by employing the DNA structure. Grouping different sequences with similar structural properties for example, will always be more difficult for sequence-based methods, as was shown for predicting prokaryotic TF binding sites. 35 Correctly identifying the contribution of the structural properties can also generate more powerful models, which has lead for instance to better predictions for nucleosome formation energy. 44 Nevertheless, a strong conservation of nucleotide sequence will always correspond to a strong conservation of the DNA structural signal. Even if complex structural mechanics play an essential functional role in such a case, calculated structural properties will not provide any complementary information. Only experimental assessment of the underlying mechanism can then quantify the relative contributions of the DNA structure.
The purpose of this review is not to provide an exhaustive list of structure-based methodologies. There are many other genomic elements for which common patterns of DNA structural properties have been described or even integrated into a classification framework. Examples that were not discussed in detail here include splice sites, replication start sites, transposon insertion sites, methylation events, functional SNPs, plasmid conjugation factor binding and gene prediction.20,76–84 Instead, the goal of this review is to provide a bridge between different application domains and to further promote the added value that these structural properties of DNA could have in functional genomics studies. Indeed, it is becoming more and more clear that DNA structural properties play an important role in a great many biomolecular processes and that their characterization for different genomic elements will be essential to generate a complete understanding. As we have presented here, different genomic elements require different representation methods to capture potential defining structural patterns. This does not imply that these methodologies cannot learn from one and other as there are functional and/or biomolecular relationships between many of these elements, the characterization of which might benefit from more comprehensive approaches. For example, the inherent flexibility of the DNA molecule is often found to be an informative feature in a large number of genetic elements.35,52,63,82,83,85,86 This can be problematic as different genomic elements sharing a number of structural similarities can result in false positive predictions during classification. Proper structural characterization can thus also be important to help understand such intricate relationships between different elements, as was shown to be the case for promoter regions and splice sites. 20 Regional relationship between various elements can also occur, eg, TF binding sites are commonly located in the promoter region of genes, and thus identification of TF binding sites could benefit from knowledge the promoter region and vice versa. In the end there is still much to be learned about what DNA structural properties play a role where and, perhaps more critically, how they can contribute to revealing the underlying biomolecular mechanisms.
Author Contributions
Conceived and designed the experiments: PM, KM KE. Analysed the data: PM, KM, KE. Wrote the first draft of the manuscript: PM, KM, KE. Contributed to the writing of the manuscript: PM, KM, KE. Agree with manuscript results and conclusions: PM, KM, KE. Jointly developed the structure and arguments for the paper: PM, KM, KE. Made critical revisions and approved final version: PM, KM, KE. All authors reviewed and approved of the final manuscript.
Funding
This work was supported by the KULeuven Research Council [GOA/08/011, CoE EF/05/007—SymBioSys, CREA/08/023, OT 05-33, OT09/022]; the agency for Innovation by Science and Technology [SBO-BioFrame, SB-81297]; Interuniversity Attraction Poles [P6/25—BioMaGNet]; Research Foundation—Flanders [IOK-B9725-G.0329.09]; and the Human Frontier Science Program [RGY0079/2007C].
Disclosures and Ethics
As a requirement of publication author(s) have provided to the publisher signed confirmation of compliance with legal and ethical obligations including but not limited to the following: authorship and contributorship, conflicts of interest, privacy and confidentiality and (where applicable) protection of human and animal research subjects. The authors have read and confirmed their agreement with the ICMJE authorship and conflict of interest criteria. The authors have also confirmed that this article is unique and not under consideration or published in any other publication, and that they have permission from rights holders to reproduce any copyrighted material. Any disclosures are made in this section. The external blind peer reviewers report no conflicts of interest.
Footnotes
Author(s) disclose no potential conflicts of interest.