
Abstract
p53 is an important regulator of cell cycle arrest, senescence, apoptosis and metabolism, and is frequently mutated in tumors. It functions as a tetramer, where each component dimer binds to a decameric DNA region known as a response element. We identify p53 binding site subtypes and examine the functional and evolutionary properties of these subtypes. We start with over 1700 known binding sites and, with no prior labeling, identify two sets of response elements by unsupervised clustering. When combined, they give rise to three types of p53 binding sites. We find that probabilistic and alignment-based assessments of cross-species conservation show no strong evidence of differential conservation between types of binding sites. In contrast, functional analysis of the genes most proximal to the binding sites provides strong bioinformatic evidence of functional differentiation between the three types of binding sites. Our results are consistent with recent structural data identifying two conformations of the L1 loop in the DNA binding domain, suggesting that they reflect biologically meaningful groups imposed by the p53 protein structure.
Keywords
Introduction
The p53 transcription factor is well known for its role in suppressing tumor formation. The wild-type form regulates transcription of genes implicated in cell cycle control, apoptosis, and senescence. 1 Common oncogenic p53 mutants either induce a loss of these tumor suppressor functions or acquire properties that promote cell proliferation, invasion, and metastasis.2,3 However, it is increasingly recognized that p53 has a plethora of functions mediated by a wide range of target genes, often with little or no connection to its classical roles in cell cycle control and cell death. 4 These functions include metabolic reprogramming, stem cell maintenance, autophagy, and response to oxidative stress.5,6 There are perhaps 300–3000 functional p53 binding sites in the human genome.7–9 p53 binds to these sites as a homotetrameric dimer of dimers, where each dimer interacts with a redundant, approximately palindromic, decameric DNA motif called the p53 response element (RE).10–14 The two REs that bind to a full tetramer are either directly adjacent or separated by a few base pairs.4,15,16
The best characterized p53 REs are typically found either near the promoters or in the first introns of target genes 17 and are approximately summarized by the 10-base pattern RRRCWWGYYY, 15 where “R” indicates A or G, “W” indicates A or T, and “Y” indicates C or T. In the ambiguous positions, not all residues are equally frequent; furthermore, other sequence variations exist. This flexibility suggests the hypothesis that different types of RE could mediate different biological processes, regulated by p53 with different binding specificities due to variable intrinsic sequence affinities,18–20 different posttranslational modifications, or by being in complex with different cofactors. Different biological functions might be expected to be subject to different strengths of natural selection, leading to varying rates of evolution of the associated REs. Indeed, it has been suggested that REs involved in apoptosis and DNA repair are more poorly conserved across species than those involved in the cell cycle. 21
Here, we computationally investigate the existence of subsets of p53 binding sites. One could divide p53 binding sites or REs into subsets based on criteria such as Gene Ontology (GO) annotation of the nearest gene 22 and summarize the properties of these subsets. However, GO – though an important guideline in broad studies of function – reflects a human-imposed classification of function, is incomplete, and, for intergenic binding sites, may involve an arbitrary decision as to which of the two nearest genes are regulated by the site. Instead of beginning with GO-based subsets, we begin with the DNA sequences of known binding sites. In an unsupervised clustering procedure, we classify these on the basis of the sequence similarity of their constituent decameric REs. This allows groups of binding sites to emerge based on their sequence, without imposing any limitations based on possible functional consequences. Our procedure also removes the arbitrary effect of the strand of DNA considered. Once formed on the basis of sequence similarity, we investigate the function of binding site groups, using both GO annotation and cross-species conservation, on the assumption that groups differing in one or both of these respects may have functional significance.
We use this procedure to group the decameric REs into two clusters, namely, “cluster 1” and “cluster 2” (labelled arbitrarily). Then, given that two REs form a full p53 binding site, three groups of full binding sites are possible: group “1,1” binding sites, consisting of two REs of cluster 1; group “2,2” binding sites, consisting of two REs of cluster 2; and group “1,2” binding sites, consisting of one RE of each type. We find evidence of functional differentiation between these binding site groups, but find no strong evidence of differential evolutionary conservation.
Materials and Methods
Input Data
We obtained 1757 p53 binding sites from the literature, as described by Lim et al. 23 These consist of 327 binding sites from the study by Wei et al. 1 and 1422 from the study by Smeenk et al. 7 , after excluding a further 123 also present in the study by Wei et al. and eight from the study by Horvath et al. 21 These 1757 binding sites are given in Supplementary material.
Clustering p53 REs
Within a binding site, we label the RE that is nearer to the start of the chromosome in the conventional representation as “first”; it is thus an arbitrary property of the strand of the chromosomal sequence being considered. Each binding site was then split into its two constituent REs, excluding any spacer. To ensure that comparable bases were aligned, the “second” RE was reverse complemented. All REs were then represented as strings of bases from the base outermost in the binding site (5’) on the left, to the innermost base (3’) on the right. Redundant sequences were removed, leaving 1724 unique p53 RE sequences (Supplementary material).
A symmetrical matrix of RE-to-RE Hamming distance was calculated. 24 Exploratory hierarchical clustering of this distance matrix with the unweighted pair-group method using arithmetic averages (UPGMA) 25 produced varying results when repeated, presumably due to the arbitrary resolution of ties during the clustering procedure.26,27 For the final clusters presented in this paper, we instead clustered using Ward's method, 28 which minimizes an objective function at each stage in the clustering procedure. In typical implementations, the objective function is within-cluster variance, requiring Euclidian distances as input. Before clustering, we transformed the RE-to-RE Hamming distance matrix to Euclidian distance using the “lingoes” function of the “ade4” package 29 in R (http://www.r-project.org). Clustering with Ward's method was then performed using the “hclust” function of R.
To divide the REs into subgroups, we drew a phenon line 30 on the cluster diagram at a position that split the REs into two sets (ie, k = 2 clustering). These two primary clusters of REs represent the most inclusive subsets supported by our analysis. We labeled these primary clusters of REs as cluster 1 and cluster 2.
The robustness of the grouping of REs into primary clusters was assessed using a jackknife procedure. A total of 1000 subsamples (jackknife replicates), each with a random set of 37% REs omitted, 31 were generated from the set of 1724 non-redundant p53 RE sequences. Hence, each replicate consists of a random subset of 1086 REs (63% of the set of non-redundant REs), sampled without replacement. Using the same procedure as for the analysis of the set of 1724 non-redundant REs, we clustered REs of each replicate at k = 2. We mapped each of the two clusters from each replicate to one of the primary clusters from the analysis of the full set of non-redundant REs. The replicate cluster with the highest proportion of overlap with cluster 1 of the primary clusters was mapped to primary cluster 1, and the other was mapped to primary cluster 2. As an indication of robustness of the clustering of the 1724 non-redundant REs, a G-test was used to investigate the correspondence between the assignment of REs to primary clusters in each jackknife replicate and the assignment to the primary clusters in the analysis of the full, non-redundant set of 1724 REs.
To investigate the evolutionary relationships of the primary clusters of RE, position weight-matrices (PWMs) for the RE clusters were compared to known PWMs for p53, p63, and p73 REs from the TRANSFAC database (BioBase Corporation; http://www.biobase-international.com/product/transcription-factor-binding-sites). If presented in TRANSFAC as counts, binding site PWMs were converted to a frequency representation. Then, frequencies for each base position within the RE were taken as the mean of the frequencies for the first RE and for the reverse complement of the second RE within the binding site. The resulting RE PWMs represent base frequencies starting from the outermost base of the binding site on the left (5’) to the innermost base (3’) on the right. PWMs were visualized as logos using WebLogo 32 with the non-redundant sequences as input in the case of cluster 1 and cluster 2, and a synthetic set of 5000 simulated sequences matching the composition of each base position in the RE PWM in the case of PWMs based on TRANSFAC. Similarities among the innermost nine bases of REs (the outermost base was excluded due to its absence in the p73 PWM, M04503) were quantified using profile-profile alignment scores calculated as the sum of dot-product scores for the individual base positions,33,34 without adjusting for background frequencies.
Functional and Evolutionary Analysis of p53 Binding Site Subtypes
Based on the primary cluster membership of the two constituent REs in the unjackknifed cluster analysis, we defined three groups of full p53 binding sites. Each binding site may be a “1,1” binding site, consisting of two REs from cluster 1; a “2,2” binding site, consisting of two REs from cluster 2; or a “1,2” binding site, consisting of one RE from each cluster. In the latter case, we make no distinction between binding sites in which the RE from cluster 1 comes “first” and those in which it comes “second”, since this distinction is arbitrary, depending only on which strand of the double helix is being considered.
To investigate differential pairing between RE clusters within binding sites, we performed a G-test for evidence of association between cluster 1 and cluster 2 REs within the full, redundant set of 1757 p53 binding sites.
To test for functional differences between the three groups of binding sites (1,1, 1,2, and 2,2), nearest genes were assigned to binding sites as described by Lim et al. 23 Enrichment analysis for GO biological process terms was performed with PANTHER 35 (http://www.pantherdb.org; version 11.0, released 2016–07–15). To test for overlap with hallmark gene sets, Ensembl Gene 85 IDs were converted to GRCh38.7 Entrez Gene IDs with Biomart then compared to the h.all. v5.1.entrez.gmt hallmark gene set in the Molecular Signatures Database 36 (MSigDB v5.1, January 2016 release; http://software.broadinstitute.org/gsea/msigdb/annotate.jsp).
Conservation levels for the three sets of binding sites were first investigated using PhastCons scores, 37 which quantify negative selection by using a hidden Markov model-based method to estimate the probability that each nucleotide in a multiple alignment forms part of a conserved sequence element. PhastCons conservation scores take into account the conservation of neighboring bases, which makes PhastCons scores a natural choice for detecting stretches of conserved sequence, such as p53 binding sites. We obtained PhastCons scores that represent levels of conservation (ranging 0–1, where higher values indicate higher conservation) across the following 10 primate species: Homo sapiens (genome assembly hg19), Pan troglodytes (panTro2), Gorilla gorilla (gorGor1), Pongo abelii (ponAbe2), Macaca mulatta (rheMac2), Papio hamadryas (papHam1), Callithrix jacchus (calJac1), Tarsius syrichta (tarSyr1), Microcebus murinus (micMur1), and Otolemur garnettii (otoGar1). The PhastCons scores for every p53 binding site (as the average across all constituent base pairs within the site) were extracted using the University of California, Santa Cruz (UCSC) table browser function (http://genome.ucsc.edu/cgi-bin/hgTables). For comparison, a background level of conservation was estimated from a precalculated, genome-wide PhastCons score set downloaded from UCSC (http://hgdownload.cse.ucsc.edu/goldenpath/hg19/phastCons46way/primates). Random segments of the human genome, for which PhastCons scores were available, were sampled 10,000 times with replacement. Lengths of these segments were sampled from an empirical distribution, estimated from the lengths of the known p53 binding sites. Conservation scores for the various binding site groups (1,1, 1,2, and 2,2) and the background levels were compared using Kruskal–Wallis (KW) tests, a nonparametric equivalent of analysis of variance.
Second, as an additional approach to test binding site conservation, alignments of genomic regions containing p53 binding sites were extracted using the Ensembl Perl API. 38 Genomic coordinates of p53 binding sites in the three groups were first converted to hg19 coordinates, and the evolutionary conservation of the binding sites was assessed by calculating average percentage identities in three types of alignments. The alignments used were as follows: first, the LastZ-net 39 pairwise alignment of H. sapiens (GRCh37) versus P. troglodytes (CHIMP2.1.4); second, the EPO40,41 multiple alignment of six primates (H. sapiens, G. gorilla, P. troglodytes, P. abelii, M. mulatta, and C. jacchus); and third, the EPO alignment of 15 eutherian mammals (H. sapiens, G. gorilla, P. troglodytes, P. abelii, M. mulatta, C. jacchus, Mus musculus, Rattus norvegicus, Oryctolagus cuniculus, Equus caballus, Felis catus, Canis familiaris, Sus scrofa, Bos taurus, and Ovis aries).
Methods are further discussed in the Supplementary material.
Results
Clusters of p53 REs and Binding Sites
Ward's method of clustering of non-redundant p53 REs based on Euclidian distance led to primary clusters of size 410 and 1314, which we designate as cluster 1 and cluster 2, respectively (Figs. 1 and 2).
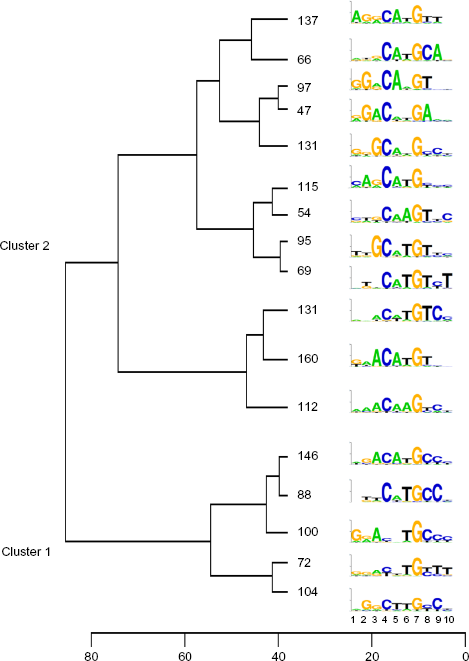
Summary of dendogram obtained by cluster analysis of the 1724 non-redundant decamers. For visualization purposes, an arbitrary phenon line was drawn at a height of 38. The number of sequences in each resulting subcluster is shown, along with the logo summarizing those sequences, with bases ranging from 1 (outermost) to 10 (innermost) in the binding site. The logo y-axis represents information content, with ticks at 1 and 2 bits. The full dendogram is available as a file in Newick format in the Supplementary material.
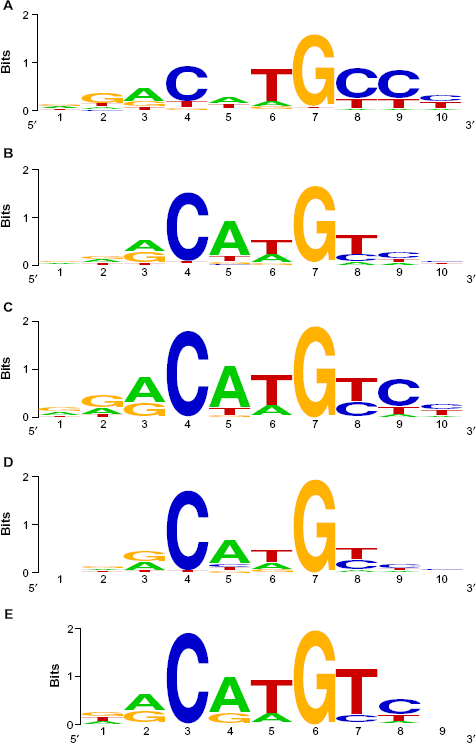
Sequence logos for (A) cluster 1 REs, (B) cluster 2 REs, (C) p53 TRANSFAC RE, (D) p63 TRANSFAC RE, and (E) p73 TRANSFAC RE. Bases range from 1 (outermost) to 9 or 10 (innermost) in the binding site. (C), (D), and (E) are based on TRANSFAC M01651, M07138, and M04503, respectively.
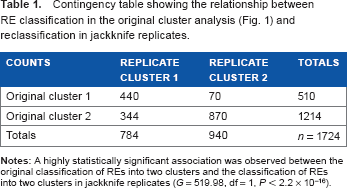
The spread of results among jackknife replicates is summarized in Table 1. Table 1 shows very strong evidence of association between the original classification of REs into two clusters and the classification of REs into two clusters in jackknife replicates. In the majority of jackknife replicates, REs are assigned to the same primary cluster as in the analysis of the unjackknifed set of 1724 non-redundant REs (Supplementary Fig. 1). Hence, the two primary clusters (Fig. 1) are based on a pervasive difference that is present throughout the dataset.
Contingency table showing the relationship between RE classification in the original cluster analysis (Fig. 1) and reclassification in jackknife replicates.
For the full set of 1757 binding sites, 140 were in group 1,1 (consisting of two REs from cluster 1), 687 were in group 1,2 (consisting of one RE from each cluster), and 930 were in group 2,2 (consisting of two REs from cluster 2). Given the relative sizes of cluster 1 and cluster 2, these counts are not statistically significantly different from expectations under a null hypothesis of independent assignment of RE clusters to binding sites (G = 0.689, degrees of freedom, df = 2, P = 0.709).
Comparison of RE Clusters with Existing PWMs
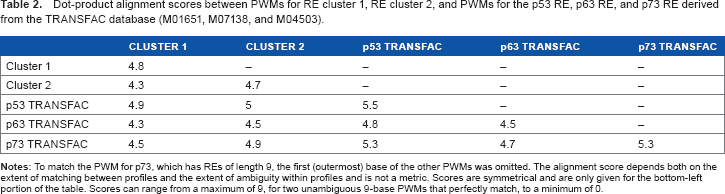
When compared to PWMs for REs from known p53, p63, and p73 binding sites derived from TRANSFAC, both of our RE clusters are most similar to the TRANSFAC p53 RE, then to the p73 RE, and least similar to the p63 RE (Table 2). Cluster 1 and the TRANSFAC-based PWM for the p53 RE show a stronger CCC homopolymer in the three bases innermost in the binding site than do cluster 2, the p63 RE or the P73 RE (Fig. 2).
Dot-product alignment scores between PWMs for RE cluster 1, RE cluster 2, and PWMs for the p53 RE, p63 RE, and p73 RE derived from the TRANSFAC database (M01651, M07138, and M04503).
Functional Analysis of Binding Site Groups
To identify potential differences in the function of genes near the different classes of binding sites, we measured the overlap with genes defining 50 hallmark biological processes in the MSigDB. 36 The hallmark most strongly associated with all three of our binding site groups was “genes involved in p53 pathways and networks”, confirming the validity of the approach (Supplementary Table 1). The results for the other hallmarks are shown in Figure 3, with numerical details in Supplementary Table 1. The main functional difference found between binding site groups is that group 2,2 is associated with a much broader set of functions. Group 1,1 is mainly associated with signal transduction pathways, particularly prosurvival and oncogenic pathways. Group 1,2 had an intermediate phenotype, functionally broader than group 1,1 but not as broad as group 2,2. GO enrichment analysis confirmed that group 2,2 is associated with a much broader set of functions than the other two groups (Supplementary Tables 2–4). Based on these analyses, we conclude that a switch between 1,1 and 2,2 modes of DNA binding would change the spectrum of biological functions activated by p53.

Functional enrichment for hallmark biological processes. The genes nearest to the binding sites were used to create putative target gene lists for each group.
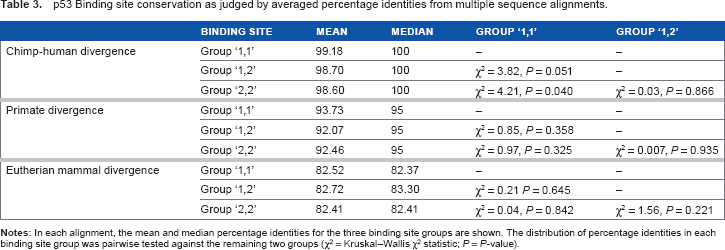
p53 Binding site conservation as judged by averaged percentage identities from multiple sequence alignments.
Conservation of Binding Site Groups
The conservation of binding sites in each group was first assessed using PhastCons scores that are base-by-base probabilities of a given nucleotide belonging to an evolutionarily conserved element. The distributions of PhastCons scores for the three classes of binding sites, as well as the conservation scores across the length-matched genomic background, are shown in Figure 4. There is no statistically significant difference between conservation scores across the three groups of binding sites (KW χ 2 = 2.49, df = 2, P = 0.288). Conservation of binding sites and flanking regions was also assessed (Supplementary Fig. 2). No statistically significant differences in evolutionary conservation were found when sequences flanking the binding sites were included by adding 50 base pairs on each side of a binding site (forming ∼110 bp regions, ie, 100 bp flanking regions; KW χ 2 = 0.052, df = 2, P = 0.974). Similarly, no statistically significant difference was found when longer, 1000 bp flanking regions were included (forming ∼1010 bp regions; KW χ 2 = 1.78, df = 2, P = 0.410). The difference between conservation scores for all p53 binding sites (mean = 0.176, median = 0.044) and background levels of genome conservation (mean = 0.127, median = 0.041) was also not statistically significant (KW χ 2 = 0.100, df = 2, P = 0.752). Similarly, no statistically significant differences were found when separately comparing the conservation of each binding site to the background level of conservation.
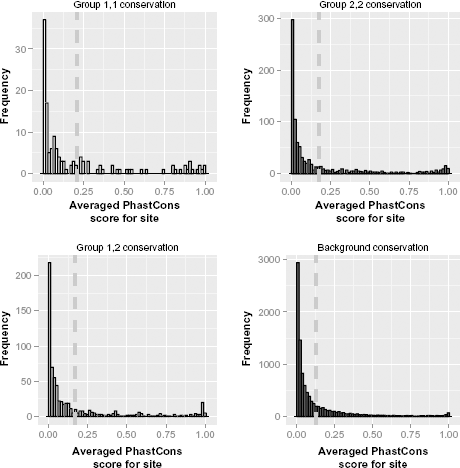
Histograms of PhastCons evolutionary conservation scores for binding sites in our p53 binding site group 1,1 (n = 140), group 1,2 (n = 687), group 2,2 (n = 930), and the genomic background (n = 10,000), across 10 species of primates. Dashed lines indicate means for each group.
The distribution of PhastCons conservation scores in both the p53 binding site and genomic background sequences appears slightly bimodal (Fig. 4). The second peak, representing the highest observed conservation levels, is more pronounced for binding sites than for the genomic background. We find that 102 binding sites have PhastCons conservation scores greater than or equal to 0.90, representing 5.9% of all binding sites, but only 195 (2.0%) of length-matched background genomic regions fall into this highly conserved category. This constitutes strong evidence that binding sites may have a larger subset of highly conserved sequences (G-test vs. genomic background as an extrinsic null hypothesis; G = 73.45, df = 1, P < 2.2 x 10⁻¹⁶). Further examining the highly conserved p53 subset, we find that group 1,1 sites may be slightly overrepresented. Group 1,1 represents 8.1% of all binding sites, but constitutes 9.8% of the highly conserved subset, though this difference is not statistically significant (G-test on 2 x 2 contingency table; G = 0.42, df = 1, P = 0.52). Applying a less stringent (but high) conservation score cutoff of 0.8, 141 binding sites (8.2%) are above the cutoff, compared to the genomic background level of 2.9% (G-test vs extrinsic null hypothesis; G = 92.34, df = 1, P < 2.2 x 10⁻¹⁶), and the proportion of the conserved subset included in group 1,1 rises to 12.1%, though this difference remains statistically nonsignificant (G-test on 2 x 2 contingency table; G = 2.93, df = 1, P = 0.087).
The finding of no strong evidence that p53 binding sites are more conserved than background genomic sequences is in accord with the observation that transcription factor binding sites show high evolutionary turnover, both in general 42 and particularly for p53. 21 There was no strong evidence of a difference in conservation between the functionally broader group 2,2 and the others (group 1,1 with group 1,2: mean = 0.177, median = 0.046; group 2,2: mean = 0.175, median = 0.041; KW χ 2 = 0.429, df = 1, P = 0.512).
As an alternative means to analyze binding site conservation, three sets of multiple alignments were examined to study p53 binding site sequence divergence over increasingly long spans of evolutionary time (chimp-human, primate, and eutherian mammal; Supplementary Fig. 3). Overwhelmingly, these alignments support the PhastCons-based conclusion of no differential conservation between binding site groups (Table 3). The sole conservation differences close to the conventional cutoff for statistical significance for a single test (P < 0.05) occur in the chimp-human comparison: group 1,1 binding sites are more highly conserved between humans and chimps than both group 1,2 (p = 0.051) and group 2,2 (p = 0.040; Table 3). This may be taken as weak evidence for the conservation of group 1,1 p53 binding sites between chimps and humans, or equivalently, the relative divergence of p53 binding sites related to noncanonical functions (ie, those containing cluster 2 REs). However, the statistical significance is borderline and may be misleading due to multiple testing. Higher conservation of group 1,1 binding sites was not observed in the primate alignments or in the mammal alignments (Table 3).
Discussion
We have shown that subtle differences in p53 binding site functionality can be identified by clustering the constituent decamers on the basis of sequence similarity. We obtained a robust grouping of decamers into two major clusters. These two clusters of decamers can give rise to three groups of binding sites, each composed of one of the three possible combinations of decamer. The frequencies of specific pairings of decamers from the two clusters into binding sites show no strong difference compared to random expectation, and we find no appreciable difference in conservation compared to background genome conservation levels. Furthermore, the three binding site groups also showed little evidence of differential conservation between themselves, with the strongest evidence hinting at relatively strong chimp-human conservation of group 1,1 binding sites, though with only borderline statistical significance. However, we find that genes near 2,2 sites have a much broader range of functions than genes near 1,1 and 1,2 sites (Fig. 3 and Supplementary Tables 1–4). Combined with the robustness of the RE clusters demonstrated by jackknifing, and with results from earlier studies (discussed below), we conclude that switching p53 from a 1,1 to a 2,2 mode of binding would substantially change the functional consequences of p53 activation.
Our results confirm a long-standing suspicion that p53 binding sites are not simply duplicated copies of a symmetrical RRRCWWGYYY decamer. Instead, the REs in cluster 1 are C-rich in the final three positions, which correspond to the innermost positions in the middle of a full 20 mer (or larger) binding site. Because of the way we report the decamer sequences, 1,1 binding sites will tend to have the sequence “CCCGGG” at the center of the 20 mer. This is the sequence that was found in the original SELEX study that first defined the p53 binding site. 43 Shortly thereafter, we showed that mutations in the L1 loop alter the affinity and specificity of DNA binding, 18 but an understanding of the mechanism had to wait until the Halazonetis group discovered that the L1 loop in Caenorhabditis elegans p53 contains a small alpha helix. 11 They went on to show that the L1 loop in human p53 can form the same alpha helix. 44 The lysine 120 DNA contact residue lies at the tip of the loop. Accordingly, formation of the alpha helix retracts the lysine from the DNA. The discovery that the L1 loop can adopt two different conformations immediately suggests an explanation for the asymmetry in the cluster 1 and cluster 2 sequences in our study. The L1 loop is in the retracted form in the outer p53 subunits in the tetramer.44–46 In this form, lysine 120 cannot reach into the major groove to contact the bases, so the sequence is less constrained. In contrast, the loop is in the extended form in the inner two subunits, allowing lysine 120 to form hydrogen bonds with the bases in the major groove. The hydrogen bonds between the side chains of lysine 120, cysteine 277, and arginine 280 and the DNA are shown as yellow dotted lines in Figure 5A. The L1 loop is shown in the extended form in Figure 5B, and in the retracted state in Figure 5C. Switching to the extended conformation allows induced fitting of the protein to the DNA when the correct sequence is present.44,45 It is likely that the L1 loop adopts many different conformations while searching for the correct sequence and that, thanks to induced fitting, this leads to important differences in the kinetics of binding that depend on the sequence.44,45 In addition to the inner-outer asymmetry caused by changes in the conformation of the L1 loop, there are differences between the hydrogen bonds formed, depending on the exact sequence at positions 8 and 9 in the decamer: cysteine 277 forms a hydrogen bond with either O4 of thymine or N4 of cytosine at position 8; lysine 120 forms hydrogen bonds with N7 and O6 of guanine but only N7 of adenine at position 9; and hydrophobic and van der Waals forces from alanine 276 and cysteine 277 stabilize the C5 methyl group in T at position 8.10,44,45 Taken together, these data would lead us to expect p53 to bind with decreasing affinity to 1,1, 1,2, and 2,2 sites. Hallmark analysis reveals a preference for prosurvival and oncogenic signaling pathways for 1,1 sites (Fig. 3). This is consistent with old suggestions that p53 promotes survival early after activation, and only binds to all of its targets if the signal persists and p53 accumulates. Originally this was interpreted as a binary switch between cell cycle arrest and apoptotic sites, with the latter containing only a single decamer18,20 and having a lower affinity for p53,19,20 but the multiplication of p53 functions over time means the effects are likely to be more diverse and to depend heavily on the cellular context. The most important DNA binding residue in p53 is arginine 280, which forms hydrogen bonds with the G base paired to the invariant C at position 4 in the pentamer. The corresponding positions in the decamer are 4 (C) and 7 (G). The pattern in cluster 1, with a stronger preference for G at position 7 than for C at position 4, is reminiscent of a binding site profile identified by Veprintsev and Fersht. 8 Interestingly, acetylation of lysine 12047,48 negated the difference. 49 In addition to acetylation of K120, the cell can manipulate the sequence specificity of p53 through multiple mechanisms, for example, binding to Hzf and ASPP proteins.50,51 Indeed, many publications have described plausible regulatory mechanisms based on posttranslational modifications and protein–protein interactions (reviewed by Carvajal and Manfredi 52 ) that could explain the differences we have found by clustering of p53 binding sites. Given the elegant structural studies from the Halazonetis group cited above, we suspect that these regulatory mechanisms converge on the L1 loop and switch p53 from a 1,1 to a 2,2 mode of binding.

p53 DNA binding. (A) The p53 loop-sheet-helix is shown in contact with the major groove of the DNA. Amino acid 120K (cyan) binds to G on the Watson strand; 277C (orange) binds to T and 280R (red) to G on the Crick strand. Amino acid 120K arises from the tip of the L1 loop (the green line at the bottom of the fig.). Hydrogen bonds are shown as dotted yellow lines. (B) The L1 loop is in the extended form, as in panel (A). (C) The L1 loop is in the retracted form. The figures were made with PyMOL (Schrödinger, LLC) from PDB structure 3Q05; for a detailed description of the p53 DNA–protein interaction, see Refs. 44–46.
Conclusion
We have shown that p53 binding sites can be classified into groups that may reflect the different modes of DNA binding that have been described in structural studies. Integration of sequence-based clustering with data on posttranslational modification, cofactor binding, and changes in the structure of the DNA binding domain is a promising direction for future research.
Author Contributions
Conceived and designed the analyses: J-HL, NSL, RDI, DB. Performed the analyses: J-HL, NSL, RDI, DB. Wrote the manuscript: J-HL, NSL, RDI, DB. Agreed with manuscript results and conclusions: J-HL, NSL, RDI, DB. All the authors read and approved the final manuscript.