
Abstract
Over the past years, microarray databases have increased rapidly in size. While they offer a wealth of data, it remains challenging to integrate data arising from different studies. Here we propose an unsupervised approach of a large-scale meta-analysis on
Introduction
In the last years, enormous data has been generated with microarray experiments from different organisms, tissues and platforms under various experimental conditions. Databases like the NCBI Gene Expression Omnibus (GEO) (Barrett et al. 2007), ArrayExpress (Parkinson et al. 2007) and NASCArrays (Craigon et al. 2004) have been set up to archive these datasets and to make them available to the scientific community. The size of microarray databases is likely to increase exponentially in the future, as is typical for all molecular databases, increasing the need for sophisticated methods to analyze these large amounts of data appropriately.
Several factors impede a straight-forward analysis of microarray database content: standards for data submission vary between different databases, some microarray datasets do not provide raw data and on the experimental side, protocols and experimental conditions can differ between diverse laboratories conducting microarray hybridizations. However, a major advantage of microarray meta-analysis is that through the integration of a potentially large number of datasets, additional insights into gene regulation can be gained which could have been overseen or not detected in the single experiments. Reasons for this could be that either the signal from a particular gene or group of genes was too weak to be detected in the single experiment or because it can be put into a functional context taking into consideration its regulation under other conditions or treatments.
Several methods for microarray meta-analysis been proposed in recent years, most of them using models which compute an “effect size” and take care of inter-study variation (Choi et al. 2003; Conlon et al. 2006; Hu et al. 2005; Moreau et al. 2003). Thus, they often resemble procedures applied for the detection of differential expression but add the study as an extra explanatory variable. Several datasets from different microarray experiments are integrated in the meta-analysis to increase the number of replicates and thereby the power to detect differentially expressed genes. Because this design implies that datasets addressing the same topic such as the same cell type or treatment are used, microarray meta-analyses of this kind usually consist of only a small number of studies.
A second approach to supervised microarray meta-analysis is to integrate knowledge of biological functions into the analysis to predict global co-expression relationships and to infer functional relationships between co-regulated genes (Huttenhower et al. 2006).
Nevertheless, all the above methods are based on parametric models which have several biological and statistical assumptions. Similar to classical microarray analysis, in which a first explorative analysis reveals possible signals in the data which can then be verified or disproved by parametrical hypothesis testing, our approach of unsupervised meta-analysis yields insights into the biological structure of the data and may thus lead to precise biological hypotheses. These could then be tested by the parametric models described above. The aim of this study is to compare the results from a large number of microarray experiments on
http://www.affymetrix.com/products/arrays/specific/arab.affx
In this unsupervised meta-analysis, we show how to overcome the challenges posed by the heterogeneity of microarray data and apply exploratory data analysis methods. First, microarray datasets from public web sources were collected and pre-processed to remove noise from the data and build a common data basis for further analyses. Later, exploratory data analysis was applied to the processed datasets, namely kernel Principal Component Analysis (kPCA) and spectral and hierarchical clustering, to group contrasts from different microarray experiments and to find genes regulated in a specific cluster. Identification of regulated genes in a specific cluster was achieved by unsupervised feature subset selection using the kernel principal component loadings. Although gene selection or feature subset selection is a challenging task for classification, many different approaches have been proposed for the same. According to our knowledge, gene selection or feature subset selection has not yet been performed using loadings of features on kernel PCA scores in the context of meta-analysis.
Genes selected to play a role in either plant growth and development (related to indole-3-acetic acid, a plant growth hormone) or pathogen defense were mapped onto physiological processes and functions and could be validated by previous studies. For genes which have not completely been characterized yet, our approach was able to propose a function and a possible regulatory mechanism as shown here for DUF26 (Domain of Unknown Function) kinase genes.
Methods
Data pre-processing
Microarray data were collected from the Gene Expression Omnibus (GEO) database (Barrett et al. 2007). For our analysis, we defined a

Variance of kernel principal components.
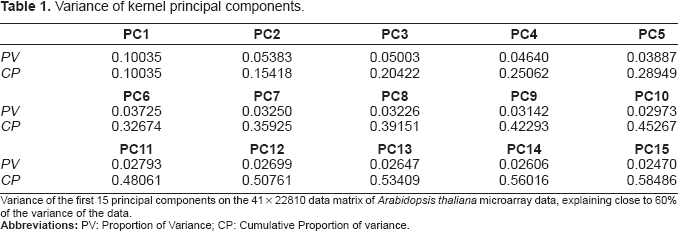
Variance of the first 15 principal components on the 41 × 22810 data matrix of
A contrast was then represented by a vector of the logarithmic (base 2) fold changes of all 22810 probe sets on the ATH1 chip. The majority of probe sets on the ATH1 chip interrogates the expression level of one gene, some match to two or more genes. Before computing the fold changes, raw intensity values of all samples of a contrast were normalized using the gcRMA algorithm implemented in the
We imposed the following selection criteria on the datasets: a) Availability of the Affymetrix raw data (CEL-files) for download, b) at least two replicates of each condition are available c) time-course experiments were excluded. 20 GEO datasets fulfilled these criteria as of November 2006. From these datasets, 76 contrasts could be set up on the basis of 424 CEL-files. The final data matrix used for the unsupervised meta-analysis was a 76 × 22810 matrix, 76 contrasts with 22810 log fold changes.
Outlier removal and transformation
To remove experimental outliers from the data which could negatively influence any further analysis, a filtering criterion was set up as follows. Across all experiments, 15% and 85% quantiles of the distributions of medians and variances of the log fold changes were calculated. Experiments whose medians laid outside the inter-quantile-range or whose variances were below the 15% quantile threshold were excluded from further analysis. This resulted in a reduced data matrix
When dealing with heterogenous experimental datasets from different laboratories and experimental settings, efficient data transformation methods are necessary to produce a reasonable level of comparability. Log fold changes from microarray experiments deserve special attention in that they implicitly define a “direction” of differential expression by their algebraic sign which is semantically not sustainable when comparing contrasts from divergent settings. We therefore only evaluated the absolute value of the log fold changes and brought all remaining 41 contrasts approximately to a standard normal distribution by applying the
For a power coefficient
The average
Kernel PCA
Principal Component Analysis (PCA) aims to provide a lower dimensional view of high dimensional data by projecting the data points from a data matrix
Kernel PCA (kPCA) (Schölkopf et al. 1998) is a non-linear extension of the regular PCA, performing the same projection in a possibly even higher dimensional feature space. The data points are implicitly projected from the input space
More precisely, for a row-indexed data matrix


kPCA has the advantage of being able to detect non-linear patterns in the data which might be overlooked or not covered appropriately when using conventional PCA.
For our analysis we used the kPCA algorithm implemented in the “kernlab” package (Karatzoglou et al. 2004), for the kernel function κ we chose a polynomial kernel

of degree
Clustering
Clustering was performed on all remaining contrasts after removal of outliers. For an initial identification of the three main clusters of contrasts, we applied a spectral clustering algorithm from the “kernlab” package (Karatzoglou et al. 2004). Spectral clustering algorithms cluster points using eigenvectors of matrices derived from the data, the kernel matrix
To gain structured clustering results, we applied hierarchical clustering using Ward's minimum variance method, which aims to find compact and spherical clusters based on Euclidean distance (Ward 1963). Decomposition of the symmetric kernel matrix

leads to a product of the orthogonal matrix

The result is a Euclidean distance
weighted by the information content of each of the vector coefficients, thus scaling down axes that were given a low information content in the previous kPCA analysis.
Uncertainty of the predicted clusters was estimated by a 1000-fold multi-scale boot-strap resampling using the “pvclust” algorithm (Suzuki and Shimodaira 2006).
Results
Dimension reduction by kernel principal component analysis (kPCA)
The ATH-1 whole genome chip consists of 22810 probe sets, this led to a 41 × 22810 data matrix (contrasts × log fold changes of probe sets) after outlier removal. To reduce the dimension of the data matrix, a kPCA algorithm was applied which was able to cover virtually the complete information content by defining an orthonormal system of 38 principal component axes. The 22810 log fold changes could therefore be represented by a 41 × 38 data matrix without any measurable loss of information. Using only the first 25 principal components, 80.585% of the variance could be described. If we state that the remaining 20% of the variance in the data describe noise, an estimation which is certainly not too strict in the context of large-scale gene expression measurements, an effective de-noising can be reached by considering only the first 25 principal components in further steps of the analysis. For a detailed overview of the variance distribution on the first 15 principal components, see Table 2.
Overview of all contrasts included in the explorative meta-analysis.

Each contrast consists of two groups which are described by their genetic background and treatment. The last column cluster derives from the clustering on the kernel PCA scores. Contrasts are labeled with the GEO series number followed by a contrast index.
Unsupervised analysis reveals three clear clusters of contrasts
The principal component plot (Fig. 2) revealed three major clusters of contrasts and several minor ones. In contrast to typical meta-analyses these clusters were not a priori defined, but detected by the proposed unsupervised meta-analysis. Based on this clustering we used an implementation (Karatzoglou et al. 2004) of the spectral clustering algorithm proposed by Ng et al. (2001), a variant of the k-means clustering algorithm in a kernel defined feature space, to support the clusters shown in Figure 2. According to the annotation of the datasets retrieved from GEO, the three clusters were related to indole-3-acetic acid (IAA) addition or inhibition (cluster 1, triangles), pathogen defense activation (cluster 2, solid circles) and “others” (cluster 3, outlined circles). For a detailed biological interpretation, see section “Biological interpretation of clusters”. Additionally, inspection of the pairwise plots of the other principal components contributing to a lower extent to the variance of the data revealed more contrast clusters.

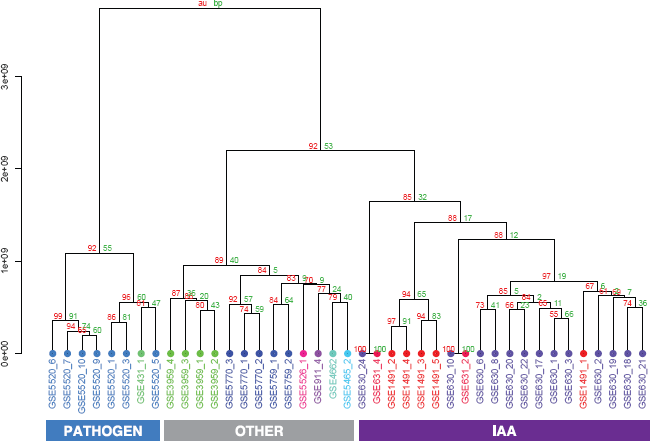
To get further structural insights into the relationships between contrasts and the experimental settings, we performed hierarchical clustering assessed by multi-scale boot-strapping (Fig. 3). In agreement with the spectral clustering performed earlier and the graphical inspection of the pairwise scatterplots of contrasts on the kPCA axes, the three main clusters of contrasts could also be found as the first two splits in the resulting dendrogram with high bootstrap support.
As the three clusters were mainly separable through the x-axis on the kPCA scatter-plot using the first two axes (Fig. 2), we postulated that the first principal component alone might be enough to select genes whose co-regulation patterns could clearly distinguish between IAA related, pathogen-defense related and other contrasts.
Gene selection with kPCA loadings
To accomplish an efficient feature subset selection, i.e. to identify genes that are responsible for the clustering, a variety of methods have been described, e.g. Self-Organizing Maps (SOMs) (Tamayo et al. 1999), Maximal Margin Linear Programming (MAMA) (Antonov et al. 2004), Correlation Based Feature Selection (CFS) (Hall 1999) or Recursive Feature Elimination (RFE) using Support Vector Machines (SVM) (Guyon et al. 2002; Zhang et al. 2006). In consequent continuation of our approach of exploratory meta-analysis, we looked for genes that have a strong association with the first kPCA axis, i.e. we calculated the loadings of each of the genes onto the principal components. To achieve this with respect to the kernel defined feature space we projected single artificial contrasts containing only one de-regulated gene onto the new coordinate system. Each of the 22810 artificial contrasts was set up in a way that it showed a high absolute fold change value in one of the genes and all others being set to zero. From the resulting 22810 × 38 matrix of loadings of each of the genes onto the 38 principal components, we selected the 500 top genes for both positive (IAA related) and negative (pathogen related) extrema. To assess the accuracy of the gene selection process exploratively, we repeated the previous kPCA analysis using only the selected genes, i.e. on the remaining 41 × 500 data matrices, and inspected pairwise scatterplots of the first 20 principal components for each dataset of either IAA-related or pathogen-associated genes. All kPCA plots of the IAA-related gene set, even the one of the first two axes which contribute most to the overall variance of the data, showed a wide spread of IAA contrasts along the principal component axes. This indicated a high variance of the selected genes in IAA-related contrasts. All other contrasts were projected onto a compact local cluster by kPCA, demonstrating that the selected genes do not vary in these contrasts. The same was found in the kPCA plots of the matrix with pathogen-associated genes (data not shown). These findings indicate that expression patterns related neither to IAA nor pathogen treatment were efficiently stripped off by the gene selection process.
Biological interpretation of clusters
The hierarchical clustering on all kPCA scores in Figure 3 revealed three main clusters of contrasts: contrasts studying pathogen defense (blue), contrasts analyzing indole-3-acetic acid (IAA) effects (violet) and other contrasts studying various effects (gray). These three clusters were well-supported by high bootstrap values. The labels at the edges include the GEO accession number followed by an index indicating the contrast number. For a detailed description of contrasts see Table 1. For each contrast, two groups of samples were compared and for each group, the genetic background and treatment is listed. The last column of Table 1 indicates the cluster this contrast was assigned to in kPCA clustering.
Zooming into the IAA cluster, a cluster containing only contrasts with IAA inhibition (GSE1491_2, GSE1491_3, GSE1491_4 and GSE1491_5) was well-separated from the remaining contrasts, including GSE1491_1, a contrast from the same dataset, but where IAA instead of an IAA inhibitor was added to one sample group. The remaining contrasts in the IAA cluster mainly studied the effect of IAA on different mutants with defects in IAA biosynthesis or signaling. Indole-3-acetic acid (IAA) belongs to a group of plant growth hormones called auxins. The “others” – cluster consisted of contrasts studying various effects like the effect of lincomycin which is an inhibitor of plastid protein translation, regulation changes of an embryogenesis transcription factor mutant or of stress tolerant mutants. Naturally, in this cluster of divergent contrasts, contrasts from the same dataset clustered closely together. The architecture of the hierarchical cluster tree shows that data preprocessing followed by kPCA adjusted the data in such a way that contrasts stemming from biologically similar experiments are indeed more similar to each other than to other contrasts. Thus, with our analysis, we were able to achieve comparability of microarray datasets from different laboratories addressing different biological questions. This is nontrivial and important considering the numerous sources of variation that affect the nature of the datasets underlying this analysis.
Arabidopsis thaliana genes regulated by indole-3-acetic acid (IAA)
To get an overview of the functions of the selected genes representative for the contrast clusters “IAA” or “pathogen”, the
Among the genes representative for IAA contrasts, the functional category “hormones” with the subgroup “IAA” defined by MapMan showed the highest proportion of regulated genes (diagram not shown). The subgroup “IAA” consists of 215 genes in MapMan. We selected 500 genes representative for IAA with our approach and out of these, 43 genes are cataloged in the MapMan subgroup “IAA”. Thus, by selecting 500 genes from the ATH1 microarray which comprises roughly 2% of the array, we were able to capture 20% of the genes annotated as IAA-related in MapMan.
In the “hormones” subgroup “ethylene”, and in the category “transcription factor” many genes are regulated under IAA treatment, while a smaller number of genes is regulated in the categories “Cytochrome P450” and “cell wall” (data not shown).
Regulated genes in the subgroup “ethylene” are either involved in ethylene synthesis or signal transduction. Ethylene plays a role in the regulation of a number of developmental processes, often in interaction with other plant hormone signals. For example, auxins can induce ethylene formation and in turn ethylene can trigger an auxin increase. Some processes such as root elongation, differential growth in the hypocotyl and root hair formation and elongation are regulated by both auxin and ethylene in
Cytochrome P450 monooxygenases are involved in various biosynthetic reactions which synthesize for example plant hormones or defense compounds. Regulation of cell wall genes is also expected as auxins mediate cell elongation by stretching of the cell wall which requires restructuring processes.
In conclusion, the gene selection of our unsupervised meta-analysis approach chose many genes which are annotated and independently validated as being IAA regulated.
Arabidopsis thaliana genes regulated by pathogen exposure
Gene selection for contrasts studying plant response to pathogens revealed a high number of regulated genes in the following functional categories of MapMan (Usadel et al. 2005): “biotic stress”, “receptor kinases”, “photosynthesis” (light reactions), “alkaloid-like proteins” from “secondary metabolism”, “nitrilases”, “cell wall” genes and “WRKY transcription factors”. For all of the functional categories mentioned above, it has been reported that genes in these categories are regulated after pathogen attack and play a role in plant defense. Figures 4 and 5 show details of the MapMan maps which harbor these categories. In the figures, gray areas inside the diagrams represent all the individual genes present on the ATH1 chip and annotated in MapMan. The selected genes representative for contrasts studying the effects of pathogen exposure are highlighted by small dark blue squares. For example, Figure 4C shows that there are 41 DUF26 receptor kinases present on the ATH1 chip, of which 9 are regulated after pathogen exposure. In the following, we give a short description of the functions of the genes regulated after pathogen exposure.


A change in carbohydrate metabolism after pathogen attack as observed here (Fig. 4A, upper right: “light reactions”) has also been reported by Berger et al. (2004) for the pathogens
As the cell wall is a natural barrier for plant pathogens, plant defense includes cell wall modifications and biosynthesis to thicken cell walls and impede further pathogen attack (Cheong et al. 2002). Figure 4A shows that several genes of the cell wall metabolism are regulated after pathogen exposure.
The regulation of WRKY transcription factors (Fig. 4B, upper left) is also described in the publication accompanying the GEO dataset GSE5520 (Thilmony et al. 2006). Our findings confirm their suggestion that these transcription factors regulate plant response to bacteria.
Alkaloids (Fig. 4A, lower left) are secondary metabolites listed in the “N-misc.” category of MapMan. They are generally not essential for the basic metabolic processes of the plant but play an important role in plant defense (Dixon 2001). They are produced by the plant to restrict pathogen feeding. The accumulation of antimicrobial substances is often regulated by signal-transduction pathways which require the perception of the pathogen by a plant receptor encoded by host resistance genes (Dangl and Jones 2001; Piroux et al. 2007). Thus, the regulation of DUF26 containing genes postulated by our analysis of the
The functional category “biotic stress” (Fig. 5A) comprises a number of different genes which are annotated to be pathogen related.
Nitrilases (Fig. 5B, upper right) are involved in IAA biosynthesis and catalyze the conversion of indole-3-acetonitrile to IAA. The induction of four
Thus, gene selection by unsupervised meta-analysis was able to pinpoint biologically important genes of which many are experimentally validated to be regulated by pathogen attack. Clearly, one could postulate that the remaining genes of unknown function are also associated with responses to pathogen attack.
Serine-threonine kinases involved in plant response to pathogens
As presented in Figure 4C, the extracted set of genes deregulated in response to pathogens includes a number of receptor kinases. Many kinases belong to the group of serine/threonine kinases of the DUF26 subfamily. They all share the same domain composition and order consisting of a signal peptide, an extracellular region containing two domains of unknown function (DUF26, PF01657) and a cytosolic serine/threonine kinase domain (pkinase, PF00069). According to the SMART database (Letunic et al. 2006), proteins of this family are exclusively found in Streptophyta. The 9 putative receptor kinases exhibit high similarity in domain composition and nucleotide sequence with the receptor-like kinase 4 of
Two of the DUF26 kinase genes (At4g21400, At4g21410) were also regulated in the contrasts from dataset GSE3959 and in one contrast from the dataset GSE5770. In the former dataset, the function of B3 domain protein LEAFY COTYLEDON2 (LEC2) was studied. This transcription factor is required for several aspects of embryogenesis including the maturation phase. In the latter contrast,
As can be seen from Figure 6, the DUF26 kinase genes were not regulated in all of the contrasts involving pathogen exposure. This could be due to several reasons. For example either the variance in the single microarray intensities was so high that differential expression could not be detected in the contrast or the difference in expression levels (i.e. the logarithmic fold change) was too low to be significant because of biological reasons. Again, this finding might be an interesting starting point to analyze the function and regulation of the DUF26 kinase genes.

Discussion
Public microarray data repositories accumulate large amounts of data which have so far rarely been used for large-scale analyses. Using this wealth of information, additional implications for the function and regulation of genes can be made which could not be derived from single microarray datasets. This stresses the importance of meta-analyses and their benefit over classical microarray experiments.
In this study, we apply a novel approach of an unsupervised meta-analysis on a large number of gene expression microarrays. Before conducting the analysis, we performed a pre-processing which included a conservative outlier removal. kPCA followed by hierarchical clustering, revealed robust and significant clusters of contrasts which reflect similar experimental conditions. Thus we were able to detect biologically important known and unknown factors (e.g. IAA-or pathogen-associated) through an unsupervised analysis.
To find genes specifically regulated in these clusters, a novel approach of gene selection was conceived. Gene selection was performed using loadings of features on kPCA scores, which has to our knowledge not been performed in the context of meta-analysis before. Gene selection based on loadings of features on kPCA scores circumvents a major drawback of most proposed methods of feature selection: They tend to find linear combinations of features, i.e. genes, that separate the given experimental classes best (e.g. different cancer types, etc.). This is challenging as the search space for all possible linear combinations is too large to be searched exhaustively and sophisticated heuristics and optimization methods have to be chosen which likely yield differing results, see e.g. Zhang et al. (2006). An unsupervised analysis as proposed here circumvents this problem efficiently by working directly on the loadings from the kPCA analysis. Eigen-decomposition of the kernel matrix is deterministic and so are the results from our gene selection process, provided the projection is capable of clustering the contrasts appropriately. The genes selected by our feature extraction were found to be representative of a group of contrasts and could in part be experimentally validated. Furthermore, adding random noise to the data did not change the set of selected genes, proving the robustness of the proposed gene selection method.
It is the gene-selection in the first place that benefits most from an analysis across several datasets. Weak regulation signals can easily be overlooked in a single dataset, i.e. the genes will likely receive an insignificant p-value due to their low fold changes compared to a relatively high variance. The situation becomes even worse after a correction for multiple testing has raised the overall p-value level, efficiently removing those subtle signals. In a meta-analysis approach which integrates many datasets, even a small signal that is consistent across several contrasts can be detected. To ensure this surplus and to prevent early losses of information, we used fold changes and not p-values for our analysis. We performed the unsupervised meta-analysis on absolute fold changes to reduce variation introduced by different experimental settings. For example, when there are contrasts in the dataset which compare a surplus of a factor with a control and other contrasts comparing a lack of a factor with another control, we might expect fold changes with opposite signs but still want the contrasts to cluster closely together because the same factor was studied in both. In some cases the direction of the experimental setup was not even apparent from the description of the dataset.
To ensure that results of similar quality could not be obtained by a simpler model and thus to prevent overfitting of the data we compared the results to the ones obtained from traditional linear PCA. Even though linear PCA was also able to detect some of the major clusters in principle, its accuracy as assessed by hierarchical clustering as well as by the gene selection process fell far short of the results from the kernelized version. Additionally, it should be noted that kPCA outperforms the traditional approach significantly, considering that the dimension of the kernel matrix as a matrix of pairwise scalar products between the data points is independent of the dimension of the data, which is 22810 (the number of probe sets) in the case of the ATH-1 arrays.
For a large
In general, unsupervised meta-analysis embracing several highly divergent experimental settings can suggest novel gene functions by revealing the regulation of a gene under different conditions. It is noteworthy that these analyses are not restricted to datasets addressing the same topic, but that they profit from the divergence of the experimental settings.
However, it has to be mentioned that an unsupervised meta-analysis is suggestive rather than definitive. But since it is common in classical statistics to precede a supervised, parametric analysis with an explorative approach to check the integrity and quality of the data, we recommend the same here for microarray meta-analyses. Hypotheses from unsupervised analyses can then be tested with supervised methods and biological experiments.
We have shown here that it is feasible to integrate various datasets spanning a large range of experimental questions and originating from various laboratories into a coherent unsupervised analysis. This analysis can be applied to find genes representative of a cluster of related contrasts. Based on expression changes between clusters, the function and regulation of genes can be predicted. Our study is based on the Affymetrix ATH1 Genome Array platform here, but our approach can be transferred to any platform, organisms and experimental design which allows one to compute a logarithmic fold change, e.g. human or mouse microarray datasets. To achieve easy access to our unsupervised meta-analysis results, we intend to set up a database web server where new datasets can easily be added and compared to our curated database of
Availability
R code is available on request from the authors.
Footnotes
Acknowledgments
We gratefully acknowledge the funding from the Impuls- and Vernetzungsfonds Helmholtz-Gemeinschaft deutscher Forschungszentren e.V. (VH-VI-023), BMBF Projekt FUNCRYPTA (FKZ 0313838B), DFG (SPP 1150/Da208/7-1/TR 34-TPA5) and Land Bayern (Foringen TP D1, IZKF B-36). We would like to thank Dr. Alan Horowitz (Dep. of Bioinformatics, Univ. of Würzburg) and Dr. Biju Joseph (Dep. of Hygiene and Microbiology, University of Würzburg) for proof-reading the manuscript.