
Abstract
Cisplatin is a DNA-damaging anti-cancer agent that is widely used to treat a range of tumour types. Despite its clinical success, cisplatin treatment is still associated with a number of dose-limiting toxic side effects. The purpose of this study was to clarify the molecular events that are important in the anti-tumour activity of cisplatin, using gene expression profiling techniques. Currently, our incomplete understanding of this drug's mechanism of action hinders the development of more efficient and less harmful cisplatin-based chemotherapeutics. In this study the effect of cisplatin on gene expression in human foreskin fibroblasts has been investigated using human 19K oligonucleotide microarrays. In addition its clinically inactive isomer, transplatin, was also tested. Dual-fluor microarray experiments comparing treated and untreated cells were performed in quadruplicate. Cisplatin treatment was shown to significantly up- or down-regulate a consistent subset of genes. Many of these genes responded similarly to treatment with transplatin, the therapeutically inactive isomer of cisplatin. However, a smaller proportion of these transcripts underwent differential expression changes in response to the two isomers. Some of these genes may constitute part of the DNA damage response induced by cisplatin that is critical for its anti-tumour activity. Ultimately, the identification of gene expression responses unique to clinically active compounds, like cisplatin, could thus greatly benefit the design and development of improved chemotherapeutics.
Introduction
The DNA-damaging agent,
A major factor contributing to the current status of rationally designed analogues is a relatively poor understanding of the specific molecular events associated with cisplatin-induced tumour cell death. Although its detailed mechanism of action is presently unclear, it is generally thought that the covalent binding of cisplatin to cellular DNA and subsequent formation of bulky DNA adducts, mediate the cytotoxicity of this anti-cancer agent (Rosenberg, 1985; Wang and Lippard, 2005). Intra-strand DNA cross-links are the most common adducts formed, although inter-strand DNA cross-links and DNA-protein cross-links can also occur (Fichtinger-Schepman et al. 1985; Lippard and Hoeschele, 1979). The intra-strand DNA lesions preferentially form between the N-7 of adjacent guanine residues, inhibiting the passage of polymerases and thus interfering with DNA replication and RNA transcription inside target cells (Corda et al. 1992; Murray et al. 1992; Murray et al. 1998; Roberts and Thomson, 1979). While the general inhibition of RNA synthesis reduces the mRNA levels of many genes, an active cellular response to cisplatin damage can influence gene expression both positively and negatively and to varying extents, depending on the promoter (Evans and Gralla, 1992).
The active response to such drug-induced DNA damage consists of two key processes. These include the repair of DNA damage through the removal of cisplatin adducts and, where repair cannot be carried out successfully, the induction of cell death via apoptosis. While DNA repair and apoptotic pathways are considered to play the most significant role in determining cisplatin's cytotoxic effect, various non-specific events associated with the drug-DNA interaction should also be taken into account. These non-specific events arise as consequences of cisplatin-DNA adduct formation and the overall inhibition of DNA and RNA synthesis. In addition, altered gene expression could also result from cisplatin-protein interactions (Perez, 1998) and the sequestration of transcription factors by cisplatin-DNA adducts. At present, little is known about the extent to which each of these active and non-specific responses contribute to cisplatin-induced cell death. This issue is addressed in the main aim of this work, which is to determine whether the regulation of specific genes in response to cisplatin treatment is crucial to the drug's anti-tumour activity.
Oligonucleotide microarrays containing approximately nineteen thousand human genes were used to examine the broad effect of cisplatin on gene expression in human foreskin fibroblasts. The response of such a non-cancer cell line to DNA damage was considered to be particularly significant since most toxic side effects are due to the exposure of normal cells to the anti-tumour drug during chemotherapy. The gene expression profiles derived from these cells indicated that many genes consistently exhibited altered gene expression patterns due to cisplatin treatment. Rigorous methods for analysing the resulting microarray data were developed. Thorough normalisation techniques and a statistically robust procedure for estimating the significance of gene expression changes were implemented via the statistical computing environment, “R”. Using the software package, EASE, a method for exploring the biological themes among differentially expressed transcripts was also investigated. An attempt to clarify whether any of these molecular events are crucial to cisplatin's anti-tumour activity was made by constructing similar expression profiles for the clinically inactive cisplatin isomer, transplatin (Fig. 1). Both compounds were found to consistently induce a common subset of gene responses in fibroblasts. However, thorough one- and two-sample statistical comparisons also indicated that several genes had significantly different expression levels in cisplatin-treated cells compared to transplatin-treated cells. The identification of gene expression responses unique to clinically active compounds, such as cisplatin, could have a range of implications on the design and development of improved chemotherapeutics.
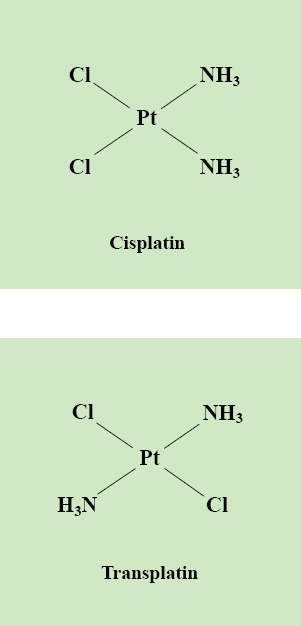
The chemical structures of cisplatin and transplatin. The main focus of this study is the mechanism of action of the DNA-damaging anti-cancer drug, cisplatin. Although structurally similar, cisplatin's isomer, transplatin, lacks the anti-tumour activity exhibited by
Materials and Methods
Materials
Cisplatin, transplatin and Tri-Reagent were purchased from Sigma. Cell culture reagents and Superscript (II) Reverse Transcriptase were obtained from Invitrogen. Alamar Blue reagent was purchased through Astral Scientific. RNeasy columns were obtained from Qiagen. Cy3 and Cy5 mono-reactive fluorescent dyes were purchased from Amersham Biosciences. Human 19K oligonucleotide microarrays were produced by and purchased from The Clive and Vera Ramaciotti Centre for Gene Function Analysis, University of NSW.
Cell Culture Conditions
The non-transformed human foreskin fibroblast cell line, FFbw002, was kindly donated by Noel Whitaker. Cells were grown in RPMI (Rosewell Park Memorial Institute) medium supplemented with 10% fetal bovine serum and maintained at 37 °C and 5% CO2 in a humidified incubator. Fibroblasts in log-phase growth were harvested prior to sub-culturing and drug treatment using mild trypsinisation.
Cytotoxicity Assay
Cytotoxicity determinations for cisplatin and transplatin were performed using an Alamar Blue™ assay. FFbw002 Human foreskin fibroblasts were seeded at a density of 2 × 10 5 cells/ml in 96–well, flat-bottomed microtitre plates in 100 μl of RPMI medium. Drugs (diluted in DMF) and controls were administered to cells in 100 μl of RPMI to give the final concentrations indicated: cisplatin (0.1mM to 100mM), transplatin (0.1 μM to 100 μM) and DMF (0.01% to 8% (v/v)). At least three replicates were performed for each administration. The plates were incubated at 37 °C in a humidified cell culture chamber with 5% CO2 for 5 hours. Twenty μl of Alamar Blue™ reagent was then added to each well and the plates were incubated for a further 3 hours. At this time, absorbance readings of the plates were immediately recorded using a Benchmark plate-reader with a sample wavelength of 570 nm and a reference of 595 nm. Following this eight-hour time point, plates were returned to the incubator and further absorbance readings were taken at 24 hours. Cell survival in the presence of drug was expressed as a percentage of cell growth in the drug-free DMF control corresponding to the% DMF in the drug treatment.
Drug Treatment and Total Rna Extraction
Harvested fibroblasts were incubated at a concentration of approximately 5 × 10 6 cells/ml RPMI medium, with varying concentrations of cisplatin or transplatin (each diluted in DMF), for 5 hours at 37 °C with 5% CO2. Total RNA was then isolated from cells using Tri-Reagent and the accompanying protocol for extracting total RNA from cultured cells (issued by Sigma). The integrity of total RNA was assessed using 1% agarose gel electrophoresis and its approximate concentration and purity estimated via UV spectrophotometry.
cDna Synthesis and Hybridisation
cDNA was synthesised using approximately 50 μg of total RNA in an oligo-dT(20mer)-primed reverse transcription reaction with Superscript II Reverse Transcriptase (Invitrogen). RNA was combined with 8 μl of 5× First Strand Superscript II Buffer (Invitrogen), 0.4nmol oligo-dT20, 10 μM DTT and made up to 32.2 μl with RNase-free H2O. Reactions were incubated for 5 minutes at 65 °C followed by 5 minutes at 42 °C. While at 42 °C, dATP, dGTP and dCTP nucleotides were added at a final concentration of 0.5 μM each, along with dTTP at 0.16 μM, aa(aminoalyl)-dUTP at 0.34 μM and 2 μl Superscript II Reverse Transcriptase. Reactions were then incubated for a further 2.5 hours at 42 °C. RNA was hydrolysed with the addition of 4ml of 50mM EDTA (pH8) and 2 μl of 10M NaOH to each sample, followed by an incubation of 20 minutes at 65 C. Reactions were neutralised with 4 μl of 5M acetic acid and then each sample was purified using a separate QIAquick PCR purification column (Qiagen). To couple mono-reactive fluorescent Cydyes (Amersham Biosciences) to the aminoalyl-dUTP moieties in target cDNA molecules, 9 μl of 0.1M NaHCO3 (pH9) and 2 μl of Cy5 (control samples) or Cy3 (drug-treated samples) were mixed with the appropriate samples. These reactions were left to incubate in a dark environment for 45 minutes at room temperature and then purified as above, using a separate QIAquick PCR purification column (Qiagen) for each sample. Hybridisation buffer was prepared with yeast tRNA (Sigma) at approximately 0.5 mg/ml and calf thymus DNA (Sigma) at approximately 0.5 mg/ml in DIG Easy Hyb (Roche). Concentrated Cy5(control) and Cy3(drug-treated) cDNA samples to be compared were combined directly with hybridisation buffer to a final volume of approximately 92 μl, heated for 5 minutes at 65 C and then allowed to cool to room temperature. Hybridisation mixtures were applied directly to microarray slides (Human 19K oligonucleotide arrays), each covered with a LifterSlip™ coverglass (ProSciTech) and then hybridised at 37 °C overnight (approximately 16 hours) in a humidified custom-made hybridisation chamber. LifterSlips™ were removed in 1 × SSC and slides washed three times in 1 × SSC/0.1% SDS at 50 °C. A final rinse in 1 × SSC was immediately followed by 10 minutes of centrifugation at 500 g to dry slides in preparation for scanning.
Microarray Scanning, Data Acquisition and Processing
Microarrays were scanned using an Axon 4000A laser-based scanner and image data was acquired through associated GenePix Pro 3.0 software. Further data manipulation and statistical analyses (see below) were undertaken in the R statistical computing environment (www.r-project.org) with additional microarray-specific R-packages available from the BioConductor project (http://www.bioconductor.org). The R-function,
Statistical Evaluation of Differential Gene Expression
Functions within the
Gene Categories Over-Represented among Differentially Expressed Transcripts
Analysis tools implemented within the software package EASE (Expression Analysis Systematic Explorer) were used to annotate differentially expressed transcripts and explore the “biological themes” of significant gene subsets. EASE is freely available through the URL http://www.david.niaid.nih.gov/david/ease.htm.
Results
The human gene expression response to cisplatin treatment was investigated using transcription profiling techniques. The use of oligonucleotide microarrays permitted the gene expression levels of many genes to be monitored simultaneously.
A human foreskin fibroblast cell line was employed and gene expression profiles were compiled for both cisplatin and its clinically ineffective isomer, transplatin. The transcriptional response of fibroblasts to drugs with different anti-tumour efficiencies could then be investigated.
Alamar Blue™ Cytotoxicity Assays
Fibroblasts were firstly subjected to cytotoxicity assays with cisplatin and transplatin to determine optimal treatment conditions for inducing a clinically relevant gene expression response. Fibroblasts were initially incubated at 37°C with drugs (or without drugs or controls) for 5 hours. At this time point, t = 5 hours, Alamar Blue™ reagent was added to each sample. Absorbance measurements were then taken at t = 8 and 24 hour time points and used to indicate the proportion of living cells remaining in each sample. Graphs in Figure 2 depict the percentage cell survival values determined for fibroblasts treated with 0.1–100 μM cisplatin or transplatin for 8 and 24 hours.

AlamarBlueTM Cytotoxicity Assay: Human fibroblasts treated with cisplatin and transplatin. Graphs indicate the % Cell Survival at (a) 8 and (b) 24 hours for 0.1–100μM Cisplatin and Transplatin. The data points shown are for drug concentrations of 0.1, 0.3, 1.0, 10, 25 and 100 μM, and have been averaged across three replicate values. Error bars represent the standard error of the mean. (Note: Scale of x-axis is in logarithmic format).
The cytotoxicity assay results for this particular fibroblast cell line indicated that there was a small to moderate difference between the cytotoxic effects elicited by cisplatin and transplatin. At the 8 hour time point, cisplatin was more toxic than transplatin at concentrations up to at least 25 μM. At 100 μM doses, transplatin appeared to induce slightly higher levels of cell death. For the 24 hour time point, however, cisplatin was consistently more cytotoxic to cells at all concentrations examined. Overall, drug concentrations ranging between 0.1 and 25 μM produced relatively low levels of cell death during both incubation periods. Within this dose range, the average cell survival estimates were 90% for cisplatin treatments and 95% for transplatin treatments. At drug concentrations above 25 μM, however, the cytotoxic effect of both compounds was more apparent.
In considering these results and those of the preliminary investigations, subsequent gene expression studies were conducted using 5 hour treatments with 1 μM cisplatin or transplatin. At this concentration, the cytotoxicity assay indicated that there was a slight difference between the toxic effects of the two isomers. To allow gene expression responses to
Microarray Experiments, Data Acquisition and Normalisation
All cell treatments were performed in quadruplicate. Total RNA was extracted from each cell population and used to synthesise fluorescently-labelled cDNA. cDNA samples derived from different treatments were then compared directly using human oligonucleotide microarrays containing approximately 19,000 human gene sequences and control elements. Microarray experiments, also carried out in quadruplicate, were performed for each of the following comparisons: DMF (control) vs 1 μM Cisplatin, DMF vs 1 μM Transplatin, DMF vs 25 μM Transplatin, 1 μM Transplatin vs 1 μM Cisplatin and 25 μM Transplatin vs 1 μM Cisplatin.
Following microarray scanning and data acquisition, raw results were processed and normalised as described in section 2.3.12. During these manipulations, the red and green fluorescence intensities were normalised relative to one another so that the green/red ratios approached an unbiased representation of relative expression levels. The ultimate aim of the normalisation process was to remove or reduce any systematic biases or errors in the results that were not due to the experimental condition(s) of interest (Smyth and Speed, 2003). In the current study, a “Robust Spline” method of intra-array normalisation was applied to data from each microarray using the
‘MA-plots’, as described by Yang et al., 2002, provided a convenient graphical means of representing the red (R) and green (G) fluorescence intensity data for each gene on the array. Within these plots, M(y-axis) = log2(R/G) and A(x-axis) = log2v(R × G). Thus, for each gene on the array, ‘M’ essentially describes the fluorescence intensity ratio, while ‘A’ represents the relative combined fluorescence intensity (Yang et al. 2002). Figure 3 shows a representative MA-plot for the normalised background-corrected data from DMF vs 1 μM Cisplatin treatment comparisons. Human gene transcripts with relatively up- or down-regulated expression levels due to cisplatin treatment are located below or above the ‘M = 0’ horizontal axis, respectively. In this study, MA-plots were particularly valuable in terms of identifying spot artifacts (or irregularities) and intensity-dependent trends in the log ratios (M-values). They were also employed for the purpose of monitoring and assessing the data normalisation procedures described above.

MA-plot of normalised data for DMF (control) versus 1 μM cisplatin treatment comparison. M (Log2(expression ratio)) and A (relative intensity) values were averaged across 4 replicate microarrays. M values greater than zero indicate transcripts which responded to cisplatin with decreased expression levels, while M values less than zero indicate transcripts with increased expression levels after cisplatin treatment.
Statistical Significance Evaluation– Overview
Having normalised the microarray data, the next step was to develop a statistically robust approach for defining differentially expressed transcripts. When examining such large sets of gene expression data, it is particularly crucial to address this issue since observed changes in expression may not always be a direct consequence of the test conditions. For example, altered expression patterns may result from variations in the data acquisition procedures or biologically insignificant fluctuations within the original cell populations that are not specifically related to the experimental conditions of interest. While many expression studies use a two-fold change in expression as the lower limit of significant gene expression changes, this approach can exclude valuable data and is not statistically flexible for use across multiple arrays. Instead, the current study adopted a statistically rigorous method for estimating and ranking the relative significance of observed gene expression changes.
Conducted within ‘R’, the main statistical procedure for defining differential expression implemented functions from the
Using the linear model approach described above, a “one-sample comparison” experimental design matrix was used to examine differential expression
B-statistics were computed for all five comparisons. Genes with the highest B-statistics thus had the highest likelihood of being differentially expressed within each group. Next, data from the first three microarray groups was combined within a “two-sample comparison” design matrix. This technique was employed to assess the extent of differential expression
One-Sample Comparison b-Statistic Analysis
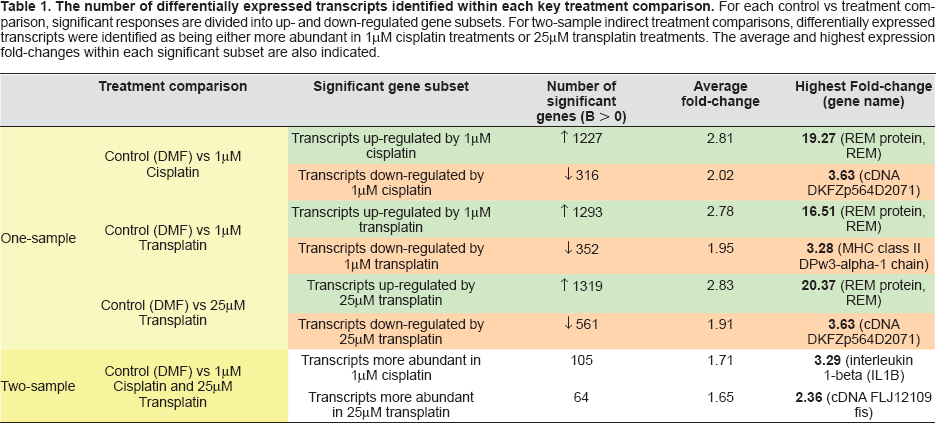
One-sample comparison B-statistic analyses were successfully employed to estimate the relative significance of ‘apparent’ changes in gene expression levels between control and drug-treated samples. Transcripts with B-statistic values greater than zero were defined as exhibiting significantly different expression levels in response to treatment, while the highest B-statistics indicated genes with the highest likelihood of being differentially expressed. This study revealed many genes that were differentially expressed in each of the three treatments examined: 1 μM cisplatin, 1 μM and 25 μM transplatin (see Table 1). For example, in cisplatin-treated cells, 1227 transcripts were found to exhibit significantly higher expression levels, while 316 transcripts were classed with significantly
The number of differentially expressed transcripts identified within each key treatment comparison. For each control vs treatment comparison, significant responses are divided into up- and down-regulated gene subsets. For two-sample indirect treatment comparisons, differentially expressed transcripts were identified as being either more abundant in 1μM cisplatin treatments or 25μM transplatin treatments. The average and highest expression fold-changes within each significant subset are also indicated.
One-Sample Comparison B-statistic Analysis: The first 20 known genes with significantly (a) higher and (b) lower expression levels in cells treated with 1 μM cisplatin. Transcripts are ranked in order of evidence for differential expression, according to one-sample comparison B-statistics and corresponding M and P-values. For each transcript with at least two data points, the average fold-change was calculated from the replicate values shown. Overall, 1245 transcripts were found to be significantly up-regulated in response to 1 μM cisplatin, while 352 were significantly down-regulated following treatment. Transcripts highlighted in yellow demonstrated the same expression response in transplatin treated cells.

Using the expression analysis program, EASE, gene annotation tools were next employed to identify gene categories that were over-represented in each differentially expressed gene subset compared to what was represented on the microarrays. Individual gene categories were also classed into one of the following gene ontology (GO) systems: molecular function, biological process or cellular component. In each analysis, the gene category with the lowest ‘EASE score’ was considered to be the most ‘over-represented’ or significant category within that subset of differentially expressed transcripts. The first 20 most over-represented gene categories among transcripts up- and down-regulated by 1mM cisplatin are shown in Table 3. As indicated, most of these categories were also over-represented among the significant transcripts of transplatin treatments. It is thus possible that many of the genes associated with these molecular functions and biological processes are involved in a more general response to the toxic insult.
One-sample B-statistics were also calculated for the Group 4 and Group 5 microarray data: 1 μM transplatin vs 1 μM cisplatin and 25 μM transplatin vs 1 μM cisplatin. However, this analysis largely yielded negative B-statistic values, implying that there were no significant differences between the transcriptional responses to each treatment. Another possibility was that variations between the treatment-specific gene expression profiles were of a magnitude that could not be resolved using this technique, especially in the presence of relatively large systematic errors and inherent dye biases. While dye-swapping or reciprocal labelling techniques are often employed in attempts to counteract such biases, this approach is more amenable to microarray experiments in which the differences between cDNA populations are of a higher magnitude (for example, when comparing different cell lines). In the current study, the average ‘significant’ drug-induced gene expression changes were only approximately two-fold relative to control (non-treated) samples (see Table 1). Since a key aim of this work was to study treatment-specific gene expression events, an alternative method for comparing the transcriptional responses to each treatment was investigated. For this purpose, a
One-Sample Comparison B-statistic Analysis: The first 20 most significantly over-represented gene categories among transcripts with significantly (a) higher and (b) lower expression levels in cells treated with 1 μM cisplatin. The number of transcripts in each gene category (List Hits) is also presented as a percentage of all the transcripts belonging to that category that were actually present on the microarray (Population Hits). Gene categories denoted with an asterisk were also significantly over-represented among transcripts demonstrating the same expression response in transplatin treated cells.

Two-Sample Comparison b-Statistic Analysis
The two-sample B-statistic analysis facilitated the simultaneous comparison of microarray data from two different ‘control vs treatment’ experiments. Through the
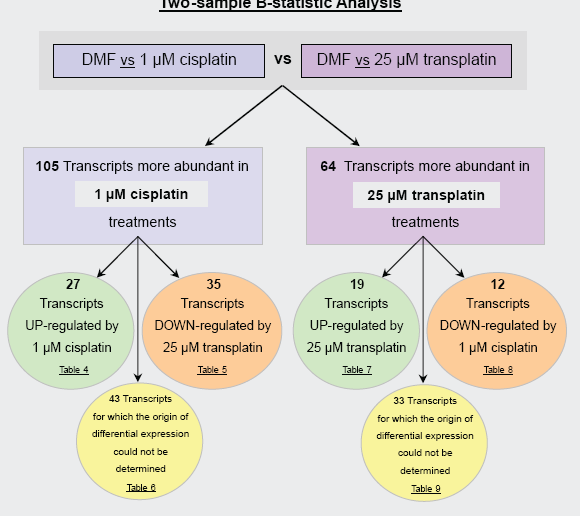
Overview of the two-sample comparison B-statistic analysis. This approach facilitated the simultaneous comparison of data from ‘DMF (control) vs 1 μM cisplatin’ and ‘DMF (control) vs 25 μM transplatin’ microarray comparisons. Through the
Two-sample comparison B-statistic analysis: transcripts significantly up-regulated in 1 μM cisplatin treatments (relative to both DMF (control) and 25 μM transplatin treatments). Transcripts are ranked in order of evidence for differential expression according to one-sample comparison B-statistics and corresponding P-values.

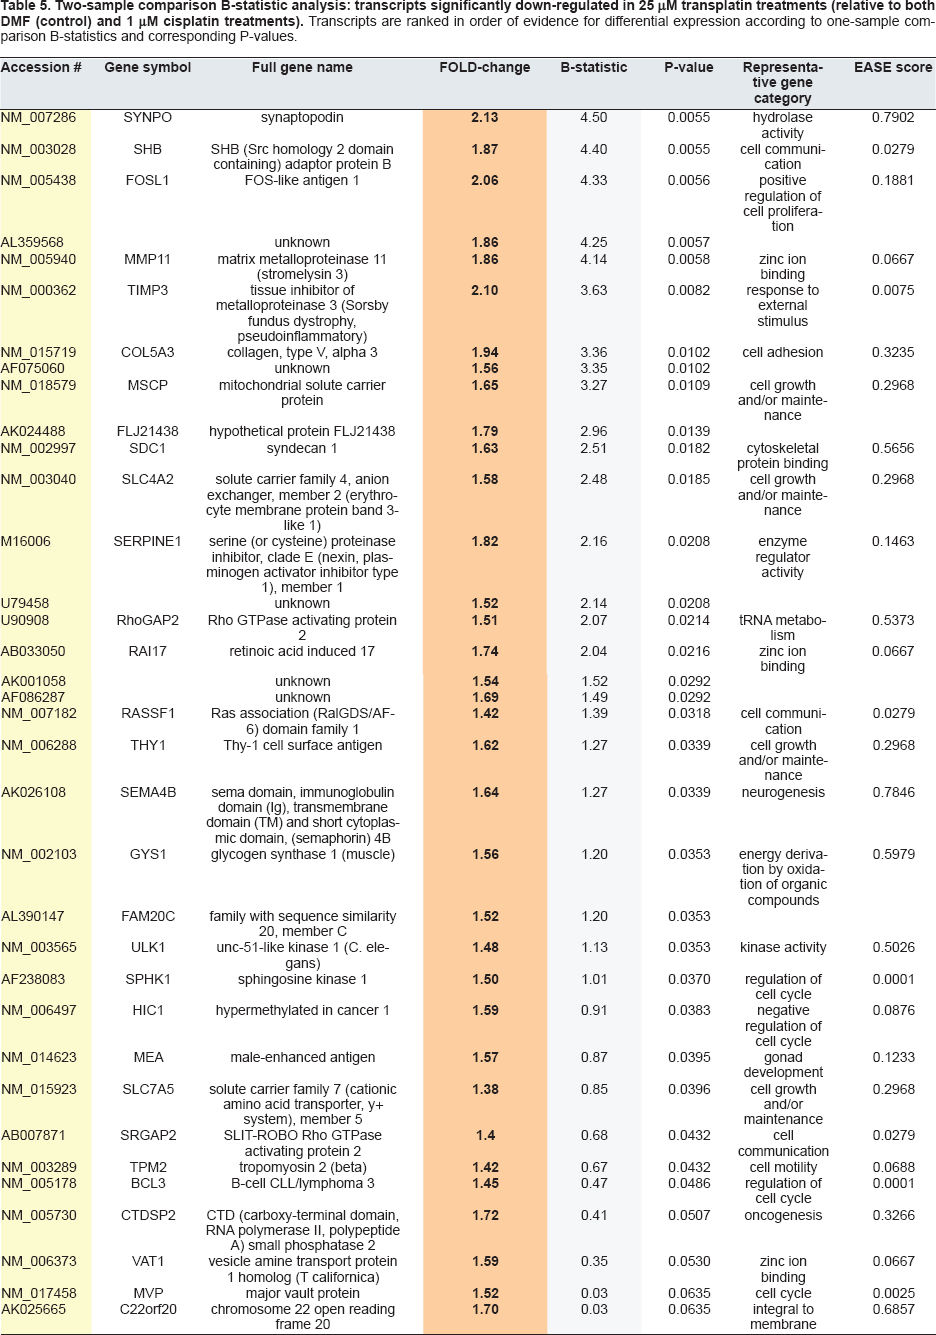
Two-sample comparison B-statistic analysis: transcripts significantly down-regulated in 25 μM transplatin treatments (relative to both DMF (control) and 1 μM cisplatin treatments). Transcripts are ranked in order of evidence for differential expression according to one-sample comparison B-statistics and corresponding P-values.
Two-sample comparison B-statistic analysis: transcripts abundant in 1 μM cisplatin treatments (relative to 25 μM transplatin treatments) for which a one-sample origin of differential expression could not be determined.

Two-sample comparison B-statistic analysis: transcripts significantly up-regulated in 25 μM transplatin treatments (relative to both DMF (control) and 1 μM cisplatin treatments). Transcripts are ranked in order of evidence for differential expression according to one-sample comparison B-statistics and corresponding P-values.

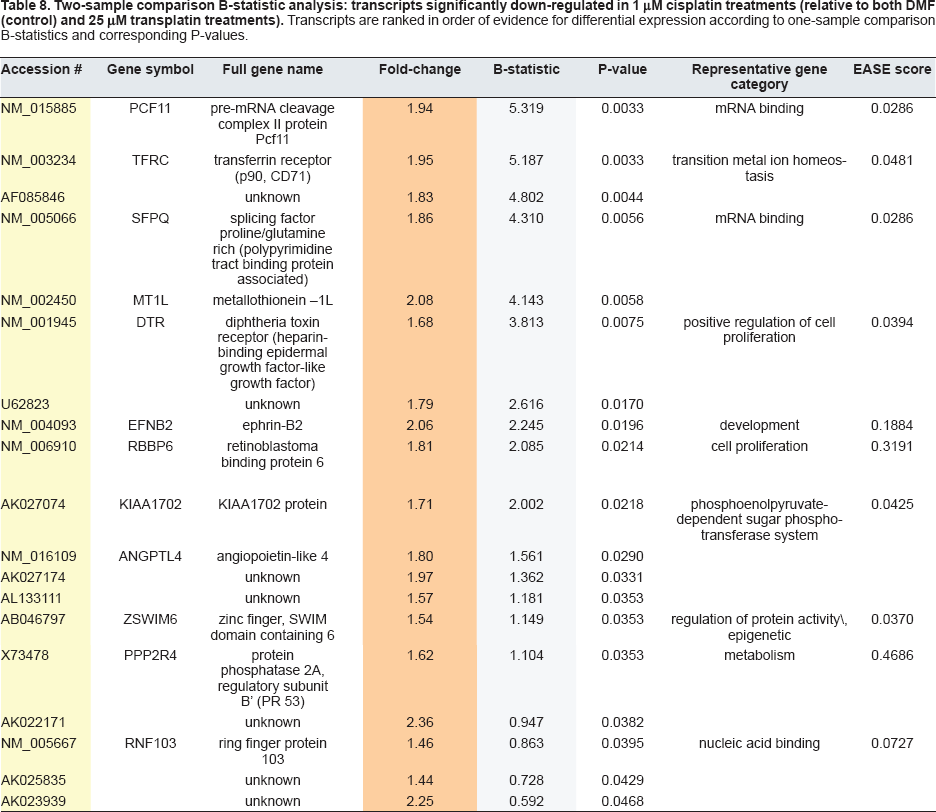
Two-sample comparison B-statistic analysis: transcripts significantly down-regulated in 1 μM cisplatin treatments (relative to both DMF (control) and 25 μM transplatin treatments). Transcripts are ranked in order of evidence for differential expression according to one-sample comparison B-statistics and corresponding P-values.
Two-sample comparison B-statistic analysis: transcripts abundant in 25 μM transplatin treatments (relative to 1 μM cisplatin treatments) for which a one-sample origin of differential expression could not be determined.

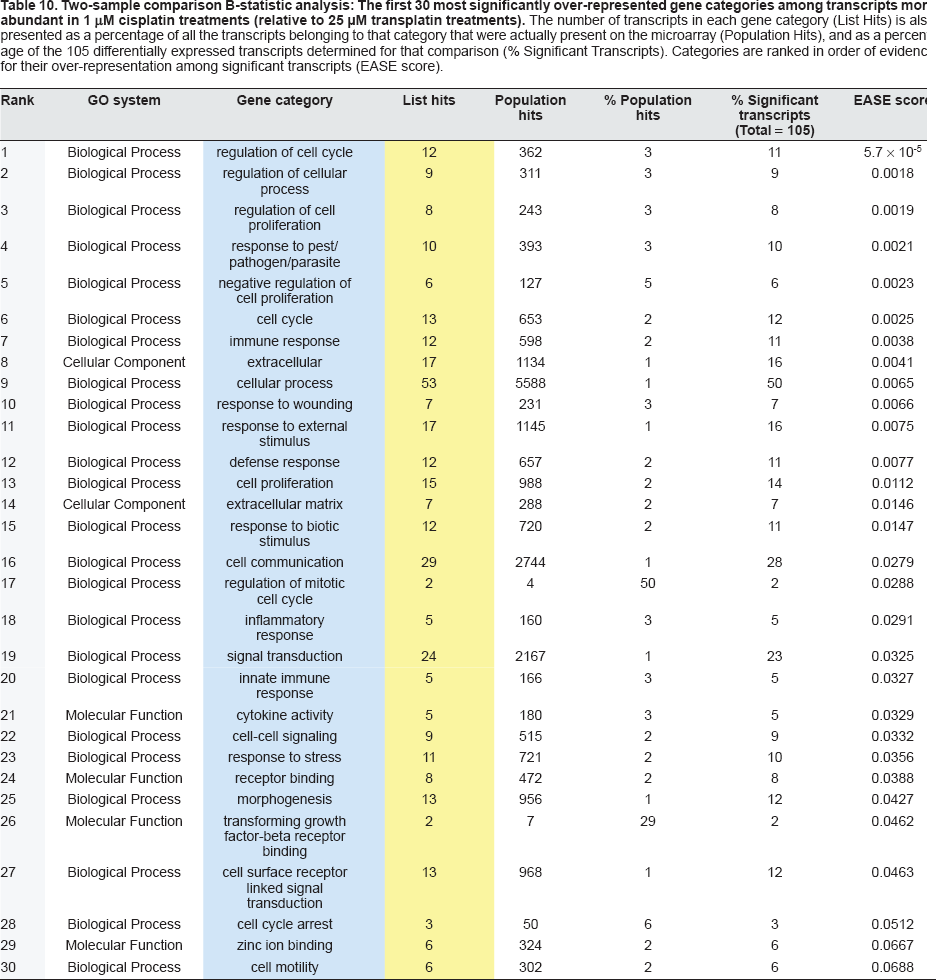
Functions within EASE were also employed to detect gene categories that were significantly over-represented among the 169 transcripts differentially expressed between cisplatin and transplatin treatments. Tables 10 and 11 show some of the most over-represented categories among transcripts found to be more abundant in 1 μM cisplatin and 25 μM transplatin treatments, respectively.
Two-sample comparison B-statistic analysis: The first 30 most significantly over-represented gene categories among transcripts more abundant in 1 μM cisplatin treatments (relative to 25 μM transplatin treatments). The number of transcripts in each gene category (List Hits) is also presented as a percentage of all the transcripts belonging to that category that were actually present on the microarray (Population Hits), and as a percentage of the 105 differentially expressed transcripts determined for that comparison (% Significant Transcripts). Categories are ranked in order of evidence for their over-representation among significant transcripts (EASE score).
Two-sample comparison B-statistic analysis: The first 30 most significantly over-represented gene categories among transcripts more abundant in 25 μM transplatin treatments (relative to 1 μM cisplatin treatments). The number of transcripts in each gene category (List Hits) is also presented as a percentage of all the transcripts belonging to that category that were actually present on the microarray (Population Hits), and as a percentage of the 64 differentially expressed transcripts determined for that comparison (% Significant Transcripts). Categories are ranked in order of evidence for their over-representation among significant transcripts (EASE score).

Discussion
The effect of the anti-tumour drug, cisplatin, on human gene expression was investigated using microarray-based transcription profiling techniques in human cells. The transcriptional response of human fibroblasts to a clinically relevant cisplatin dose was examined in detail using human 19K microarrays. Gene expression profiles were also compiled for transplatin, the therapeutically ineffective isomer of cisplatin. Statistically robust methods for assessing the significance of apparent changes in gene expression were then investigated. The first approach permitted the identification of human gene transcripts exhibiting significantly different expression levels in drug-treated compared to control samples. A second method was then used to reveal transcripts that were differentially expressed between the three drug treatments examined. During these comparisons, a subset of 169 transcripts was found to be differentially expressed between cisplatin and transplatin treatments. Gene ontology databases were used to recognise gene categories that were comparatively over-represented among the significant transcripts, compared to what was represented on the microarrays. This allowed the biological themes of the differential responses to cisplatin and transplatin treatments to be explored and further considered with respect to anti-tumour activity.
Transcription Profiling in Drug-Treated Cells: Overview
Toxic stress in cells can stimulate a range of biological responses, including the transcriptional modulation of genes regulating cell survival, DNA repair and cell death. It has thus been proposed that such complex patterns of induced gene expression changes could provide considerable insight into the mechanism of action of various toxic agents (Amin et al. 2002; Amundson et al. 1999; Caba et al. 2005; Hamadeh et al. 2002; Newton et al. 2004). For example, the discipline of toxicogenomics seeks to exploit the complexity of this response for the purpose of generating a molecular profile or signature that is characteristic of specific toxicant exposure (reviewed by (Gant and Zhang, 2005)). Furthermore, microarray-based genomic approaches can now serve as a powerful tool for exploring the molecular pathways and cellular processes that mediate the adverse responses to a particular compound (Caba et al. 2005).
The broad aim of the microarray experiments conducted in the present study was to investigate global gene expression responses to cisplatin exposure in human cells. The first significant outcome of this project was the establishment of distinct gene expression profiles for equitoxic doses of cisplatin and transplatin, relative to solvent (DMF) controls.
The second and somewhat more challenging aim of this study was to identify gene expression events that are unique to cisplatin treatment and could play an important role in its cytotoxic mechanism. For this purpose, transcription profiles constructed for cisplatin and its clinically ineffective isomer, transplatin, were compared. Many toxic compounds will lead to the induction of genes that are unrelated to anti-tumour activity. However, the use of active and inactive anti-tumour agents permits the identification of responses that contribute to anti-tumour activity and responses that do not contribute to anti-tumour activity. When sufficient data from different agents is combined, as in the case with cisplatin and transplatin, it may be possible to differentiate generic stress responses from compound-specific events (Burczynski et al. 2000; Gant and Zhang, 2005).
In order to extract accurate and informative data from this kind of gene expression study, there are several major experimental considerations that must also be addressed. One particular concern surrounds the biological system employed and its associated variables. In this project, non-transformed human foreskin fibroblasts were chosen as the initial cell type in which drug-induced gene expression profiles would be monitored. Most gene expression studies with cisplatin have been focused upon cancer cells against which cisplatin is successfully cytotoxic or ineffective due to problems of resistance (Clarke et al. 2004; Huerta et al. 2003; Lee et al. 2005; Macleod et al. 2005; Nakatani et al. 2005; Roberts et al. 2005; Takata et al. 2005; Toshimitsu et al. 2004; Wilson et al. 2005). Since both cancer and non-cancer cells of a patient are exposed to clinical treatments, a detailed look at the response of ‘normal’ cells to cisplatin may provide a more balanced insight into the toxic mechanism of this drug. Also, a number of important genes are “inactivated” in many tumour cells, such as p53 and retinoblastoma (Hill et al. 2005; Levine and Fleischli, 2000; Miller et al. 1996; Scheffner et al. 1991; Vaziri and Benchimol, 1999). Insight into the effect of cisplatin on the functional versions of such genes might thus be gained via the use of non-cancer cells in gene expression studies.
Biological variables that arise from experimental design, such as dose and time of exposure to the compound, also have a large impact on the analysis and subsequent interpretation of microarray data. These factors were thus given thorough consideration in the current study via several preliminary experiments. Filter macroarray studies revealed significant changes in gene expression upon the treatment of cells with 5 hour doses of cisplatin at concentrations between 1 and 50 μM. This study focused upon a moderate set of treatment conditions and a concentration of 1 μM cisplatin was chosen, since this dose falls within clinical ranges and has also been used in other microarray-based gene expression studies with cisplatin (Higuchi et al. 2003). Furthermore, this dose was not found to induce high levels of cell death in fibroblasts, according to cytotoxicity assay results. While gene expression profiles have already been used to define toxicity in various biological systems (Chang et al. 2003; Gant, 2002; van ‘t Veer et al. 2002), many of the chemical agents have been used at significantly toxic levels. It is now being recognised that more biologically relevant results are obtained under conditions of mild toxicity, particularly in the absence of any cellular or pathological changes (Gant and Zhang, 2005). Moreover, this approach has been successfully applied to identify differentially expressed genes during inflammatory responses to hexachlorobenzene (Ezendam et al. 2004). Together, these observations lend further support for the final choice of treatment conditions investigated here.
In order to compare the differential effects of cisplatin and transplatin treatments, two different concentrations of the clinically ineffective isomer were examined. In addition to an equimolar dose of 1 μM, a second approximately equitoxic dose of 25 μM transplatin was also selected for comparison with 1 μM cisplatin. Similar investigations have required transplatin at various doses between 2 and 100 times the concentration of cisplatin to achieve equitoxic effects (Burczynski et al. 2000; Sanchez-Perez et al. 1998; Sato et al. 1996). In addition, at least four-fold more transplatin than cisplatin adducts have been required to significantly inhibit transcription elongation in HeLa cells (Mello et al. 1995). However, in comparing 1 μM cisplatin and 25 μM transplatin doses, it is also possible that observed differences between gene expression profiles may arise purely due to the difference in drug ‘loads’. While the cytotoxicity assay indicated that relative toxicity levels were the same for these two treatments, the possibility of dose effects should also be taken into consideration. Interestingly, in the final microarray data, the relative magnitude of gene expression changes in 1 μM cisplatin-treated cells was generally more similar to the magnitude of changes in 25 μM transplatin treatments than in 1 μM transplatin treatments. This observation supports the final choice of isomer doses for comparison.
Apart from biological variables, another major experimental challenge relates to the intrinsic difficulties associated with the accurate measurement of gene expression – a problem that is further enlarged by the number of genes on a microarray. A means of overcoming such technical variations is through correct experimental design and the implementation of analytical procedures that ensure the data is as free from systematic errors as possible (Gant and Zhang, 2005; Zhang and Gant, 2004). In the current study, these issues were primarily addressed within the preliminary investigations. Microarray experiments using slides with smaller gene-sets were employed to trial hybridisation and array-scanning techniques with fluorescent dyes. Also, these trials used cDNA samples derived from HeLa and K562 cancer cells, since these cell lines were well characterised and known to be stable. Subsequent experiments conducted with larger arrays compared control (DMF) and cisplatin-treated samples in order to ascertain whether a stable response to the anti-tumour drug could be detected. As expected, the magnitude of the differences in gene expression levels between control and treated samples was significantly lower than that observed between the profiles of the two different cell lines. However, the fact that a subset of genes was found to exhibit significantly different expression levels in response to drug treatment satisfied a major goal of this project, which was to establish a gene expression profile for cisplatin-treated human cells using microarray technology.
The ultimate aim of this work then became to develop a complete system for reliably determining differentially expressed genes in drug-treated cells. In future research, such a test system could then be used with confidence to investigate the cytotoxic potential of other compounds (Burczynski et al. 2000; Caba et al. 2005; Gant and Zhang, 2005).
Oligonucleotide microarrays were used to investigate the transcriptional response of human fibroblasts to drug treatment. Through the use of refined normalisation procedures and rigorous statistical evaluation techniques, these experiments produced finite sets of genes that were classed as being differentially expressed in response to each of the three treatments examined. Additional cross-comparisons between different data sets led to the identification of a subset of genes that were differentially expressed between cisplatin and transplatin treatments.
The following sections briefly review and integrate the relevant literature relating to some of the more significant biological outcomes of the fibroblast microarray experiments. Particular emphasis is placed on the transcripts found to be differentially expressed between similarly toxic doses of cisplatin and transplatin. Since very rigorous and statistically robust methods for assessing differential gene expression were implemented in this part of the analysis, many of these transcripts are considered to be very good candidates for further investigation.
Transcriptional Responses Common to Cisplatin and Transplatin Treatments
The most important function of the one-sample B-statistic analyses was to identify genes with significantly different expression levels in control and drug-treated fibroblast samples. For all three treatments examined, results from the one-sample comparisons of microarray data clearly indicated that the cells exhibited a distinct transcriptional response to drug treatment (relative to control).
Differentially expressed transcripts were detected for each of the three treatments, forming separate transcription profiles for 1 μM cisplatin, 1 μM transplatin and 25 μM transplatin. Many of the differentially expressed transcripts were common to all three treatment profiles. However, considering the structural similarities between the two compounds and the relatively narrow dose range examined, this observation was not unexpected. A similar study by Burczynski and colleagues also describes a number of differentially expressed genes that are common to transcription profiles compiled for equitoxic doses of cisplatin and transplatin (Burczynski et al. 2000). Although it was not the purpose of this investigation to analyse these profiles in detail, it was interesting to note that some of the expression responses correlated well with observations from other DNA damage studies. For example, the interferon regulatory factors, IRF3 and IRF6, were both distinctly up-regulated in response to cisplatin and transplatin exposure in this study. The products of these genes are involved in a wide range of host defense mechanisms, and their activation by various environmental stresses, including DNA damage, has been well documented (Kim et al. 1999; Missiaglia et al. 2005). In the case of down-regulated transcripts, glutathione peroxidase 1 (GPX1) demonstrated significantly reduced expression levels in the cisplatin and transplatin treatments examined here. Similarly, decreased glutathione peroxidase expression and activity levels have already been observed following cisplatin exposure in a range of biological systems (Huang et al. 1997; Khynriam and Prasad, 2002; Naziroglu et al. 2004; Saad et al. 2004). Overall, such correlations clearly support the results obtained in this study.
EASE software was used to determine gene categories that were significantly over-represented among the transcripts of each treatment profile (see Table 3). Similarities between these expression profiles meant that many of the over-represented gene categories were also common to the three treatment groups. A number of the commonly over-represented categories corresponded to functions that have been previously implicated in the cellular response to toxic insult. Some of these involved genes with established roles in biological processes such as transport, cell growth and/or maintenance, signal transduction, cell proliferation and regulation of cell cycle. Other significant groups, such as lipid metabolism (which was the most over-represented category among up-regulated genes, see Table 3), have only few or no former associations with the cellular response to DNA damage (Vetoshkina and Dubskaia, 1993). Transcripts with roles in lipid metabolism included retinol dehydrogenase 16 (RODH-4), alkylglycerone phosphate synthase (AGPS) and apolipoprotein C-III (APOC3). Indeed, the complex series of events that results from drug-induced DNA damage involves multiple biological pathways, many of which are yet to be defined. Therefore, some of the significant genes identified here could prove to be novel regulators or mediators within the signal transduction pathways that are stimulated by DNA-adduct formation. Other transcripts may simply be part of the broader fibroblast response to toxic insult.
The next major goal of this investigation was to identify treatment-specific gene expression responses. While the microarray experiments that directly compared 1 μM cisplatin with 1 μM or 25 μM transplatin were originally designed to identify transcripts that were differentially expressed
Gene Expression Profiles Unique to Cisplatin and Transplatin Treatments
The two-sample comparison approach for inter-array data analysis readily identified transcripts that were differentially expressed between cisplatin and transplatin treatments. Altogether, 105 transcripts were found to be significantly more abundant in cisplatin treatments (Tables 4–6), while 64 transcripts were expressed to a greater extent in transplatin treatments (Tables 7–9). The application of gene ontology (GO) mapping and pathway analysis to this data illustrated the way in which such gene expression events could be placed in the context of the underlying pathways and processes affected. Among the 169 significant transcripts, EASE revealed a number of distinct and sometimes opposing biological themes. A particularly interesting result was ‘negative regulation of cell proliferation’, which was one of the more dominant themes associated with cisplatin treatments (Table 10). Genes assigned to this category included IL6, IL1B, IL8, TGFB1, GAS1, and ETS1. Other over-represented gene categories that reflected cisplatin's negative effects on cell growth were ‘apoptosis’, ‘programmed cell death’ and ‘cell cycle arrest’. Together, these themes are consistent with cisplatin's effective cytotoxic mechanism.
In sharp contrast, EASE characterised transplatin's differential transcript profile with a significant proportion of genes involved in the ‘positive regulation of cell proliferation’ (Table 11). These included DTR, CUL3 and IRS2. Other subsets of genes abundant in transplatin treatments had established roles in a range of more general nucleic acid metabolism and processing functions. Among these, RNA/mRNA binding and splicing properties were common, and ‘regulation of DNA-dependent transcription’ was represented by at least eight genes. Broadly, these themes suggest that cellular activities following transplatin exposure are focused at the level of DNA/RNA interactions and various transcriptional processes. Together with the ‘positive regulation of cell proliferation’ gene group, this could partly indicate the early effort or ability of cells to overcome the interference of transplatin adducts and maintain normal cellular processes.
Other aspects of transplatin's differential transcript profile related to methods for circumventing the negative effects of platinum exposure. For example, several transcripts more abundant in transplatin treatments mapped to ‘heavy metal sensitivity/resistance’, ‘metal ion homeostasis’ and transport-related categories. This suggests that under the conditions employed here, some detoxification pathways may be more active in response to transplatin than to cisplatin. Some of these genes may play a role in processes that act to lower intracellular transplatin concentrations and thus help to prevent any drug-mediated interference with normal cell growth.
This interpretation would also be consistent with transplatin's status as the therapeutically inactive isomer.
In contrast, many of the dominating biological processes and molecular functions associated with cisplatin's differential expression profile were directly concerned with the immediate fate of a cell (Table 10). ‘Regulation of cell proliferation’, ‘cell cycle arrest’ and ‘apoptosis’ are prime examples of such crucial processes. Interestingly, these categories were not as significantly represented among the transcripts of transplatin's unique profile. However, since both adduct recognition and repair processes can differ significantly for damage induced by cisplatin and transplatin, this observation may reflect the early differential response of cells to the two isomers (Ciccarelli et al. 1985; Hansson and Wood, 1989; Heiger-Bernays et al. 1990; Huang et al. 1994; Jamieson and Lippard, 1999; McA'Nulty and Lippard, 1996; Mello et al. 1995; Zamble et al. 1996). Also, while cisplatin and transplatin have been shown to inhibit DNA synthesis in a similar manner (Bernges and Holler, 1988; Ciccarelli et al. 1985; Harder et al. 1976; Heiger-Bernays et al. 1990; Mello et al. 1995; Salles et al. 1983), their differential effects on RNA transcription are also widely acknowledged (Brabec and Leng, 1993; Corda et al. 1993; Evans and Gralla, 1992; Mello et al. 1995; Mymryk et al. 1995; Zlatanova et al. 1998). Thus, it seems likely that transcript profiles would also reflect such differences.
Overall, the results described here suggest that, even at low doses, cisplatin may elicit a more complex stress response in cells compared to transplatin. This might then imply that the need to determine the immediate fate of a cell is more urgent in response to cisplatin exposure. Supporting this notion was the abundance of transcripts pertaining to the immune system, communication and cell signalling processes in cisplatin treatments. In an attempt to further characterise the molecular events that may be associated with the anti-tumour activity of cisplatin, some of the genes found to be specifically regulated by cisplatin (Tables 4 and 8), were considered in more detail.
Inter-array two-sample B-statistic comparisons effectively revealed at least 169 transcripts that were differentially expressed between cisplatin and transplatin treatments. The incorporation of results from the one-sample ‘control vs treatment’ comparisons provided a means to clarify the origins of a subset of these differential responses. These subsets, presented in Tables 4, 5, 7 and 8, describe the more consistent and statistically significant transcriptional responses that were differentially elicited by cisplatin and transplatin in this study. A brief functional review of some of the better characterised genes that were specifically up-(Table 4) or down-regulated (Table 8) by cisplatin gave insight into some of the processes that may contribute towards the anti-tumour activity of this compound.
Genes Specifically up-Regulated in Response to Cisplatin
The most common biological themes among the transcripts up-regulated by cisplatin involved cytokines, the regulation of cell proliferation, and other aspects of the cellular immune/defense response. Classed within each of these categories were the cytokines IL-1B, IL-6 and IL-8, which were all consistently up-regulated in response to cisplatin treatments. These molecules are important mediators of the inflammatory response and are also involved in a diverse range of cellular activities such as cell proliferation, differentiation, angiogenesis and apoptosis. Their ability to exert direct cytotoxic effects on tumour cells (Gaffney and Tsai, 1986; Poppenborg et al. 1999) or potentiate the effects of certain anti-tumour agents, has also been demonstrated (Benchekroun et al. 1993). Therefore, the collective increase in cytokine transcripts observed in the cisplatin-specific expression profile was considered to be significant. Several studies have already demonstrated a significant rise in interleukin-1 levels after cisplatin treatments in cultured cells (Shi et al. 1998; Sodhi and Pai, 1992; Suresh and Sodhi, 1991; Toubi et al. 2003) and in patients undergoing chemotherapy (Baiocchi et al. 1993). Furthermore, other groups have specifically reported that IL-1 enhances the sensitivity of tumour cells to cisplatin and that synergistic interactions between IL-1 and cisplatin may actually enhance p53–dependent apoptosis (Benchekroun et al. 1993; Poppenborg et al. 1999; Song et al. 1998).
The behaviour of cytokines IL-6 and IL-8 has also been examined extensively, particularly in cancer patients (Baiocchi et al. 1993; Bhalla et al. 2000; Darai et al. 2003). As for IL-1, an increased production of IL-6 and IL-8 in response to cisplatin has also been observed (Baiocchi et al. 1993; Shi et al. 1998; Toubi et al. 2003). In this study, the cisplatin-induced increase in IL-1B, IL-6 and IL-8 expression is thus consistent with previous findings and with the role of these cytokines as key biochemical modulators in a range of important biological functions.
Other elements of cisplatin's unique transcript profile relate to important signalling events that can affect DNA synthesis and cellular proliferation. For example, NMB, ITPR3 and PRKCBP1 are all implicated in the phosphoinositide cascade, which involves the activation of protein kinase C (PKC) and subsequent PKC-mediated effects. In this study, these three genes were specifically up-regulated in response to cisplatin exposure (Table 4). Neuromedin B (NMB) is a bombesin-like peptide found chiefly in the central nervous system and gastrointestinal tract (Minamino et al. 1983; Minamino et al. 1985; Namba et al. 1985). This peptide demonstrates autocrine and paracrine growth factor activity in some carcinomas (Lach et al. 1995; Moody et al. 1992; Mukai et al. 1987; Otsuki et al. 1987), but in its role as a bifunctional regulator of cell growth, it can also significantly inhibit cell growth when at high levels (Dobrzanski et al. 1993). ITPR3 and PRKCBP1 have other roles in the PKC transduction pathway. ITPR3 is a second messenger receptor that acts as an intracellular calcium channel (Maranto, 1994), while PRKCBP1 (protein kinase C binding protein 1) functions as an anchor for activated protein kinase C isoenzymes (Fossey et al. 2000). At present, the precise role of the PKC transduction pathway in the cellular response to cisplatin is yet to be fully clarified (Grunicke et al. 2003; Hayakawa et al. 1999). However, the cisplatin-enhanced expression of NMB, ITPR3 and PRKCBP1 in the current study may shed light on some of the key factors involved. Moreover, the absence of these expression events in the response to transplatin damage suggests a possible role for the phosphoinositide cascade in cisplatin's cytotoxic mechanism.
At least three transcripts among those specifically up-regulated by cisplatin had established or tentative growth suppressing properties: GAS1 (growth arrest specific 1), CDX1 (caudal type homeobox transcription factor 1) and AIM1 (absent in melanoma 1). GAS1 is an integral plasma membrane protein directly involved in the negative regulation of cell proliferation and, in some cases, apoptosis (Del Sal et al. 1995; Evdokiou and Cowled, 1998; Zamorano et al. 2004). CDX1 encodes an intestine-specific transcription factor that demonstrates both pro-oncogenic functions and growth-inhibitory effects (Domon-Dell et al. 2003; Lynch et al. 2003). AIM1, a novel non-lens member of the betagamma-crystallin superfamily, is a putative suppressor of human malignant melanoma and is associated with the control and experimental reversal of tumourigenicity (Ray et al. 1997). To date, GAS1, CDX1 and AIM1 have not been implicated in the response of cells to cisplatin damage.
In contrast, cisplatin-induced transcripts that have been shown to influence cell growth in a positive manner include CDC25B, G0S2 and AGER. CDC25B (cell division cycle 25B) and G0S2 (putative lymphocyte G0/G1 switch gene) both exert their most prominent effects through the regulation of the cell cycle. CDC25B and other CDC25 genes encode protein threonine/tyrosine phosphatases that drive cell cycle progression through the activation of cyclin dependent kinases. With obvious growth-promoting properties, CDC25B over-expression has been demonstrated in a number of cancers including head, neck, gastric, ovarian, esophageal and prostate tumours, as well as non Hodgkin's lymphoma (Broggini et al. 2000; Gasparotto et al. 1997; Hernandez et al. 1998; Kishi et al. 2002; Kudo et al. 1997; Miyata et al. 2000; Ngan et al. 2003). While the precise function of G0S2 is yet to be established, its major role in cell cycle regulation is believed to involve the switch of lymphocytes from G0 to G1 phases (Cristillo et al. 1997; Russell and Forsdyke, 1991). AGER (advanced glycosylation end product-specific receptor), or RAGE, is generally a tumour-associated antigen and has been shown to stimulate cell proliferation and survival (Adams et al. 2002; Arumugam et al. 2004; Eichmuller et al. 2002; Hsieh et al. 2003). Also, at least one study has implicated AGER in the up-regulation of the pro-inflammatory cytokine IL-6 (Dukic-Stefanovic et al. 2003), which was also induced in the current study.
Genes Specifically Down-Regulated in Response to Cisplatin
Within this study, many of the transcripts found to be specifically down-regulated in response to cisplatin (Table 8) appeared to be more consistently associated with tumour-promoting or growth-stimulating effects. This finding is significant because the relative inhibition of such effects via decreased gene expression could contribute to the efficient anti-tumour mechanism of cisplatin. Among the down-regulated transcripts, genes that have been specifically linked with the potential for promoting growth and/or proliferation include: ephrin-B2 (EFNB2), angiopoietin-like 4 (ANG-PTL4), diphtheria toxin receptor (DTR) and splicing factor proline/glutamine rich (SFPQ). Such associations are outlined briefly, below.
The ephrin-B2 gene encodes a member of the ephrin (EPH) family which, along with the EPH-related receptors, comprise a large subfamily of receptor protein-tyrosine kinases (Bennett et al. 1995). Members have been most strongly been implicated in mediating developmental events, particularly in the central nervous system (Takasu et al. 2002) and in erythropoiesis (Suenobu et al. 2002). EFNB2 expression has also been associated with cellular proliferation (Batlle et al. 2002; Steinle et al. 2003), cell migration (Steinle et al. 2003), angiogenesis (Noren et al. 2004) and the progression of a wide range of human cancers, including malignant melanoma (Vogt et al. 1998), small cell lung carcinoma (Tang et al. 1999), osteosarcoma (Varelias et al. 2002), endometrial cancer (Takai et al. 2001), colon/colorectal carcinoma (Liu et al. 2004) and breast cancer (Noren et al. 2004). In fact, the capacity of the EFNB2 ligand to increase the potential for growth, tumourigenicity and metastasis in many of these tumour cells is becoming increasingly apparent (Noren et al. 2004; Takai et al. 2001; Vogt et al. 1998).
The ANGPTL4 gene encodes an angiopoietin-like secreted glycoprotein (Kim et al. 2000; Yoon et al. 2000). It is one of the targets of the nuclear receptor, peroxisome proliferator-activated receptor gamma (PPARgamma), and has proposed roles in adipose differentiation, lipid metabolism, glucose homeostasis and angiogenesis (Chen et al. 2004; Kersten et al. 2000; Le Jan et al. 2003; Lee and Evans, 2002; Schmuth et al. 2004; Yoon et al. 2000; Zhu et al. 2002). Like EFNB2, ANGPTL4 has also been associated with the development of a range of cancers, including colorectal cancer, renal cell carcinoma, bladder tumours and gastric cancer (Kaneda et al. 2002; Landi et al. 2003; Le Jan et al. 2003; Yoshimura et al. 2003).
DTR, also known as the heparin-binding EGF-like growth factor (HB-EGF), encodes a transmembrane protein that interacts with membrane protein DRAP27/CD9 to form the functional diphtheria toxin receptor (Fen et al. 1993; Hayes et al. 1987; Higashiyama et al. 1995; Iwamoto et al. 1994). In keeping with the growth-promoting characteristics of other down-regulated transcripts in this study, DTR demonstrates growth factor activity and mitogenic activity (Higashiyama et al. 1991; Higashiyama et al. 1995). The capacity of the diphtheria toxin receptor to stimulate cell migration and proliferation has also been documented (Higashiyama et al. 1991; Iivanainen et al. 2003; Kiso et al. 2003), as has its contribution to the tumourigenesis of gastric epithelial cell cancers (Murayama et al. 2002; Wallasch et al. 2002).
SFPQ (splicing factor proline/glutamine rich) is a novel and essential pre-mRNA splicing factor (Patton et al. 1993). It has been implicated in both early and late steps of pre-mRNA splicing and is required in spliceosome formation (Patton et al. 1993). With a number of roles in various nuclear processes, SFPQ has also been linked with virally-mediated steroidogenesis and oncogenesis (Song et al. 2004). Another positive association with cellular proliferation is the DNA-pairing activity exhibited by this protein, which has been directly implicated in the reestablishment of stalled replication forks (Akhmedov and Lopez, 2000).
Among the remaining transcripts in this study with reduced expression levels in response to cisplatin exposure, the metallothionein-1L (MT1L) and transferrin receptor (TFRC) genes have been most thoroughly studied and characterised. Although not directly associated with the promotion of cell growth, MT1L and TFRC respectively play major roles in metal detoxification and iron metabolism, both of which are essential cellular processes. Furthermore, the relative effect of cisplatin treatment on MT1L and TFRC has already been addressed in a number of studies, as discussed below.
Metallothioneins are intracellular metal-binding proteins that are generally found to confer drug resistance when induced in tumour tissues. Metallothionein-mediated cisplatin resistance, for instance, is well documented (Bakka et al. 1981; Basu and Lazo, 1990; Endresen and Rugstad, 1987; Kelland et al. 1992; Satoh et al. 1994; Suganuma et al. 2003; Yang et al. 1994). Although cisplatin has also been found to induce metallothionein expression in tumour cells (Bauman et al. 1991; Farnworth et al. 1989; Harford and Sarkar, 1989; Kondo et al. 2003; Matsumoto et al. 1997; Singh and Koropatnick, 1988; Zhang et al. 1995), induction appears to be dependent on the protein isoform and the drug-resistant status of the cells (Kinsler and Bell, 1985; Nakano et al. 2003). Furthermore, metallothionein has also been shown to exhibit a biphasic transcriptional response to DNA damage in which early expression levels are largely depressed (Hansen et al. 1997). In considering these observations, it is thus possible that reduced metallothionein expression could contribute to early drug-induced anti-proliferative effects by lessening the chemo-protection that is usually afforded by increased metallothionein levels. In further support of the findings reported in this thesis, comparative studies with cisplatin and transplatin have shown that the inactive isomer interacts at a significantly faster rate with metallothionein, and does not appear to induce its biosynthesis (Farnworth et al. 1989; Harford and Sarkar, 1989; Zelazowski et al. 1984; Zhang et al. 1995).
As introduced above, the transferrin receptor gene, TFRC, encodes a glycoprotein with an essential role in iron metabolism (Omary and Trowbridge, 1981; Schneider et al. 1984). Several interesting relationships between cisplatin and TFRC have also been revealed. Firstly, the ability of cisplatin to bind transferrin is well established, and there is evidence that the cisplatin-transferrin complex can be transported into cells via the transferrin receptor (Allardyce et al. 2002; Gullo et al. 1980; Hamada 1988; Head et al. 1997; Sykes et al. 1985). In another study, cisplatin-induced transferrin modulation was found to be accompanied by severe spermatogenic damage in rat testes (Nambu and Kumamoto, 1995). This observation may be significant because it has the potential to provide insight into the enhanced sensitivity of testicular carcinomas to cisplatin-based therapies.
Various studies have also documented the reduced expression of TFRC mRNA after cisplatin treatment (Marazzi et al. 1991; Parodi et al. 1988; Tonini et al. 1986), an observation that is consistent with the findings reported in the current study. Moreover, Marazzi and colleagues (1991) observed that this effect correlated well with low TFRC protein expression and the inhibition of DNA synthesis and cellular proliferation. Conversely, a number of studies have reported a distinct correlation between higher levels of TFRC expression and increased cellular proliferation in cancer cells (Miyamoto, 1992; Moura et al. 2004; Staber et al. 2004). Together, these findings suggest a more defined role for TFRC in promoting cellular growth and proliferation – again, a common theme among the genes down-modulated by cisplatin in this study. Overall, the connection between TFRC and cisplatin damage is potentially an interesting one, and certainly worthy of further study.
Conclusion
In conclusion, the current study has utilised microarrays to identify a number of genes that are differentially expressed in human cells in response to cisplatin and transplatin treatments. However, the functional interpretation of transcriptional events revealed by microarray analysis still presents a major challenge. Researching the known properties and functions of such genes is indeed a small but important step towards understanding their biological relevance in the experimental context of interest. In the present study, such investigations provided insight into several gene expression responses that are uniquely elicited by cisplatin with respect to its clinically ineffective isomer, transplatin. This data has indicted a number of genes that would be strong candidates for further gene function analysis that can mimic the effect of cisplatin at the gene expression level.
Abbreviations
bp, base pair; cisplatin, cis-diamminedichloroplat inum(II); transplatin, trans-diamminedichloropla tinum(II).
Footnotes
Acknowledgments
This work was supported in part by grants from the NHMRC and the University of NSW.