
Abstract
Cells of the immune system undergo activation and subsequent proliferation in the normal course of an immune response. Infrequently, the molecular and cellular events that underlie the mechanisms of proliferation are dysregulated and may lead to oncogenesis, leading to tumor formation. The most common forms of immunological cancers are lymphomas, which in dogs account for 8%-20% of all cancers, affecting up to 1.2% of the dog population. Key genes involved in negatively regulating proliferation of lymphocytes include a group classified as tumor suppressor genes (TSGs). These genes are also known to be associated with progression of lymphoma in humans, mice, and dogs and are potential candidates for pathological grading and diagnosis. The aim of the present study was to analyze TSG profiles in stimulated leukocytes from dogs to identify genes that discriminate an activated phenotype. A total of 554 TSGs and three gene set collections were analyzed from microarray data. Cluster analysis of three subsets of genes discriminated between stimulated and unstimulated cells. These included 20 most upregulated and downregulated TSGs, TSG in hallmark gene sets significantly enriched in active cells, and a selection of candidate TSGs, p15 (
Introduction
The application of genomics to medicine and pathology has moved very quickly in humans, particularly in cancer diagnosis and treatment. The use of gene expression signatures and identification of biomarkers, such as miRNAs, have been particularly valuable in dissecting cancer pathogenesis and pathological grading of cancer types.1–3 Similar developments in veterinary medicine are beginning to emerge, with progress informed by the experience in humans. 4 One relatively common disease that has received attention is canine lymphoma. Although there are a number of subtypes with differing pathogeneses, many show characteristics of activated lymphocytes.
During their life cycle, lymphocytes undergo rapid periods of clonal expansion and contraction during ontogeny and differentiation as a result of activation-induced proliferation caused by invading pathogens. Proliferation requires the activation of up to 10,000 genes and a complex program of signal transduction and cell division. When the program of proliferation and regression is disturbed, cells may undergo oncogenic transformation, resulting in the development of lymphoma. Lymphoma is one of the most common cancers in dogs, accounting for up to 20.1% of cancers in male dogs and 8.4% in female dogs.5,6 Lymphoma can be classified into two distinct immunophenotypes, those of B-cell origin and those of T-cell origin, representing 67% and 31% of canine non-Hodgkin's lymphoma cases, respectively. 7 T-cell lymphomas proliferate at higher rates than B-cell lymphomas, making them an aggressive cancer with poor prognosis. They are also less responsive to treatment and do not respond well to a typical course of chemotherapy. 8
The development of lymphoma is a complex process that results from accumulation of mutations that disrupt normal homeostatic mechanisms of cell cycle progression and apoptosis. 9 Under normal circumstances, cell cycle progression is regulated by cyclins and phosphorylation states of key molecules controlled by cyclin-dependent kinases. There is also a major class of molecules that inhibit progression, providing what are referred to as checkpoints during transition from progressive stages of the cell cycle. Many of these molecules have also been characterized as tumor suppressors, reflecting the fact that oncogenesis can arise as a result of loss of function mutations in the genes that code for these proteins. Because these molecules function as negative regulators, the processes of lymphocyte activation and maintenance of a proliferative state are sensitive to changes in tumor suppressor gene (TSG) expression levels.
The family of TSGs has gradually increased with further definition of the functional category that extends beyond cell cycle arrest to apoptosis and repair of damaged DNA.
10
Furthermore, either changes to gene expression levels or functional mutations of TSGs can compromise regulatory checkpoints and increase the likelihood of uncontrolled cell proliferation.
11
These changes may occur prior to, or after tumorigenesis, and have the potential to contribute to both lymphomagenesis and disease progression.
12
Documented somatic changes in canine lymphoma include reduced expression of the tumor suppressor/cell cycle regulatory protein, p16INK4A (
We hypothesized that the levels of subsets of TSG expression may be good indicators of activated lymphocytes and may be useful as diagnostic or prognostic tools in canine lymphoma, similar to the use of gene expression profiles that have been used to discover and implement biomarkers in human lymphoproliferative disorders. Hence, the aim of the present study was to analyze expression profiles of canine TSGs in leukocytes to identify genes that discriminate between resting and activated states. The analysis focused on data from microarray analysis and annotation based on human and canine databases. Three gene set collections were also tested for enrichment with activated cells. Additional analysis focused on quantitative reverse-transcriptase polymerase chain reaction (qRT-PCR) for seven candidate genes known to be involved in control of cell cycle progression and with previous links to lymphoma.
Materials and Methods
Sample Selection and RNA Extraction
Samples included in the study were derived from 11 dogs, all Bullmastiffs ranging between eight months and seven years of age. The study was approved by the University of Sydney Animal Ethics Committee under protocol N00/3-2009/3/4949. RNA from each of the dogs was obtained from blood samples collected by a veterinarian. The leukocyte fraction from each sample was divided into two tubes, each resuspended in 1 mL of Dulbecco's modified Eagle's medium. Half the samples were then stimulated through the addition of 5 μg of phytohemagglutinin (PHA), as previously described. 16 Briefly, total RNA was isolated from samples using a modified extraction procedure and microspin columns, according to manufacturer's recommendations (QIAmp; Qiagen). Purified RNA was eluted in 30 μL of RNase-free water and stored at −80 °C.
Microarray Analysis
Analysis of microarray data was performed as described previously. 16 Briefly, background correction and quantile normalization were performed on the data with probe-set intensities calculated accordingly using the Robust Multichip Average 17 algorithm available from the Affymetrix Expression Console Software. Differential expression (DE) of genes between stimulated and unstimulated T-cells was defined using the limma function (linear model approach) 18 incorporated in the R package – oneChannelGUI. A rank fold change was used to identify DE genes, with a cutoff of ±2-fold, corresponding to a Benjamini and Hochberg adjusted false discovery rate (FDR) of 0.05. 19
Identification of TSGs
A list of TSGs was retrieved from database and literature sources. A total of 637 gene records were downloaded from TSGene.
20
Each of the 637 genes was manually annotated for
Gene Set Enrichment Analysis and Functional Annotation Clustering
Gene sets within the TSG subset significantly enriched in activated leukocytes were identified using gene set enrichment analysis.21,22 Three gene set collections downloaded from the Molecular Signatures Database were used, including hallmark gene sets (50 gene sets), gene ontology (GO) gene sets (1454 gene sets), and oncogenic signature gene sets (189 gene sets).
21
Gene sets with a nominal
Cluster Analysis
Cluster analysis of microarray data was performed on all TSGs annotated from the microarray as well as a separate analysis of the 20 most downregulated and upregulated genes, by rank. Separate cluster analyses were performed on TSG in hallmark gene sets significantly enriched with activated cells and genes known to be associated with lymphoma. Microarray expression data were input using R-statistical package and outputs generated through an integrated cluster analysis and display program, Heatmap (https://cran.r-project.org/web/packages/gplots/index.html). Additional annotations were sourced from Heatplus.
Quantitative Reverse Transcription PCR
Primers for candidate genes were designed using the online Primer 3 Plus software. 24 Canine DNA sequences were obtained from GenBank at NCBI. Ensembl was used to visualize gene structure and assist in design around the intron–exon boundaries. Each primer was designed to generate an amplicon of between 100 and 200 bp and spanned at least one intron to avoid amplification of any residual genomic DNA (Table 1). Primers were commercially manufactured (Thermo Fisher Scientific). Canine RNA samples (1 μg) were reverse transcribed into cDNA using the GoScript Reverse Transcription System (Promega) with oligo-dT primers, and the following protocol: denaturation at 70 °C for five minutes, extension at 42 °C for one hour, and inactivation at 70 °C for 15 minutes. Resulting cDNA was used as template for PCR under the following cycling conditions: activation cycle at 95 °C for five minutes, followed by 35 cycles at 94 °C for one minute, at 60°C for one minute, and at 70 °C for one minute. PCR products were initially visualized on a 2% agarose gel to confirm amplification of correct amplicons.
List of TSG primers used for qRT-PCR.

Relative gene expression for a subset of six samples (SM5, SM6, SM9, SM13, SM14, and SM16) was determined using qRT-PCR and a SYBR green mastermix (QuantiFast; Qiagen) with the same protocol as described in the preceding section and monitored via real-time thermal cycler (Rotor-Gene 6000; Qiagen). Each sample was run in duplicate. GAPDH was included as an endogenous control gene. RNA from the remaining five dogs was unavailable for use in qRT-PCR.
The delta–delta Ct method was used to estimate relative transcript levels for each gene.
25
All Ct values were normalized against a
Results
Identification of TsGs
Of the 637 genes identified in the TSG database, a total of 554 TSGs were identified as being expressed in leukocytes. TSGs p53, p21 (
Gene Set Enrichment Analysis and Functional Annotation
A total of 49 genes sets consisting of TSG subsets were significantly enriched in activated leukocytes (Table 2). These included 3 upregulated hallmark gene sets, TNFA signaling via NF-kB, p53 signaling, and mTORC1 signaling, and 46 GO gene sets. No oncogenic signaling gene sets were significantly enriched in activated cells. A total of five biologically significant functional annotation clusters were identified in the 20 TSG subsets, and clusters identified were associated with cellular response to stimulation, ion binding, regulation of I-kappaB kinase/NF-kappaB cascade, negative regulation of cell proliferation, and regulation of leukocytes (enrichment scores 2.3, 2.01, 1.96, 1.96, and 1.39, respectively).
Gene sets significantly enriched with activated leukocytes.

Cluster Analysis
Cluster analysis demonstrated the variation in expression of TSGs across all samples. Clustering based on all 554 TSGs showed no distinguishable pattern of expression between stimulated and unstimulated samples (data not shown). However, it was clear that stimulation had a notable effect on expression of subsets of TSG in these dogs. A subset consists of 10 most downregulated genes, including
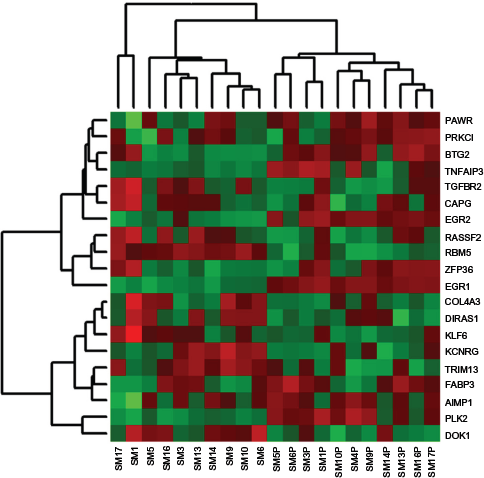
Cluster analysis of top 10 most downregulated and top 10 most upregulated TSG in stimulated and unstimulated cells. Clustering of samples is shown across the top of the image. Samples denoted with the “P” suffix were stimulated with PHA. Expression level increases from green (downregulated) to red (upregulated). Sample SM4P has no paired unstimulated sample.
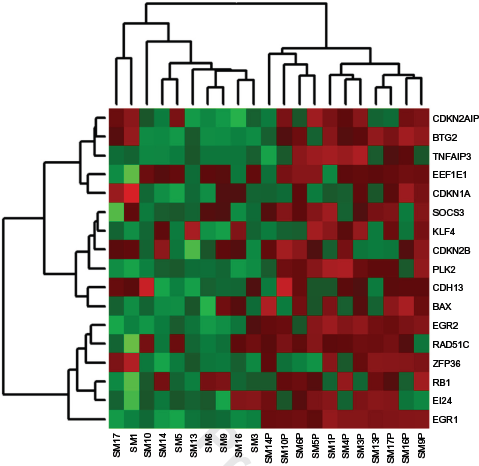
Cluster analysis of TSG in hallmark gene sets significantly enriched with stimulated cells. Samples denoted with the “P” suffix were stimulated with PHA. Expression level increases from green (downregulated) to red (upregulated). Sample SM4P has no paired unstimulated sample.
Cluster analysis of the candidate TSGs showed a less distinctive pattern of expression (Fig. 3). Seven dogs showed consistent upregulation of p18, p19, p21, and p27 in active cells highlighting a regulated response following activation in these individuals. Expression of p53 and p15 showed more variation across dogs and activation states. Variation in expression patterns between dogs was evident, and the majority of genes in the subset downregulated in activated samples from dogs SM1, SM10, and SM17.
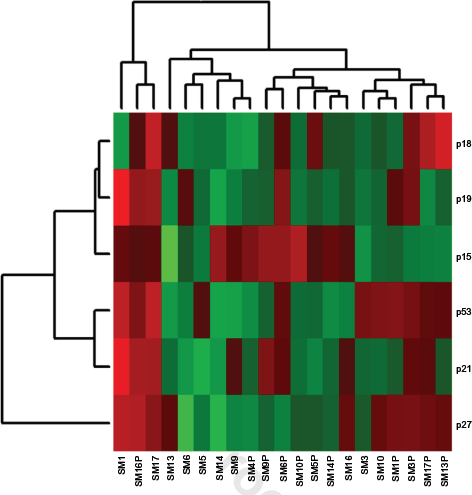
Cluster analysis of selected candidate TSG in stimulated and unstimulated cells. Samples denoted with the “P” suffix were stimulated with PHA. Expression level increases from green (downregulated) to red (upregulated). Sample SM4P has no paired unstimulated sample.
Analysis by qRT-PCR
Primers were designed for seven different genes, including p18, p19, p21, p27, p53, p14, and p15. Primers designed for the p16 gene failed to amplify the targeted region despite multiple designs, modification, and optimization. Analysis of differential gene expression between stimulated and unstimulated samples was expressed as relative fold change. DE based on qRT-PCR was compared with values from microarray analysis, shown as a comparative histogram for all genes except for p14, which was not annotated within the microarray data (Fig. 4). All genes were consistently upregulated in stimulated samples relative to unstimulated, with the exception of p53, once again indicating a regulated response after stimulation in 6 of the 11 dogs.
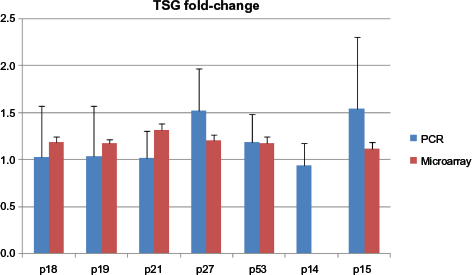
Comparison of differential gene expression for selected candidate genes. Changes in expression measured by qRT-PCR are shown relative to normalized microarray levels for the same genes in six dogs.
Discussion
The phenotype of lymphomas derived from mature lymphocytes may vary considerably but is usually indicative of an activated lymphocyte state. Identification of TSG expression profiles associated with an activated lymphocyte phenotype in dogs can be used to distinguish between normal and pathogenic expression profiles. Here, we isolated cells from blood, considered to represent a naive phenotype, and stimulated them
The lack of any distinctive clustering pattern in the analysis of the entire set of TSG suggests that TSG expression responded variably to the stimulation protocol used in this study. This method induces a relatively low level of activation in the immediate-early period of gene responses. The lack of distinctive patterns is perhaps not surprising given the large number of genes in the total group. A distinct pattern of expression between stimulated and unstimulated cells could be seen in a subset of 20 TSG genes consisting of 10 most upregulated and 10 most downregulated genes. Functional annotation of this TSG subset highlighted the role of these genes in cellular response pathways, regulation of cell death and apoptosis, differentiation and activation of leukocytes, and negative regulation of cell proliferation. Distinct expression patterns of genes from similar functional groups following activation have been identified in both humans and mice.26–29 These genes highlight that under- and overrepresented genes in an activated phenotype may be useful for discrimination.
Expression profiles of TSG within significantly enriched gene sets provide additional candidates for distinguishing between activation states. TSG associated with GO gene sets, including regulation of cellular metabolism, transcription, catabolic processes, apoptosis, and inflammatory responses, were significantly enriched in activated cells highlighting the importance of these biological functions in leukocyte activation. Most notable are the enriched hallmark gene sets consisting of three well known cell regulation pathways. The p53 pathway identified is important for cellular response to stress signals and initiation of cell cycle arrest and apoptosis. 30 p53 mutations and dysregulation of the p53 pathway are frequent events in tumorigenesis.31,32 An NF-kB regulatory pathway was also enriched in activated cells, important in innate immunity and inflammatory response. Activation of target genes within this pathway can lead to stimulation of lymphocyte proliferation and inhibition of cell death and apoptosis.33,34 The third hallmark gene set, the mTORC1 signaling pathway, is commonly activated during T-cell activation and has been shown to regulate cell growth and proliferation.35,36 Mutations to TSG regulating the mTOR pathway have been associated with human disease, inactivation of downstream targets leading to upregulation of vascular endothelial growth factor (VEGF) expression and promotion of tumor angiogenesis, supporting the use of mTOR as a target in cancer therapies.37–39 The roles of these gene sets in regulating lymphocyte activation, proliferation, and potentially cancer development highlight them as new targets for expression profiling to develop a more extensive activation phenotype.
Genes selected as candidates based on known association with lymphoma in human, canine, and mouse studies included p15, p18, p19, p21, p27, and p53. Activation had a marked effect on four of these genes, p18, p19, p21, and p27, resulting in a distinct pattern of gene expression in the microarray analysis in seven dogs. This may reflect the interrelated functional role of these genes in regulating cell cycle.
40
There is some clustering of these genes within the analysis. Some of these genes belong to the cyclin-dependent kinase inhibitors. Members of the INK4 family encode the genes represented by the cluster, including p15, p18, and p19. These genes are involved in the inhibition of cyclin-dependent kinases 4 and 6, which are critical for phosphorylation of the retinoblastoma protein in regulating cell cycle progression. The p21 and p53 gene expression profiles are also clustered; p21 is also a regulator of cyclin-dependent kinases and is in turn regulated by expression of p53. The other notable inclusion, p27, is encoded by the
Primers for p14, p15, p18, p19, p21, p27, and p53 showed consistent amplification of target products and will be useful for further canine studies. Amplification of p16 was not successful in this study despite repeated attempts and redesign. Primers for canine p16 have been described, based on a design within the third exon, but these do not distinguish any residual DNA in samples. 41 The results of qRT-PCR were comparable with those of microarray but across a greater dynamic range and only within the six dogs used. An exception was p53, which was downregulated substantially in stimulated samples when compared to microarray data. The microarray did not have any probes representing p14, so it could not be compared. There have been a number of developments toward specialized arrays based on a subset of genes that are significant in cancer analysis, including canine cancer.42,43
When analyzed as a group, the pattern of expression of candidate TSG discriminated the activation status of leukocytes, that is, between stimulated and unstimulated samples, within six dogs. The expression pattern, however, failed to discriminate between the remaining five dogs. Potential still exists for these genes to be used as candidates for distinguishing between a normal leukocyte activation phenotype and a pathogenic phenotype in lymphoma. Human studies have described differential patterns of expression for p14, p15, p16, p21, p27, and p53 from patients with varying forms of lymphoma.12,44–47 In addition, the CDKNs p18 and p19 have been linked to a variety of other cancers in humans but have yet to be extensively studied in the context of lymphoma.48,49 All of the candidate genes included in this study have been deleted in mice and resulted in increased susceptibility to lymphoma. 50
The results presented here suggest that TSG subsets can be used to characterize an activated leukocyte phenotype in dogs, which may provide a test set for further analysis of canine lymphoma samples. Expression patterns within TSG subsets were able to distinguish between activated and resting cells in the individuals included in the study; however, these need to be validated in a larger sampling of dogs. The ability to distinguish between a normal activation phenotype and a pathogenic phenotype associated with lymphoma development, using the candidate genes and TSG subsets identified in this study, offers the potential for use in diagnostic testing.
Author Contributions
Conceived and designed the experiments: PW, SM. Analyzed the data: JD, SM, PW. Wrote the first draft of the manuscript: JD, SM, PW. Contributed to the writing of the manuscript: JD, SM, RT, PW. Agree with manuscript results and conclusions: JD, SM, RT, PW. Jointly developed the structure and arguments for the paper: JD, SM, RT, PW. Made critical revisions and approved final version: SM, PW. All authors reviewed and approved of the final manuscript.
Footnotes
Acknowledgment
We thank the owners of dogs that consented to the study and the valuable cooperation of the Bullmastiff Club of NSW.