
Abstract
Phytoremediation refers to the use of plants for extraction and detoxification of pollutants, providing a new and powerful weapon against a polluted environment. In some plants, such as Thlaspi spp, heavy metal ATPases are involved in overall metal ion homeostasis and hyperaccumulation. P1B-ATPases pump a wide range of cations, especially heavy metals, across membranes against their electrochemical gradients. Determination of the protein characteristics of P1B-ATPases in hyperaccumulator plants provides a new opportuntity for engineering of phytoremediating plants. In this study, using diverse weighting and modeling approaches, 2644 protein characteristics of primary, secondary, and tertiary structures of P1B-ATPases in hyperaccumulator and nonhyperaccumulator plants were extracted and compared to identify differences between proteins in hyperaccumulator and nonhyperaccumulator pumps. Although the protein characteristics were variable in their weighting, tree and rule induction models; glycine count, frequency of glutamine-valine, and valine-phenylalanine count were the most important attributes highlighted by 10, five, and four models, respectively. In addition, a precise model was built to discriminate P1B-ATPases in different organisms based on their structural protein features. Moreover, reliable models for prediction of the hyperaccumulating activity of unknown P1B-ATPase pumps were developed. Uncovering important structural features of hyperaccumulator pumps in this study has provided the knowledge required for future modification and engineering of these pumps by techniques such as site-directed mutagenesis.
Introduction
Many metal ions are essential as trace elements, but at higher concentrations they become toxic. Nowadays, environmental pollution from heavy metals has raised great concern, because polluted soil is often useless for agriculture and poses a major threat to living organisms. 1 In addition, these heavy metals can enter the food chain and pose a high risk at the top of the food chain, including humans. Toxic heavy metal contamination accelerated dramatically at the start of the industrial revolution. 2 The primary causes of this pollution are burning of fossil fuels, mining and smelting of metallic ferrous ores, municipal wastes, fertilizers, pesticides, and sewage. 3 Removal of heavy metals from polluted soil is difficult, expensive, and time-consuming.
Phytoremediation has gained increasing attention as a cost-effective method for removal of heavy metals from contaminated sites. This method is a low-technological and low-cost emerging cleanup technology. 4 It has been shown that some plants have the potential to detoxify heavy metals and can survive under metal stresses. 5 High tolerance of some plants to heavy metal toxicity could rely either on reduced heavy metal uptake or increased internal sequestration, manifested by an interaction between the genotype and its environment. It is estimated that approximately 400 plant species from different families, including Asteraceae, Brassicaceae, Caryophyllaceae, Poaceae, Violaceae, and Fabaceae, can tolerate very high levels of heavy metals in the soil.6,7 The Brassicaceae family is best represented among these families, with 87 species classified as metal hyperaccumulators. 8 Hyperaccumulation in plants that are endemic to metalliferous soils refers to their ability to tolerate and accumulate metals in their above-ground tissues to very high concentrations (approximately 100 times that of nonaccumulator plant species). Accumulation of these heavy metals in plants can occur following their uptake from contaminated soil. 9 Specialized transport proteins, in the form of channels, carriers, and pumps, mediate the movement of heavy metals through membranes. 10 Recent studies have shown that plants possess several classes of metal transporters that must be involved in metal uptake and homeostasis, and thus could play a key role in tolerance. These include heavy metal transport P (CPx)-ATPases, natural resistance-associated macrophage proteins and cation diffusion facilitators, the zinc-iron permease family, and cation antiporters.11,12 Several types of heavy metal transporters have now been cloned from plants. 13
CPx-ATPases are believed to act as key heavy metal transporters, involved not only in metal ion homeostasis, but also in the overall strategy for heavy metal tolerance. 14 This superfamily includes five major branches and 10 subfamilies, according to the substrate being transported, and not according to the evolutionary status of the parental species. 15 Heavy metal ATPases, classified as Type IB ATPases, together with the closely related Type IA ATPases (which are thought to be involved in K transport), are considered to constitute a monophyletic group. 16 Type IB ATPases, which have been found in bacteria, archaea, and eukaryotes, are thought to have evolved early in the evolution process. CPx-ATPases share the common feature of a conserved intramembranous cysteine-proline-cysteine, cysteine-proline-histidine, or cysteine-proline-serine (CPx) motif which is thought to function in heavy metal transduction. 17 CPx-ATPases are characterized structurally by having a single subunit, ie, 8–12 transmembrane segments, N- and C-termini exposed to the cytoplasm, and a large central cytoplasmic domain, including phosphorylation and ATP binding sites. 18 From our point of view, dissecting a large number of functional protein trough data mining algorithms and modeling the activity of protein pumps based on their structural protein attributes provides a novel functional strategy for understanding the mechanism of phytoremediation.
Data mining problems often deal with hundreds or thousands of variables. 19 Fitting a model, such as a decision tree or itemset mining, to a set of variables this large may require more time than is practical. 20 Usually many features determine the characteristics of a protein molecule. As a result, most of the time and effort spent in the model-building process involves identifying which variables to include in the model. Various models, such as attribute weighting (or feature selection) allow the variable set to be reduced in size, creating a more manageable set of attributes for modeling. 21 A decision tree algorithm 22 predicts the value of a discrete dependent variable with a finite set from the values of a set of independent variables. A decision tree is constructed by looking for regularities in the data, determining the features to add at the next level of the tree using an entropy calculation, and then choosing the feature that minimizes entropy impurity. 23 Several well-known decision tree algorithms are available, and have been employed in modeling of protein thermostability. 24 To understand better the features that contribute to heavy metal transporters (ie, hyperaccumulators, tolerant and sensitive), it is necessary to identify the main features responsible for this valuable characteristic. Up until now, researchers have only considered a restricted number of protein characteristics in a few selected sequences of hyperaccumulator pumps. It has now become obvious that analyzing a large number of protein characteristics within all available P1-ATPase pumps can provide a comprehensive overview of the structure and function of P1-ATPase pumps during phytoremediation. To achieve this goal, recent feature selection and modeling algorithms, generally called data mining, may play a central role in uncovering data patterns.
We initially calculated a large number (n = 2644) of protein characteristics for each P1-ATPase sequence. Various clustering, screening, itemset mining, and decision tree models were then used to determine and model the most important features responsible for P1B-ATPase pump function. Considering a large number of protein features enabled us to detect key protein characteristics in the structure of hyperaccumulator heavy metal transporter pumps. The results showed that various bioinformatic and modeling tools can be exploited to identify the type and activity of heavy metal transporters, with a precision rate up to 95%. It is also reported here that feature selection or attribute weighting can be used to select the most important protein attributes of ATPase pumps, such as glycine count, and reduce the burden of processing equipments.
Methods and Materials
One hundred and sixty-eight sequences of P1B-ATPase proteins from plants, bacteria, fungi, and yeasts (able to transport Cu2+, Zn2+, Cd2+, Pb2+, Cu+1, and Ag+) were extracted from the UniProt knowledge (Swiss-Prot and TrEMBL) databases and categorized as hyperaccumulators, tolerant and sensitive, to heavy metals (Appendix 1). A total of 2643 protein characteristics, including length, weight, isoelectric point, count, and frequency of each element (C, N, S, O, and H), count and frequency of each amino acid, count and frequency of negatively and positively charged ions, hydrophilic and hydrophobic residues, count and frequency of dipeptides, number of α-helices and β-strands and other secondary protein features, and bond angle, bond length, dihedral angle, and other tertiary protein features were extracted. These features were classified as either continuous or categorical variables. Subsequently, one dataset of protein features was imported into Clementine software (Clementine_NLV-11.1.0.95, Integral Solutions Ltd, Chicago, USA). Null data for types of metal transporters and organisms were discarded, and each time one of them was set as the output variable and the other variables were set as input variables. The same dataset was also imported into RapidMiner software (RapidMiner 5.0.001, Rapid-I GmbH, Dortmund, Germany) and the type of metal transporter (categorized as hyperaccumulator or tolerant) was set as a target or label attribute. When the itemset mining model was used, no label or target attribute was set as required by this model.
To identify the most important characteristics of heavy metal transporters, we used various screening models (anomaly detection model, feature selection algorithm, or attribute weighting), clustering models [K-means and two-step cluster], tree induction models (with various criteria, C5.0 with 10-fold cross-validation and classification and regression trees), itemset mining (FP-growth) and rule induction model (10-fold cross-validation through stratified sampling), as described by Ebrahimi et al. 12 Whenever requested by a model, data were discretized by frequency, ie, data were divided into three bins (ranges) with nearly equal frequencies in each class (low 0–0.3, mid 0.3–0.5, and high >0.5). Sometimes data were converted to nominal datasets and, in some cases, to binominal datasets.
Results
The average length, weight, isoelectric point, and aliphatic indices of the proteins were 322.4 ± 209.9, 36.2 ± 24.9, 7.2.4 ± 1.7, and 97.9 ± 15.2 (mean ± standard deviation [SD]), respectively. The average counts of S, C, N, O, and H were 11.01, 201.86, 368.57, 383.65, and 89.55, respectively, and the average counts of hydrophobic, hydrophilic, and other residues were 217.1, 137.2, and 102.3, respectively. The frequencies of H, C, O, N, and S in all enzymes were 0.504 ± 0.006, 0.316 ± 0.006, 0.092 ± 0.005, 0.86 ± 0.005, and 0.002 ± 0.001, respectively, and the frequencies of hydrophobic, hydrophilic, and negatively and positively charged residues were 0.521 ± 0.067, 0.217 ± 0.45, 0.263 ± 0.065, 3.83 ± 14.25, and 3.38 ± 12.02, respectively. The frequencies of amino acids ranged from low (0.01 ± 0.001 for cysteine) to high (0.102 ± 0.031 for leucine).
In 97.89% of proteins, the N-terminal amino acid was methionine, and in 0.85%, 0.48%, 0.31%, and 0.17% of proteins, the same position was occupied by alanine, serine, threonine, and proline, respectively. In only 0.07% of proteins, the last amino acid was isoleucine, glycine, or aspartic acid, and, in 0.03%, the N-terminal amino acid was occupied by lysine, cysteine, or arginine. The average nonreduced cysteine extinction coefficient at 280 nm was 60.51, the nonreduced cysteine absorption was 0.91, the reduced cysteine extinction coefficient was 39.07, and the reduced cysteine absorption was 0.90.
Attribute Weighting
As a requirement for various weighting models, as expected, data were normalized and all weights were 0–1. The comparison between different weighting algorithms for the type and number of selected attributes in the formation of hyperaccumulator P1-ATPase pumps is shown in Table 1. Testing different weighting algorithms provided the opportunity for robust attribute selection.
Identifying the most important protein features in discrimination of hyperaccumulator pumps from nonhyperaccumulators by different weighting algorithms (value nearer to 1 shows higher effectiveness of attribute in generating hyperaccumulator pump).
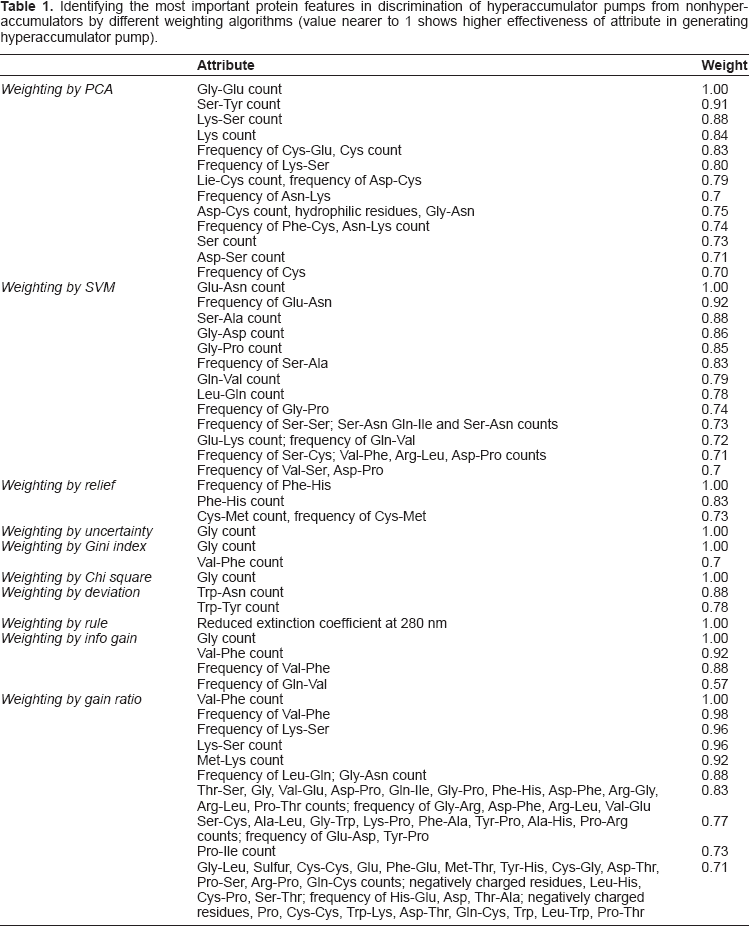
Weighting by Principal Component Analysis
More than 18 attributes were shown to have weights $0.70. The glycine-glutamine count had the highest weight (Table 1).
Weighting by Support Vector Machine Model
When the support vector machine model was applied, 22 attributes had weights $0.70, for which the glutamine-asparagine count showed the highest weight (Table 1).
Weighting by Relief
As presented in Table 1, when this model was applied to the dataset, just four attributes showed a weight >0.70.
Weighting by Uncertainty
Using this method, the glycine count was the sole attribute, with a weight of 1. The other attributes had weights <0.70 (Table 1).
Weighting by Gini Index
In the Gini index model, which is similar to uncertainty weighting algorithms, the glycine count had a weight of 1.0 and the valine-phenylalanine count had a weight of 0.70. The other attributes showed weights lower than 0.70 (Table 1).
Weighting by Chi-Square
Only one attribute (glycine count) had a weight >0.70. No other attribute gained weights >0.70 (Table 1).
Weighting by Deviation
Tryptophan-asparagine and tryptophan-tyrosine counts showed weights >0.70 (0.88 and 0.78, respectively, see Table 1).
Weighting by Rule
A reduced extinction coefficient at 280 nm with a weight of 1.0 was the sole attribute with weight >0.70 (Table 1).
Weighting by Gain Ratio
When this model was applied, 61 attributes showed a weight >0.70. The highest weight (1.0) was for the valine-phenylalanine count (see Table 1).
Weighting by Information Gain
Glycine count, valine-phenylalanine count, frequency of valine-phenylalanine, and frequency of glutamine-valine (values of 1.0, 0.92, 0.88, and 0.57, respectively) were the four most important attributes (Table 1).
Itemset Mining
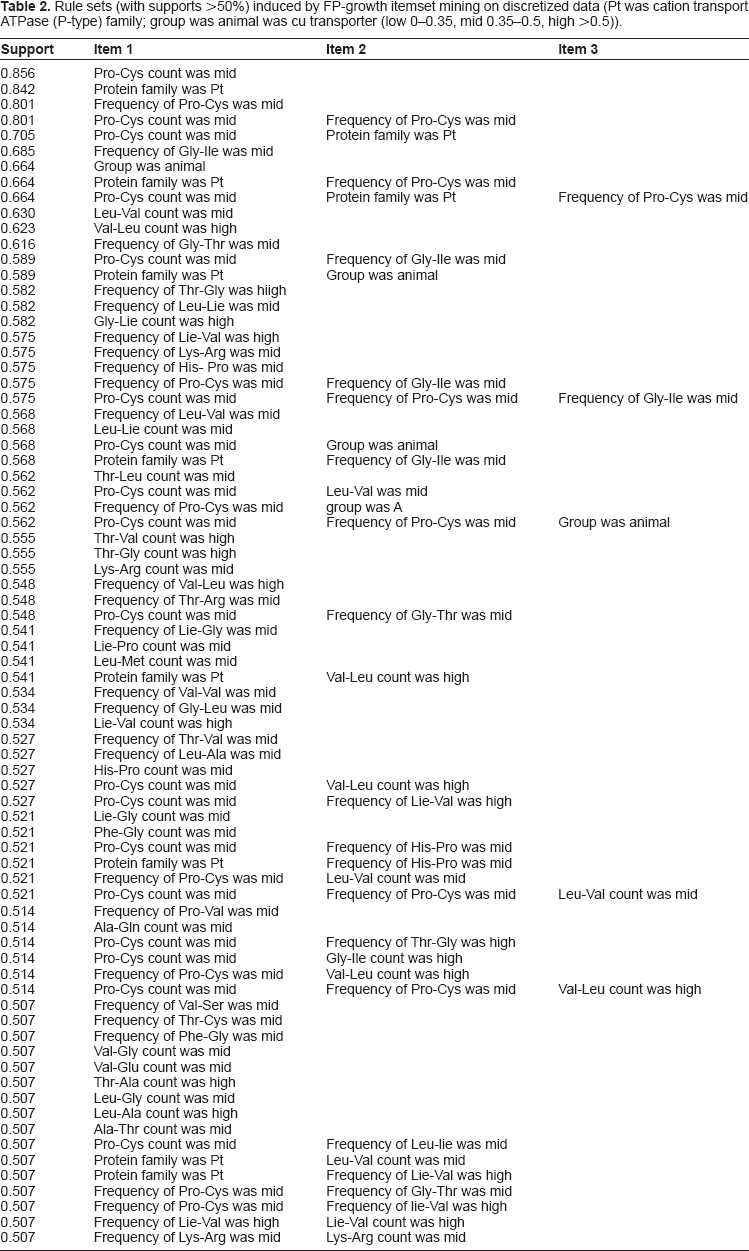
When FP-growth was run on all attributes, more than 6000 rules were created. Support of the rules went up to 99% for the frequency of methionine-lysine when it was low (<0.3). When the frequencies of tryptophan-glutamine and histidine-methionine, the histidine-methionine and cysteine-histidine counts, the frequencies of tryptophan-asparagine, tryptophancysteine, and arginine-cysteine, and the tryptophancysteine and histidine-glutamine counts were <0.3, their supports were 0.97–0.98. When the frequencies of methionine-lysine, tryptophan-glutamine, or histidine-methionine were low, the support reached 97%, but when the frequencies of methionine-lysine, tryptophan-glutamine, and histidine-methionine, as well as the histidine-methionine count were low, the support decreased to 95%.
In all FP-growth rules generated, the values of some attributes were low because the low value attributes dominated the dataset. Therefore, FP-growth was run with selected attribute properties, excluding low value attributes, and taking into account the attributes with mid and high values. The model created 96 rules (52 rules with one item, 36 rules with two times and eight rules with three items) with support in the 50%–85% range. The proline-cysteine count with mid values (0.30–0.50) gained the highest support (85%). When the protein transporter family was P1B-ATPase, the support was 84%. In the case of a mid count for proline-cysteine and the P1B-ATPase protein family, the support was 80%, but when the protein family was P1B-ATPase and the valine-leucine count was high (.0.50), the support decreased to 50%.
Tree Induction
Decision Tree
Data were discretized, as mentioned earlier. Ten-fold validation with stratified sampling was used to build the tree and the average performances were calculated. The models were run with a minimal size of four for a node to allow a split, a minimal size of two for all leaves. TA minimal gain of 0.1 to produce a split, a maximal tree depth of 20, a confidence level of 0.25 for the pessimistic error calculation of pruning and the number of alternative nodes of 3 when pre-pruning would prevent a split. Four different criteria were used to induce the decision trees as follows:
Gain Ratio
This model generated a decision tree with a depth of 8 and a total accuracy of 72.75% ± 6.25% (82.43% for tolerant and 62.50% for hyperaccumulator transporters), and a precision of 86.34% ± 12.23%. The most important feature used to build this tree was the frequency of glutamine-valine. If the value of this feature was >0.5 or this value was 0.3–0.5 and the tryptophan-histidine count was low, or if the value for the frequency of glutamine-valine was low (<0.3) and the frequency of cysteine-glycine was high, the heavy metal transporter fell into the tolerant category. Otherwise, if the count for this feature was high and the alanine-histidine count was low, the metal transporter fell into the hyperaccumulator group. However, if the value for the frequency of cysteine-glycine was mid, the heavy metal transporter fell into the hyperaccumulator group. If the value for this feature was low and the frequency of lysine-glycine was mid, the protein was in the tolerant group; otherwise it belonged to the hyperaccumulator group (Fig. 1).

Tree induced by decision tree algorithm on discretized data with gain ratio criterion.
Information Gain
In this model, a tree with a depth of 5, an accuracy of 72.24% ± 10.66%, and a precision of 78.55% ± 11.21 was created. The main feature used to build the tree was the glycine count; if the value was <0.445, the frequency of phenylalanine-arginine was high, and the alanine-asparagine count was high, the transporter fell into the tolerant group, but if the value of this attribute was low or mid, the heavy metal transporter belonged to the hyperaccumulator group. If the glycine count was 0.445–0.565, the asparagine-aspartic acid frequency was high, and alanine-lysine count was high, the protein fell into the tolerant group, otherwise it fell into the hyperaccumulator group. While the frequency of asparagine-aspartic acid was high and the valine-tyrosine and alanine-aspartic acid counts were high, the protein fell into the hyperaccumulator group, otherwise into the tolerant group. Finally, when the glycine count was >0.565 and the methionine-serine and serine-leucine counts were high, the transporter fell into the hyperaccumulator group; otherwise it fell into the tolerant group.
Gini Index
The depth of the decision tree created using this criterion was just 3, with 69.57% ± 10.32% accuracy and 72.93% ± 13.39% precision. The cysteine-histidine count was used as the main feature to create the tree branches. If the value of this attribute was high, the metal transporter fit into the hyperaccumulator group. If it was low and the cysteine-histidine count was high, the protein was allocated to the tolerant category. However, if the value for the last attribute was low and the cysteine-aspartic acid count was high, the protein fell into the hyperaccumulator group. If the cysteine-histidine count was low, the cysteine-isoleucine count was mid, and the alanine-glycine and alanine-aspartic acid counts were high, the transporter belonged to the hyperaccumulator group; Otherwise, if the value for the alanine-aspartic acid count was mid, the protein belonged to the tolerant group.
Accuracy
By applying an accuracy criterion, a tree with a depth of 15, an accuracy of 56.86% ± 12.11%, and a precision of 70.95% ± 17.63% was generated. If the cysteine-histidine count was high, the protein fell into the tolerant category, but if the value for this was low and the counts for glutamic acid-histidine, histidine-cysteine, histidine-aspartic acid, cysteine-cysteine, cysteine-aspartic acid, cysteine-glycine, alanine-cysteine, alanine-glutamic acid, and alanine-alanine were low and the alanine-aspartic acid count was high, the transporter belonged to the tolerant group but, with the same order of attributes; if the alanine-aspartic acid count was high, it belonged to the hyperaccumulator group.
ID3 Discretized Data
Data were discretized as mentioned earlier, and a 10-fold validation with stratified sampling was used to build the tree, and the average performances were calculated. The models run with a minimal size of four for a node to allow a split, a minimal size of two for all leaves, a minimal gain of 0.1 to produce a split, a maximal tree depth of 20, a confidence level of 0.25 for the pessimistic error calculation of pruning and the number of alternative nodes of three when prepruning would prevent a split. Four different criteria were used to induce the decision trees as follows:
Gain Ratio
This model generated a decision tree with a depth of 16, a total accuracy of 74.00% ± 9.73%, and a precision of 86.62% ± 10.67%. The most important feature used to build the tree was the frequency of glutamine-valine. If the value of this feature was high and the proline-glutamine count was either high or mid, the heavy metal transporter fell into the hyperaccumulator category, otherwise it fell into the tolerant group. If the frequency of glutamine-valine was low, the frequency of cysteine-glycine was high, and the alanine-phenylalanine count was low, the transporter belonged to the tolerant group; otherwise if the value for alanine-phenylalanine was mid, it belonged to the hyperaccumulator group. If the frequency of glutamine-valine was mid, the glycine-proline count was low, and the arginine-tyrosine count was high, the protein fell into the hyperaccumulator group, but if the arginine-tyrosine count was low, the tryptophan-arginine count was high, and the alanine-glutamic acid count was low, the transporter belonged to the tolerant category, and otherwise belonged to the hyperaccumulator category.
Information Gain
In this model, a complex tree with a depth of 3, an accuracy of 80.86% ± 9.94%, and a precision of 89.74% ± 10.23% was created. The main feature to build the tree was the type of organism. If the organism was Anabaena, Penicillium, Podospora, Rizobium, or Thlapsi, the transporter fell into a hyperaccumulator group, but when the organism was Bacillus, Bdellovibrio, Brassica, Cryptococcus, Debaerymomyces, Enterococcus, Kluyveromyces, Leptopspira, Listeria, Lodderomyces, Neisseria, Neosartorya, Neurospora, Oscillatoria, Postia, Ralstonia, Schizosacharomyces, Triticum, Ustilago, Salmonella, or Zea, the metal transporter belonged to the tolerant group.
If the organism was Arabidopsis and the aspartic acid-glutamic acid count was high or low, the protein fitted into the tolerant group, otherwise it fell into the hyperaccumulator group. If the organism was Aspergillus and the histidine-valine count was high or mid, the heavy metal transporter belonged to the hyperaccumulator category; if not, it belonged to the tolerant category. If the organism was Candida and the aspartic acid-methionine count was either high or low, the transporter belonged to the tolerant group, otherwise to the hyperaccumulator category. However, if the organism was Oryza and the asparagine-tryptophan count with low, the protein fit into the tolerant group; if not, it fitted into the hyperaccumulator group. If the organism was Pichia and the glutamic acid-aspartic acid count was either low or mid, the protein fell into the hyperaccumulator group, otherwise into the tolerant group. If the organism was Pseudomonas and the alanine-methionine count was high, the heavy metal transporter belonged to the tolerant category; if the value was mid, the category was hyperaccumulator. If the organism was Saccharomyces, a glutamine-arginine count with a high or low value denoted that the transporter fell into the tolerant group. When the organism was Sorghum and the alanine-alanine count was low, the transporter fitted into the tolerant group, but if the value was mid, it belonged to the hyperaccumulator group. Finally, if the organism was Staphylococcus and the alanine-alanine count was either high or low, the protein fell into the tolerant category, and if not, it fell into the hyperaccumulator category.
Gini Index
The depth of the decision tree created using this criterion was over 200, with an accuracy of 69.57% ± 10.32% and a precision of 72.93% ± 13.39%. The cysteine-histidine count was used as the main feature to create the tree branches, but the tree was too complicated to be able to draw meaningful rules.
Accuracy
Applying an accuracy criterion also generated a decision tree with a depth of more than 200, an accuracy of 65.10% ± 8.90%, and a precision of 84.57% ± 11.24%. The cysteine-histidine count was used to create the main tree branches, but again the tree was so complicated that no rules could be extracted.
Decision Tree (Numerical Data)
No discretization was applied on the data, but stratified sampling was used to build the tree and the average performances were calculated. The models were run with the minimal size of 4 for a node to allow a split, a minimal size of 2 for all leaves, a minimal gain of 0.1 to produce a split, a maximal tree depth of 20, and a confidence level of 0.25 for the pessimistic error calculation of pruning and the number of alternative nodes of 3 when prepruning would prevent a split. Four different criteria were used to induce the decision trees as follows:
Gain Ratio
This model generated a decision tree with a depth of 8, an accuracy of 80.10% ± 10.34%, and a precision of 91.89% ± 10.81%. The most important feature used to build the tree was the valine-phenylalanine count: if the value was <0.115, the protein belonged to the tolerant group; if the valine was >0.115, the valine-valine count was >0.205, and the frequency of histidine-glutamic acid was >0.208, the transporter fell into the tolerant group. However, if the value was ≤0.208, the asparagine-threonine and valine-proline counts were ≤0.648 and ≤0.812, respectively, the frequency of proline-glutamic acid was ≤0.500, the frequency of leucine-threonine was >0.125, the glycine-lysine count was ≤0.909, and the frequency of methionine-valine was ≤0.833, the metal transporter belonged to the hyperaccumulator group, otherwise it fitted into the tolerant group.
Information Gain
In this model, a tree with a depth of 6, an accuracy of 81.38% ± 8.93%, and a precision of 86.84% ± 9.56% was created. The main feature used to build the tree was the glycine count. If its value was > 0.505 and the frequency of histidine-serine was >0.192, the metal transporter fell into the tolerant category. If the frequency of histidine-serine was ≤0.192, the frequency of glycine-phenylalanine was >0.318, and the lysine-valine count was ≤0.227, the protein fell into the hyperaccumulator group, otherwise it belonged to the tolerant group. If the frequency of glycine-phenylalanine was ≤0.318 and the weight of protein was >0.896 and the glutamine-leucine count was > 0.375, the protein fit into the hyperaccumulator group; if not it fitted into the tolerant group. If the glycine count was ≤0.50, the frequency of phenylalanine-arginine was > 0.500, and the glutamine-glutamic acid count was >0.250, the transporter fell into the tolerant category; otherwise if the glutamine-glutamic acid count was ≤0.250 and the alanine-phenylalanine count was ≤0.500, the protein belonged to the hyperaccumulator category. Finally, if the frequency of phenylalanine-arginine was ≤0.500 and the proline-arginine count was >0.583, it fitted into the hyperaccumulator group, and if the proline-arginine count was ≤0.583, it fell into the tolerant group.
Gini Index
The depth of decision tree created with this criterion was 6, with an accuracy of 73.05 ± 8.60 and a precision of 78.58% ± 11.65%. If the glycine count was >0.505, the group was “animal”, the organism was “fungus”, the protein family was Postia, the serine-tyrosine count was >0.100, and the aspartic acid-valine count was >0.409, the transporter fit into the hyperaccumulator group, otherwise it fitted into the tolerant group. If the organism was a plant and the isoleucine-asparagine count was >0.206, it fell into the tolerant group; if not, it fitted into the hyperaccumulator group. If the organism was yeast, the protein family was Postia, and the asparagine-asparagine count was >0.083, the transporter was in the tolerant group, and if not, it was in the hyperaccumulator group. If the group was “bacteria”, the histidine-serine count was >0.250, the transporter was in the tolerant group, otherwise it fitted into the hyperaccumulator group. If the glycine count was <0.505 and the alanine-leucine count was > 0.833, the protein fell into the hyperaccumulator group. If the proline-arginine count was ≤0.583 and the tryptophan-histidine count was >0.750, the heavy metal transporter was from the hyperaccumulator group.
Accuracy
For a tree with a depth of 5, an accuracy of 74.62% ± 9.21% and a precision of 81.13% ± 5.66% were generated. The type of organism was the main feature used to build the tree. If the organism was a bacterium and the alanine-leucine count was >0.810, the transporter was from the hyperaccumulator group, otherwise it was from the tolerant group. If the organism was a fungus, the group was animal, and the asparagine count was > 0.307, the protein fell into the tolerant group; otherwise, if the count was ≤0.250, it belonged to the tolerant group. If the organism was yeast, the group was animal, the protein family was Postia, and the aspartic acid-phenylalanine count was >0.917, the protein belonged to the hyperaccumulator group; if not, it belonged to the tolerant group.
ID3 (Numerical Data)
No discretization was applied to the data, and stratified sampling was used to build the tree, with average performances calculated. For models run with a minimal size of 4 for a node to allow a split, a minimal size of 2 for all leaves, a minimal gain of 0.1 to produce a split, and a maximal tree depth of 20, the confidence level of 0.25 for the pessimistic error calculation of pruning and the number of alternative nodes of 3 when prepruning would prevent a split. The criteria used to induce the decision trees were as follows:
Gain Ratio Criterion
This model generated a decision tree with a depth of 13, an accuracy of 82.14% ± 9.69%, and a precision of 90.54% ± 6.84%. The most important feature of this tree was the frequency of glutamine-valine. If the value was >0.312 and the glutamic acid-glycine count was >0.636, the heavy metal transporter fell into the hyperaccumulator category, otherwise it fell into the tolerant group. If the frequency of glutamine-valine was ≤0.312, the frequency of isoleucine-isoleucine was >0.036, and the glutamic acid-asparagine count was >0.643, the transporter belonged to the tolerant group, Otherwise, if the value for glutamic acid-asparagine was ≤0.643 and the valine-phenylalanine count was >0.115, the alanine-methionine count was ≤0.611, and the frequency of glutamic acid-histidine was >0.318, the protein fell into the tolerant group. If the frequency of glutamine-valine was mid, the glycine-proline count was low, and the arginine-tyrosine count was high, the protein fell into the hyperaccumulator group. If the arginine-tyrosine count was low, the tryptophan-arginine count was high, and the alanine-glutamic acid count was low, the transporter belonged to the tolerant category, otherwise it belonged to the hyperaccumulator category.
Information Gain
In this model, a tree with a depth of 2 and a complex character at the second level, ie, an accuracy of 80.10% ± 9.51% and a precision of 88.38% ± 8.0% were created. The main feature used to build this tree was the type of organism. If the organism was Anabaena, Brassica, Helicobacter, Listeria, Penicillium, Podospora, Rhizobium, or Thlapsi, the transporter fell into the hyperaccumulator group, but if the organism was Bacillus, Bdellovibrio, Brassica, Cryptococcus, Debaerymomyces, Enterococcus, Kluyveromyces, Leptopspira, Listeria, Lodderomyces, Neisseria, Neosartorya, Neurospora, Oscillatoria, Postia, Ralstonia, Schizosacharomyces, Triticum, Ustilago, Salmonella, or Zea, the metal transporter belonged to the tolerant group.
If the organism was Arabidopsis and the glutamic acid-phenylalanine count was >0.417, the protein fit into the hyperaccumulator group, otherwise into the tolerant group. If the organism was Aspergillus and the histidine-valine count was >0.375, the heavy metal transporter belonged to the hyperaccumulator category; if not, it belonged to the tolerant category. If the organism was Candida and the phenylalanine-valine count was >0.409, the transporter belonged to the hyperaccumulator group, otherwise to the tolerant category. However, if the organism was Oryza and the phenylalanine-valine count was >0.136, the protein fit into the hyperaccumulator group; if not it fitted into tolerant group. If the organism was Pichia and the alanine-methionine count was >0.389, the protein fell into hyperaccumulator group, otherwise into the tolerant group. If the organism was Pseudomonas and the alanine-glutamic acid count was >0.382, the heavy metal transporter belonged to hyperaccumulator category; if the value was ≤0.382, the category was tolerant. The phenylalanine-isoleucine count with a value >0.167 denoted that transporter fell into the tolerant group, if the organism was Saccharomyces. When the organism was Sorghum and the alanine-alanine count was >0.318, the transporter fitted into the hyperaccumulator group, but if the value was lower than that, it belonged to the tolerant group. Finally, if the organism was Staphylococcus and the alanine-glutamic acid count was >0.412, the protein fell into the hyperaccumulator category, and if not, into the tolerant category.
Gini Index
The depth of the decision tree was 5, with 82.24% ± 7.52% accuracy and 90.32% ± 7.49% precision. The type of organism was used as the main feature to create the tree branches. When it was Anabaena, Brassica, Helicobacter, Penicillium, Podospora, Rhizobium, or Thlaspi, the metal transporter belonged to the hyperaccumulator group, but when the organism was Bacillus, Bdellovoibrio, Cryptococcus, Debaryomyces, Enterococcus, Kluyveromyces, Leptospira, Listeria, Lodderomyces, Nisseria, Neosartorya, Neurospora, Oscillatoria, Postia, Ralstonia, Salmonella, Schizosaccharomyces, Triticum, Ustilago, or Zea, it belonged to the tolerant group.
If the organism was Arabidopsis and the group was animal, the protein fitted into the tolerant group; otherwise, if the group was bacteria and the cysteine-histidine count was ≤0.150, the metal transporter belonged to the hyperaccumulator group. If the organism was Aspergillus the organism was fungus, the group was animal, and the histidine-valine count was >0.375, the protein fell into the hyperaccumulator group; if not, it fell into the tolerant category. If the organism was Candida, the group was animal, the protein family was Postia, and the phenylalanine-valine count was >0.409, the transporter belonged to the hyperaccumulator group, otherwise to the tolerant category. If the organism was Oryza and the group was animal, the transporter fell into in the hyperaccumulator category; if the group was either bacteria or animal, it belonged to the tolerant group. If the organism was Pichia, the group was animal, the protein family was Postia, and the alanine-methionine count was >0.389, the protein fell into the hyperaccumulator group, otherwise into the tolerant group. If the organism was Pseudomonas, the group was bacteria, the protein family was Postia, and the alanine-alanine count was >0.576, the heavy metal transporter belonged to the tolerant category. If the value was ≤0.576, the category was the hyperaccumulator group. If the group was animal and the organism was Saccharomyces, the protein fell into the tolerant group, otherwise into the hyperaccumulator group. When the organism was Sorghum, the protein family was Postia, and the alanine-alanine count was >0.318, the transporter fitted into the hyperaccumulator group, but if the value was lower than that, it belonged to the tolerant group. Finally, if the organism was Staphylococcus, the group was animal, the protein was of the Type IB subfamily, and the alanine-alanine count was >0.273, the protein fell into the hyperaccumulator category; if not into the tolerant category.
Accuracy
Applying an accuracy criterion also generated a decision tree with a depth of >5, an accuracy of 80.29% ± 9.94% and a precision of 90.97% ± 8.02%. The main feature used to build this tree was the type of organism. If the organism was Anabaena, Brassica, Helicobacter, Listeria, Penicillium, Podospora, Rhizobium, or Thlapsi, the transporter fell into the hyperaccumulator group, but if the organism was Bacillus, Bdellovibrio, Cryptococcus, Debaerymomyces, Enterococcus, Kluyveromyces, Leptopspira, Listeria, Lodderomyces, Neisseria, Neosartorya, Neurospora, Oscillatoria, Postia, Ralstonia, Schizosacharomyces, Triticum, Ustilago, Salmonella, or Zea, the metal transporter belonged to the tolerant group.
If the organism was Arabidopsis and the group was animal, the protein fitted into the tolerant group; otherwise, if the group was bacteria and the alanine-lysine count was ≤0.850, it fell into the hyperaccumulator group. If the organism was Aspergillus, the group was animal, the protein family was Postia, and the histidine-valine count was <0.375, it belonged to the hyperaccumulator group; if not, it belonged to the tolerant category. If the organism was Candida, the group was animal, and the phenylalanine-valine count was >0.409, the transporter belonged to the hyperaccumulator group, otherwise to the tolerant category. However, if the organism was Oryza and the group was animal, the protein fitted into the hyperaccumulator group; if the group was bacteria or animal, it fitted into the tolerant group. If the organism was Pichia, the protein family was Postia, and the count of alanine-arginine was >0.125, the protein fell into the tolerant group, otherwise into the hyperaccumulator group. If the organism was Pseudomonas, the protein family was Postia, and the alanine-alanine count was >0.576, the heavy metal transporter belonged to the tolerant category; if the value was <0.576, the category was the hyperaccumulator group. If the group was animal and the organism was Saccharomyces, the transporter fell into the tolerant group. When the organism was Sorghum, the alanine-alanine count was >0.318, and the protein family was Postia, the transporter fit into the hyperaccumulator group, but if the value was lower than that, it belonged to the tolerant group. Finally, if the organism was Staphylococcus, the alanine-glutamic acid count was >0.273, and the protein family was type IB subfamily, the protein fell into the hyperaccumulator category, and if not, into the tolerant category.
Classification and Regression Tree
When the classification and regression tree node was run on numerical data, a tree with a depth of 5 was created, and the most important feature used to build this tree was the frequency of glutamine (value ≤0.028 for tolerant and >0.028 for false). The frequency of other charged residues was used to create the second level for both subgroups (0.822 for tolerant and 0.732 for false). The same results were obtained when feature selection was used.
Rule Induction
The model was executed on discretized and nondiscretized (numerical) data with two criteria, ie, information gain and accuracy.
Discretized Data
Information Gain
This model generated six rules, with an accuracy of 66.62% ± 10.24% and a precision of 69.24% ± 9.35%. If the glycine count was <0.445, the transporter fell into the tolerant group. If the leucine-leucine count was high and the frequency of valine-proline was mid, then the group was hyperaccumulator. If the arginine-alanine count was mid and the glutamic acid-tyrosine count was mid, then the group was tolerant. If the valine-tyrosine count was low and the threonine-glutamic acid count was mid, then the protein belonged to the tolerant group, otherwise to the hyperaccumulator group.
Accuracy
This model generated 15 rules, with an accuracy of 61.33% ± 14.26% and a precision of 72.98% ± 14.64%, respectively. The rules showed that if the frequency of leucine-arginine was high, cysteine-glycine was mid, glycine-glutamic acid was mid, leucine-leucine was low, and arginine-valine was low, then the protein belonged to the tolerant group. If the glutamic acid-methionine, glutamine-histidine, and histidineleucine counts were high, then the protein again belonged to the tolerant group. If the frequency of cysteine-glycine was mid, and the phenylalanineglutamic acid, methionine-arginine, alanine-glutamic acid, and phenylalanine-histidine counts were high, the tryptophan-phenylalanine count was mid, and the frequency of arginine-valine was low, then the heavy metal transporter fitted into the hyperaccumulator group.
Numerical Data
Information Gain
When information gain was run on numerical data, a model with six rules, an accuracy of 70.67% ± 8.27%, and a precision of 77.18% ± 9.24% was created. If the glycine count was ≤0.505, the protein fell into the tolerant group. When the hydrophobic residue count was ≤0.808 and the arginine-leucine count was >0.375, the protein was in the hyperaccumulator group. If the leucine count was ≤0.752 and the frequency of aspartic acid was ≤0.603, then the protein was from the tolerant category. If the asparagine-asparagine count was ≤0.803 or the asparagine-cysteine count was ≤0.417, the transporter protein belonged to the hyperaccumulator group. Finally, if the leucine-threonine count was >0.500, the transporter fitted into the tolerant group.
Accuracy
This model generated nine rules with 71.29% ± 11.52% and 79.31% ± 13.25% for accuracy and precision, respectively. The rules showed if the valine-phenylalanine count was ≤0.115, the lysine-glutamic acid count was >0.393, the valine-valine count was ≤0.205, and the frequency of histidine-serine was >0.192, the transporter protein fell into the tolerant group. In contrast, when the lysine-lysine count was >0.441, the leucine-histidine was >0.750, the frequency of lysine-valine was >0.417 or was >0.312 for glycine-proline, the transporter belonged to the hyperaccumulator category.
Generalized Rule Induction
Generalized rule induction node analysis created 100 rules for 2947 valid transactions, with minimum and maximum support of 15.82% and 27.12%, respectively. Maximum confidence reached 97.42% and minimum confidence decreased to 85.86%. When feature selection was used, minimum support, maximum support, maximum confidence, and minimum confidence changed to 15.17%, 27.12%, 97.42%, and 84.81%, respectively. The highest confidence (97.42%) for both methods (with/without feature selection filtering) occurred when the frequency of glutamine was lower than 0.028, the valine count was >14.5, and the frequency of glutamic acid was greater than 0.086 (Table 3).
Rule sets (with supports >50%) induced by FP-growth itemset mining on discretized data (Pt was cation transport ATPase (P-type) family; group was animal was cu transporter (low 0–0.35, mid 0.35–0.5, high >0.5)).
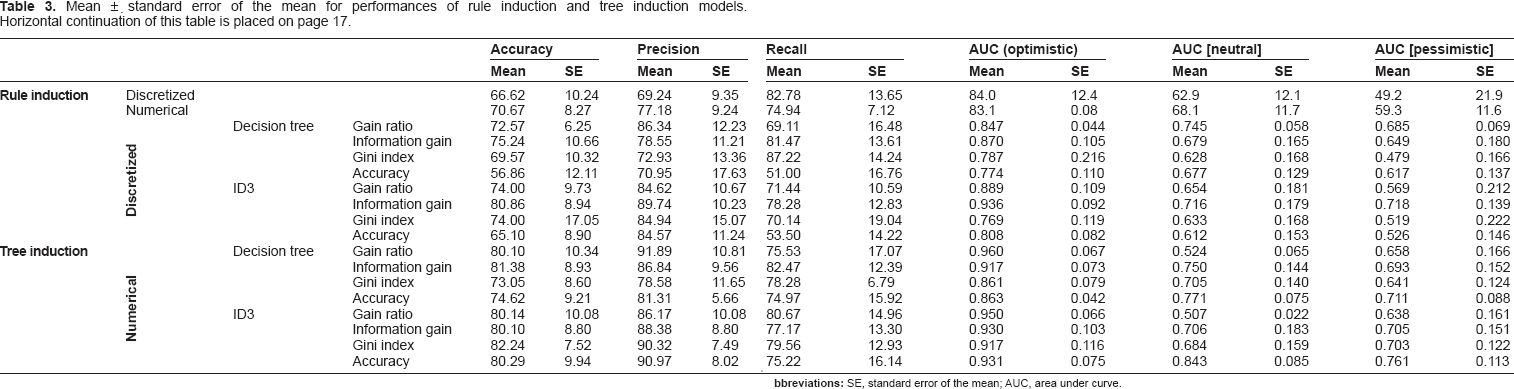
Mean ±. standard error of the mean for performances of rule induction and tree induction models. Horizontal continuation of this table is placed on page 17.
Screening Models
Anomaly Detection Model
When the anomaly detection model was used, the records were divided into two peer groups, with an anomaly index cutoff of 1.760. In the first peer group of 173 records, only one record was found to be anomalous. In peer groups 2, there were 21 records with none being anomalous. The highest anomaly index was 67598.5 ± 27670.5 (for the sulfur count) followed by 6451.1 ± 2077.1 for the hydrogen count.
Clustering Models
K-means
In this clustering model, more than 76% of the records (n = 148) were put into the first cluster and four, 15, one, and 26 records were put into the second, third, fourth, and fifth clusters, respectively, with the starting iteration of 9.42. When the K-means model was applied on the dataset with feature selection filtering, again five clusters (with starting iteration of 6.44) were generated, with 173, 13, five, two, and one records in each cluster, respectively.
Two-Step Cluster
This method clustered records into two groups, with 81 and seven records in each. Only two clusters (with 85 and nine records in each) were created for the dataset filtered using feature selection criteria. Mean ± standard error of the mean for performances of rule induction and tree induction models are presented in Table 2.
Discussion
Metal cation homeostasis is essential for plant nutrition and tolerance to toxic heavy metals. 25 As a result, heavy metal transport is a very exciting and developing field in plant biology. Although there is no direct evidence for the role of plasma membrane efflux transporters in heavy metal tolerance in plants, recent research shows that plants possess several classes of metal transporters that must be involved in metal uptake and homeostasis in general, probably playing a key role in tolerance.26–28 These include CPx-ATPases, that are involved in overall metal ion homeostasis and tolerance in plants, the natural resistance-associated macrophage protein family of proteins and cation diffusion facilitator family proteins, 29 and the zinc-iron permease family. 30 It is obvious that many plant metal transporters remain to be identified at the molecular level. Type 1B heavy metal-transporting P-type ATPases have been identified in prokaryotes and eukaryotes, including yeasts, insects, plants, and mammals. 31 In prokaryotes, the metal substrates of these transporters include Cu, Zn, Cd, Ag, Pb, and Co ions, and, in most cases, individual transporters confer tolerance to the metal ion substrate by acting as an efflux pump.32,33 However, some types of 1B-ATPases in bacteria appear to be involved in metal uptake and homeostasis.34,35
P1B-type CPx-ATPases are transmembrane metal-transporting proteins which play a major role in metal homeostasis. 34 Despite their importance, very little is known about their functions in plants. P1B-type CPx-ATPases have been implicated in the transport of a range of essential, as well as potentially toxic, metals across cell membranes.36,37 Emergency mechanisms, such as reduced uptake, facilitated efflux, sequestration, and modification, are commonly utilized by organisms to achieve resistance to the toxicity of heavy metals. It has been suggested that CPx-ATPases act as a potential key heavy metal transporter involving not only metal ion homeostasis but also the overall strategy for heavy metal tolerance. 38 Bioinformatics analysis of P-type ATPases in eukaryotic genomes extended the organismal distributions of the previously recognized families (families 1–9) to 13 new families (families 10–22), and three novel topological types of P-type ATPases have been reported. 39 Another study suggested that conformational changes in the catalytic cycle of these pumps imply secondary-structure rearrangements of small hinge regions impacting on large domain reorganizations. 40 Modeling was used to find similar structures between P-type ATPases, indicating an extended C-terminal region in some pumps, which are involved in enzyme regulation. 41
Data mining tools can be used for data analysis and can efficiently uncover important data patterns, contributing greatly to business strategies, knowledge bases, and scientific research. To date, various methods have been employed to study the metal transporters in plants (see Introduction). Here we applied different modeling techniques (screening, clustering, itemset mining, and decision trees) to study more than 2000 features of 168 transporters, in an attempt to determine the main protein features that contribute to the ability of transporters to relocate heavy metals.
Although the number of attributes with weights $0.70 varied from 1 (in Chi-square and uncertainty weighting) to 62 (in gain ratio weighting), the glycine count was chosen by 10 models (five attribute weighting, tree rule induction, and two rule induction) as one of the most important attributes. The residues forming the nucleotide-binding site in Ca2+ and Na+/K+-ATPases are conserved in most P-type ATPases, and there are two motifs specified only to members of this subfamily. Both of these are located in the N domain. The HP motif is present in 34–43 residues from phosphorylatable aspartate, and a protein kinase-like GxGxxG/A motif is found downstream in the same domain.
As shown in the Results section, the dipeptide frequency and count play a major role in attribute weighting models, confirming the importance of dipeptide bonds in the function of hyperaccumulator pumps, as suggested by Abdelmagid and Too. 42 The frequency of glutamine-valine was the next important protein attribute selected by five models (one attribute weighting and four tree induction models). In three attribute weightings and one tree induction model, the valine-phenylalanine count was shown to be the third most important protein feature regarding the type of heavy metal transporter.
The best and worst performances were gained when rule induction was applied on discretized data with area under curve (AUC) (optimistic, 84.0% ± 12.4%) and AUC (pessimistic) criteria, respectively. The figures generally were higher when numerical data (nondiscretized data) was used. The numbers of rules generated from 6–15 have the ability to distinguish between hyperaccumulator pumps and tolerant pumps. When tree induction model was run on a numerical dataset, the highest performance was gained on the Gini index criterion of the decision tree (96.0% ± 6.7%) and the lowest performance (47.9% ± 16.6%) was obtained when tree induction was applied on discretized data of the decision tree with the Gini index criterion.
Although some trees generated by tree induction models had just two branches, as seen in the information gain of ID3 in the numerical data, the depth of trees in some models was so complicated (more than 200 branches in ID3 run on discretized dataset with the Gini index and accuracy criteria) that it was difficult to extract results. Generally, decision tree algorithms provide a very useful tool for manipulating huge amounts of data. They have been used for P glycoprotein pump classification using three datasets for substrate, inhibitor, and inducer activities, with predictive accuracies of up to 90% in CHAID, CART, and C4.5 models, 43 although other models, such as support vector machine or K-NN have also been proposed for prediction of P glycoprotein pumps, with an accuracy of up to 81%. 44 The decision tree method for classification problems has been extended to accommodate multiple dependent properties. When applied to drug discovery efforts, this means a separate activity class that can be predicted for each of several targets with a single tree model. A new tree representation and growth procedure, PUMP-RP, has been developed. The final architecture of the tree provides easy interpretation as to which independent variables and split values are important for all targets and which are specific for a given target. An additional advantage of the new method is using of data with missing (or even sparse) dependent property values. This has the potential to leverage copious data from an older, well-studied target while beginning to study a newer target for which only a small amount of data are available. 45 In another study, a support machine vector-based method is used for the identification of lipocalin protein sequences with high predictive accuracy (. 90% in leave-one-out). The model used both position-specific scoring matrix (PSSM), and secondary structure emerged as the best model in this study. 46
Cysteine was one of the contributing protein attributes assigned by many algorithms, either in a single or dipeptide form with other amino acids. Cysteine easily combines with oxygen and makes a covalent bond with another cysteine (disulfide bond), resulting in a highly hydrophilic and nonpolar molecule, and plays an important role in the structural conformation of heavy metal transporters. It has been shown that cysteine and histidine participate in binding of several transition metals and iron complexes. The method predicted histidine as being in either of two states (free or metal-bound) and cysteine in either of three states (free, metal-bound, or in disulfide bridges). The method used only sequence information by utilizing position-specific evolutionary profiles, as well as more global descriptors, such as protein length and amino acid composition. 47 In another study, two mutant versions of the metallothionein gene were constructed and tested for their ability to confer metal resistance. The results demonstrated that there is significant flexibility in the structural requirements for metallothionein to function in copper detoxification, and that yeast metallothionein is also capable of detoxifying cadmium under conditions of constitutive expression. 48
There were two peer groups with anomalies, with the count of sulfur as the most anomalous attribute, and the positive effects of feature selection filtering for removing outliers was confirmed here, as previously demonstrated. 49 The number of clusters generated by K-means modeling did not change between the models with and without feature selection, although the number of records in the clusters changed. An unsupervised, two-phase clustering approach that combined K-means and hierarchical clustering with knowledge-informed cluster selection and annotation methods was used in approximately 20,000 cysteine-based protein microenvironments, and identified 70 interesting clusters, some of which represented known motifs (eg, metal binding and phosphatase activity), and some of which were novel, including several zinc binding sites. These results showed that clustering may be helpful in the functional characterization of novel proteins and to help us understand the protein structure-function relationship better. 50
The model put more than two-thirds of records into one cluster, showing the relative homogeneity between the records (no significant differences at P > 0.05 found with and without feature selection). In the two-step model, the number of clusters was the same with or without feature selection, and the numbers of records in each cluster showed little variation.
The results showed that various bioinformatics tools and modeling facilities can be used to identify types of heavy metal transporter proteins, with a precision rate up to 95%. To our knowledge, this is the first time that primary or secondary attributes have been shown to play an important role in the extent of heavy metal tolerance in these transporters, and the glycine count to be the most important protein feature in this regard. In addition, feature selection, or attribute weighting, can be used to select the most important protein attributes and reduce the burden on processing equipment. The new findings, presented here, open up new avenues for understanding the structure of heavy metal transporters, modeling, and prediction of the amount of unknown P1B-ATPase pump accumulation activity. This work lays the foundation for engineering new super hyperaccumulator pumps in the laboratory using various mutagenesis tools, such as site-directed mutagenesis based on critical protein and amino acid features discovered in this research.
Disclosure
This manuscript has been read and approved by all authors. This paper is unique and is not under consideration by any other publication and has not been published elsewhere. The authors and peer reviewers of this paper report no conflicts of interest. The authors confirm that they have permission to reproduce any copyrighted material.
Footnotes
Acknowledgments
The authors greatly appreciate and acknowledge the technical support of the Bioinformatics Research Group, Green Research Center, Qom University, and the College of Agriculture at Shiraz University, for supporting this project.
Appendix
Accession, metals, type of pump, and organism of each amino acid sequence of P1-ATPase.

| Accession | Metal | Type of pump | Organism |
|---|---|---|---|
| Q70Q04 | Zn/Cd | H | Arabidopsis halleri subspecies halleri |
| Q9UVL6 | Cu | H | Candida albicans (yeast) |
| Q9P983 | Cd | H | Saccharomyces cerevisiae (Baker's yeast) |
| Q9P458 | Cu | H | Candida albicans (yeast) |
| Q96WX2 | Cu | H | Candida albicans (yeast) |
| Q941L1 | Cu | H | Brassica napus (rape) |
| Q92T56 | Zn/Cd/Pb | H | Rhizobium meliloti (Sinorhizobium meliloti) |
| Q8ZS90 | Cu/Ag | H | Anabaena sp. (strain PCC 7120) |
| Q8H028 | Cu | H | Oryza sativa subspecies japonica (rice) |
| Q88cP1 | Cd | H | Pseudomonas putida (strain KT2440) |
| Q7XU05 | Cu | H | Oryza sativa subspecies japonica (rice) |
| Q70LF4 | Zn/Cd | H | Thlaspi caerulescens (Alpine penny-cress) |
| Q6ZDR8 | Cu | H | Oryza sativa subspecies japonica (rice) |
| Q6JAg2 | Cu | H | Sorghum bicolor (sorghum, Sorghum vulgare) |
| Q6H7M3 | Cu | H | Oryza sativa subspecies japonica (rice) |
| Q6H6Z1 | Cu | H | Oryza sativa subspecies japonica (rice) |
| Q69AX6 | Zn/Cd/co | H | Thlaspi caerulescens (Alpine penny-cress) |
| Q655X4 | Cu | H | Oryza sativa subspecies japonica (rice) |
| Q5AQ24 | Cu | H | Candida albicans (yeast) |
| Q5API0 | Cu | H | Candida albicans (yeast) |
| Q59465 | Zn/Cd/co | H | Helicobacter pylori (Campylobacter pylori) |
| Q59385 | Cu | H | Escherichia coli (strain K12) |
| Q4WQF3 | Cu | H | Aspergillus fumigatus (Sartorya fumigata) |
| Q3ZDL9 | Zn/Cd | H | Arabis gemmifera |
| Q2I7E8 | Cd | H | Arabidopsis halleri |
| Q10QZ3 | Cu | H | Oryza sativa subspecies japonica (rice) |
| Q10QZ2 | Cu | H | Oryza sativa subspecies japonica (rice) |
| Q0JB51 | Cu | H | Oryza sativa subspecies japonica (rice) |
| Q0E3J1 | Cu | H | Oryza sativa subspecies japonica (rice) |
| Q0DAA4 | Cu | H | Oryza sativa subspecies japonica (rice) |
| P38360 | Cd | H | Saccharomyces cerevisiae (Baker's yeast) |
| B8BBV4 | Cu/Ag | H | Oryza sativa subspecies indica (rice) |
| B8B185 | Cu/Ag | H | Oryza sativa subspecies indica (rice) |
| B8APM8 | Cu/Ag | H | Oryza sativa subspecies. indica (rice) |
| B8AIJ3 | Cu/Ag | H | Oryza sativa subspecies. indica (rice) |
| B8ADR7 | Cu/Ag | H | Oryza sativa subspecies indica (rice) |
| B6HT11 | Cu | H | Penicillium chrysogenum (strain ATCC 28089/DSM 1075/Wisconsin 54-1255) |
| B6Hc49 | Cu | H | Penicillium chrysogenum (strain ATCC 28089/DSM 1075/Wisconsin 54-1255) |
| B6H689 | Cu | H | Penicillium chrysogenum (strain ATCC 28089/DSM 1075/Wisconsin 54-1255) |
| B6H165 | Cu | H | Penicillium chrysogenum (strain ATCC 28089/DSM 1075/Wisconsin 54-1255) |
| B6GWG5 | Cu | H | Penicillium chrysogenum (strain ATCC 28089/DSM 1075/Wisconsin 54-1255) |
| B5VEN9 | Cd | H | Saccharomyces cerevisiae (strain AWRI1631, Baker's yeast) |
| B3LML9 | Cd | H | Saccharomyces cerevisiae (strain RM11–1a, Baker's yeast) |
| B2Y4P1 | Zn/Cd | H | Arabidopsis halleri subspecies halleri |
| B2Y4N2 | Zn/Cd | H | Arabidopsis halleri subspecies halleri |
| B2Y4N1 | Zn/Cd | H | Arabidopsis halleri subspecies halleri |
| B2APT4 | Cu | H | Podospora anserina |
| B2AAH3 | Cu | H | Podospora anserina |
| B0Y4L9 | Cu | H | Aspergillus fumigatus (strain CEA10/CBS 144.89/FGSC A1163) |
| B0XWU3 | Cu | H | Aspergillus fumigatus (strain CEA10/CBS 144.89/FGSC A1163) |
| A6ZLN2 | Cd | H | Saccharomyces cerevisiae (strain YJM789, Baker's yeast) |
| A5DRE2 | Cu | H | Pichia guilliermondii (yeast, Candida guilliermondii) |
| A5DHO6 | Cu | H | Pichia guilliermondii (yeast, Candida guilliermondii) |
| A3BU99 | Cu | H | Oryza sativa subspecies japonica (rice) |
| A3BEE3 | Cu | H | Oryza sativa subspecies japonica (rice) |
| A3AWA4 | Cu | H | Oryza sativa subspecies indica (rice) |
| A1OL19 | Cu | H | Aspergillus clavatus |
| A1OII4 | Cu | H | Aspergillus clavatus |
| Q60048 | Cd | S | Listeria monocytogenes |
| Q31HQ5 | Cu/Ag | S | Thiomicrospira crunogena (strain XCL-2) |
| Q31H35 | Cu2+/Cu/mg | S | Thiomicrospira crunogena (strain XCL-2) |
| Q31E73 | Cu/Ag | S | Thiomicrospira crunogena (strain XCL-2) |
| Q31DS4 | Cu/Ag | S | Thiomicrospira crunogena (strain XCL-2) |
| B5AXL4 | Cu | S | Arabidopsis thaliana (Mouse-ear cress) |
| Q9ZHO7 | Cu | T | Salmonella typhimurium |
| Q9SZW4 | Zn/Cd | T | Arabidopsis thaliana (Mouse-ear cress) |
| Q9SH30 | Cu | T | Arabidopsis thaliana (Mouse-ear cress) |
| Q9S7J8 | Cu | T | Arabidopsis thaliana (Mouse-ear cress) |
| Q9JZI0 | Cu | T | Neisseria meningitidis serogroup B |
| Q9I147 | Zn/Cd/Pb | T | Pseudomonas aeruginosa |
| Q9O594 | Cu | T | Arabidopsis thaliana (Mouse-ear cress) |
| Q94KD6 | Cu | T | Arabidopsis thaliana (Mouse-ear cress) |
| Q8ZRG7 | Cu/Ag | T | Salmonella typhimurium |
| Q8VPE6 | Cu2+/Cu/Ag | T | Enterococcus faecium (Streptococcus faecium) |
| Q8RVG7 | Cd | T | Arabidopsis thaliana (Mouse-ear cress) |
| Q8LPW1 | Zn/Cd | T | Arabidopsis thaliana (Mouse-ear cress) |
| Q8L158 | Zn/Cd | T | Oscillatoria brevis |
| Q8H384 | Zn/Cd | T | Oryza sativa subspecies japonica (rice) |
| Q88RT8 | co | T | Pseudomonas putida (strain KT2440) |
| Q830Z1 | co | T | Enterococcus faecalis (Streptococcus faecalis) |
| Q7Y051 | Cu | T | Arabidopsis thaliana (Mouse-ear cress) |
| Q7SGS2 | Cu | T | Neurospora crassa |
| Q7S316 | Zn/Cd/pb | T | Neurospora crassa |
| Q7RZE4 | Cu | T | Neurospora crassa |
| Q7A3E6 | Cu | T | Staphylococcus aureus (strain N315) |
| Q75O31 | Cu | T | Ashbya gossypii (yeast, Eremothecium gossypii) |
| Q750J2 | Cu | T | Ashbya gossypii (yeast, Eremothecium gossypii) |
| Q72N56 | Cu/Ag | T | Leptospira interrogans serogroup |
| Q6MK07 | Cu/Ag | T | Bdellovibrio bacteriovorus |
| Q6JAH7 | Cu | T | Zea mays (maize) |
| Q6JAg3 | Cu | T | Sorghum bicolor (Sorghum, Sorghum vulgare) |
| Q6OS43 | Cu | T | Kluyveromyces lactis (yeast, Candida sphaerica) |
| Q6OKX1 | Cu | T | Kluyveromyces lactis (yeast, Candida sphaerica) |
| Q6BVG6 | Cu | T | Debaryomyces hansenii (yeast, Torulaspora hansenii) |
| Q6BIS6 | Cu | T | Debaryomyces hansenii (yeast, Torulaspora hansenii) |
| Q654Y9 | co | T | Oryza sativa subspecies Japonica (rice) |
| Q5K722 | Cu | T | Cryptococcus neoformans (Filobasidiella neoformans) |
| Q58AE3 | Cu/Ag/Zn/Cd/pb | T | Ralstonia metallidurans (strain CH34/ATCC 43123/DSM 2839) |
| Q4WYE4 | Cu | T | Aspergillus fumigatus (Sartorya fumigata) |
| Q4PI36 | Cu | T | UstilAgo maydis (Smut fungus) |
| Q4PFU4 | Cu | T | UstilAgo maydis (Smut fungus) |
| Q3MNJ6 | Cu/Ag | T | Enterococcus faecium (Streptococcus faecium) |
| Q3E9R8 | Cu | T | Arabidopsis thaliana (Mouse-ear cress) |
| Q12685 | Cu | T | Saccharomyces cerevisiae (Baker's yeast) |
| Q0WUP4 | Cd | T | Arabidopsis thaliana (Mouse-ear cress) |
| Q0WPL5 | Cu | T | Arabidopsis thaliana (Mouse-ear cress) |
| Q0D7L9 | Zn/Cd/pb | T | Oryza sativa subspecies Japonica (rice) |
| P37617 | Zn/Cd/pb/Au | T | Escherichia coli (strain K12) |
| P32113 | Cu | T | Enterococcus hirae |
| P20021 | Cd | T | Staphylococcus aureus |
| P0A503 | Zn/Cd/pb | T | Mycobacterium bovis |
| P05425 | Cu2+/Cu/Ag | T | Enterococcus hirae |
| O67432 | Cu/Ag | T | Aquifex aeolicus |
| O67203 | Cu2+ | T | Aquifex aeolicus |
| O64474 | Zn/Cd | T | Arabidopsis thaliana (Mouse-ear cress) |
| O32220 | Cu | T | Bacillus subtilis |
| O32219 | Zn/Cd/co | T | Bacillus subtilis |
| O31688 | Co | T | Bacillus subtilis |
| B9WHL7 | Cu | T | Candida dubliniensis (strain cd36/cBS 7987/NcPF 3949/NRRL Y-17841) |
| B9W8U7 | Cu | T | Candida dubliniensis (strain cd36/cBS 7987/NcPF 3949/NRRL Y-17841) |
| B8PIS7 | Cu | T | Postia placenta (strain ATcc 44394/Madison 698-R, Brown rot fungus) |
| B8PD13 | Cu | T | Postia placenta (strain ATcc 44394/Madison 698-R, Brown rot fungus) |
| B8B248 | Zn/Cd/pb | T | Oryza sativa subspecies indica (rice) |
| B8B1T9 | co | T | Oryza sativa subspecies indica (rice) |
| B6TVS8 | Cu | T | Zea mays (maize) |
| B6K2D1 | Cu | T | Schizosaccharomyces japonicus (strain yFS275/FY16936) |
| B5AXM3 | Cu | T | Arabidopsis thaliana (Mouse-ear cress) |
| B5AXJ3 | Cu | T | Arabidopsis thaliana (Mouse-ear cress) |
| B5AXJ0 | Cu | T | Arabidopsis thaliana (Mouse-ear cress) |
| B5AXI8 | Cu | T | Arabidopsis thaliana (Mouse-ear cress) |
| B5AXI7 | Cu | T | Arabidopsis thaliana (Mouse-ear cress) |
| B5AXI6 | Cu | T | Arabidopsis thaliana (Mouse-ear cress) |
| B4FW89 | Co | T | Zea mays (maize) |
| B3LG21 | Cu | T | Saccharomyces cerevisiae (strain RM11–1a, Baker's yeast) |
| A9NIX0 | Zn/Cd/pb | T | TritiCum aestivum (wheat) |
| A8FHF8 | Cu/Ag | T | Bacillus pumilus (strain SAFR-032) |
| A8FHE7 | Zn/Cd/co | T | Bacillus pumilus (strain SAFR-032) |
| A8FcJ1 | co | T | Bacillus pumilus (strain SAFR-032) |
| A7ISW5 | Cu | T | Glycine max (soybean) |
| A6ZYM2 | Cu | T | Saccharomyces cerevisiae (strain YJM789, Baker's yeast) |
| A5E2U1 | Cu | T | Lodderomyces elongisporus (yeast) |
| A5E1L1 | Cu | T | Lodderomyces elongisporus (yeast) |
| A3LVL5 | Cu | T | Pichia stipitis (yeast) |
| A3LRS8 | Cu | T | Pichia stipitis (yeast) |
| A3GG72 | Cu | T | Pichia stipitis (yeast) |
| A3BI12 | Zn/Cd/pb | T | Oryza sativa subspecies japonica (rice) |
| A3BF39 | Zn/Cd/pb | T | Oryza sativa subspecies. japonica (rice) |
| A2YJN9 | Zn/Cd/pb | T | Oryza sativa subspecies indica (rice) |
| A2YED2 | Zn/Cd/pb | T | Oryza sativa subspecies indica (rice) |
| A1D6E8 | Cu | T | Neosartorya fischeri (strain ATCC 1020/DSM 3700/FGSC A1164/NRRL 181) |
| A1CW79 | Cu | T | Neosartorya fischeri (strain ATCC 1020/DSM 3700/FGSC A1164/NRRL 181) |
| Q8J286 | Cu | Colletotrichum lindemuthianum (bean anthracnose fungus) | |
| Q0WXV8 | Cu | Glomerella lagenarium (anthracnose fungus) | |
| Q0SAU6 | Cu/Ag | Rhodococcus species (strain RHA1) | |
| B8PCW0 | Zn/Cd/pb | Postia placenta (strain ATCC 44394/Madison 698-R) | |
| B2WP89 | Cu | Pyrenophora tritici-repentis (strain Pt-1C-BFP, Wheat tan spot fungus) | |
| B2WCY5 | Cu | Pyrenophora tritici-repentis (strain Pt-1C-BFP, Wheat tan spot fungus) | |
| B2W577 | Cu | Pyrenophora tritici-repentis (strain Pt-1C-BFP, Wheat tan spot fungus) | |
| B0STR2 | Cu | Leptospira biflexa serovar Patoc (strain Patoc 1/ATCC 23582/Paris) | |
| A7TLU7 | Cu | Vanderwaltozyma polyspora (strain ATCC 22028/DSM 70294) | |
| A7JVC8 | Cu | Mannheimia haemolytica PHL213 | |
| A6SEF3 | Cu | Botryotinia fuckeliana (strain B05.10, Noble rot fungus) (Botrytis cinerea) | |
| A6SAI2 | Cu | Botryotinia fuckeliana (strain B05.10, Noble rot fungus) (Botrytis cinerea) | |
| A6RXG0 | Cu | Botryotinia fuckeliana (strain B05.10, Noble rot fungus) (Botrytis cinerea) | |
| A6RAT8 | Cu | Ajellomyces capsulata (strain NAm1/WU24) (Darling's disease fungus) | |
| A6R8J5 | Cu | Ajellomyces capsulata (strain NAm1/WU24, Darling's disease fungus) | |
| A4RDM4 | Cu | Magnaporthe grisea (Rice blast fungus, PyriCularia grisea) | |
| A4QR04 | Cu | Magnaporthe grisea (Rice blast fungus, PyriCularia grisea) |
Appendix
Standard amino acid abbreviations.

| Amino acid | Letter | Letter |
|---|---|---|
| Alanine | Ala | A |
| Arginine | Arg | R |
| Asparagine | Asn | N |
| Aspartic acid | Asp | D |
| cysteine | Cys | C |
| Glutamic acid | Glu | E |
| Glutamine | Gln | Q |
| Glycine | Gly | G |
| Histidine | His | H |
| Isoleucine | Ile | I |
| Leucine | Leu | L |
| Lysine | Lys | K |
| Methionine | Met | M |
| Phenylalanine | Phe | F |
| Proline | Pro | P |
| Serine | Ser | S |
| Threonine | Thr | T |
| Tryptophan | Trp | W |
| Tyrosine | Tyr | Y |
| Valine | Val | V |