
Abstract
Large public repositories of microarray experiments offer an abundance of biological data. It is of interest to use and to combine the available material to create new biological information and to develop a broader view on biological phenomena. Meta-analyses recombine similar information over a series of experiments to sketch scientific aspects which were not accessible by each of the single experiments. Meta-analysis of high-throughput experiments has to handle methodological as well as technical challenges. Methodological aspects concern the identification of homogeneous material which can be combined by appropriate statistical procedures. Technical challenges come from the data management of large amounts of high-dimensional data, long computation time, as well as the handling of the stored phenotype data.
This paper compares in a meta-analysis of a large series of microarray experiments the interaction structure within selected pathways between different tumour entities. The feasibility of such a study is explored and a technical as well as a statistical framework for its completion is presented. Multiple obstacles were met during completion of this project. They are mainly related to the quality of the available data and influence the biological interpretation of the results derived.
The sobering experience of our study asks for combined efforts to improve the data quality in public repositories of high-throughput data. The exploration of the available data in large meta-analyses is limited by incomplete documentation of essential aspects of experiments and studies, by technical deficiencies in the data stored, and by careless duplications of data.
Introduction
Increasing insights into the pathogenesis of malignant disorders and the detection of a rapidly rising number of molecular alterations gave rise to the hope that cancer specific genetic profiles might be generated that will define biologic subgroups as well as define targets for direct specific therapeutic agents. 1 The search for genomic alterations has revealed a huge heterogeneity not only within one histologically defined cancer entity but even within one individual tumour. 2 The heterogeneity of genomic mutations, however, becomes less complex since their functional effects merge in the alteration of a few, distinct pathways, only. 3 Hence, the understanding of cancer biology may be improved also by focusing on alterations in pathway activities across tumour entities.
Rhodes et al 4 developed meta-analytic tools to characterize a common transcriptional profile that is universally activated in most cancer types relative to the normal tissues from which they arise, likely reflecting essential transcriptional features of neoplastic transformation. In addition, they characterized a transcriptional profile that is commonly activated in various types of undifferentiated cancer, suggesting common molecular mechanisms by which cancer cells progress and avoid differentiation.
It is the goal of this study to explore the feasibility of a large cross-cancer meta-analysis based on high-throughput gene expression microarray data (GEMA) to compare the interaction structure between members of specific pathways across relevant tumour entities based on available gene expression microarray data from oncological studies. The challenges of this project are given by the quality of available data, the data management for the projected study, the biostatistics/bioinformatics tools available for the analysis, and finally the strategy for interpreting the computational results.
Editorial policies and the idea to reuse the high-throughput gene expression data for validation and new research questions triggered the creation of public repositories. The MIAME (Minimum information about a microarray experiment) criteria 5 formulate the necessary conditions for verifying and reproducing results of microarray data analyses. MIAME compliance assures a sensible reuse of public microarray data for the study of new questions: biological properties of the samples and phenotypes that were assayed need to be recorded along the data obtained from these assays.
At the moment there are three recommended international repositories to archive publication related functional genomic data:6,7 ArrayExpress (AE), 8 Gene Expression Omnibus (GEO), 9 and the Center for Information Biology Gene Expression Database (CIBEX). 10 GEO is currently the largest fully public gene expression resource.
Meta-analytic tools for GEMA are developed by many authors 11 but mainly in the field of differential gene expression and profiling. To our knowledge this paper is the first trying to do a meta-analysis of pathway specific network structures across tumour entities. The structural comparison is motivated by the discovery of different relationships between cancer types. 12 There is evidence for familial associations between acute myeloic leukemia and colorectal cancer. 13 Men with family history of breast cancer also have an increased risk of prostate cancer. 14 Different leukemia derive from specified deregulation during the hematopoietic stem cell differentiation. 15
Therefore, the interaction structure within genes annotated to specific pathways is explored and compared between eight human cancer entities. The cancer entities are grouped in eight tumour groups: four solid tumours (breast, colon, prostate, lung) and four haemic tumours (ALL, AML, CLL, Lymphoma). Thirteen different KEGG pathways which are organized into three groups are studied: Basic cellular signalling pathways (KEGG ID 04110: Cell cycle, 04115: p53 signalling pathway, 04210: Apoptosis, 04310: Wnt signalling pathway, 04512: ECM-receptor interaction), disease specific pathways (05210: Colorectal cancer, 05215: Prostate cancer, 05221: Acute myeloic leukaemia, 05223: Non-small cell lung cancer), and pathways related to DNA repair (04150: mTOR signalling pathway, 03410: Base excision repair, 03420: Nucleotide excision repair, 03430: Mismatch repair).
Number of experiments and samples in GEO (published data) and AE database (27/02/2009).

The exploration of the communication structure within a large set of genes is feasible by ignoring the dynamics of the complex biological system. The available micorarray measurements represent time averages of transcription dynamics. Conditional interaction graphs are used to infer their conditional correlation structure. 16 An interpretation of the edges of these graphs will not be given. The interest consists in assessing evidence that these graphs are different with respect to edges between cancer entities.
The paper is an explorative study on a strategy how to combine publicly available data repositories, bioinformatic tools, and statistical concepts to the defined task. Therefore, an analysis pipeline for the intended problems is described. The adaption of data management and related tools to assemble the data, to check its quality, and to perform the low and high level analysis for a very large set of microarrays is demonstrated. The results are presented. The paper is organized as follows: Section 2 describes material and methods, presents the data as well as the tools used for the low-and high-level analyses. Section 3 contains the results on global differences in the conditional correlation structure of thirteen pathways in eight cancer entities. We discuss our experiences and results in Section 4.
Materials and Methods
Microarray Data Set
Due to the weekly imports from GEO to AE, the data is taken from AE in order to facilitate the data management process. The repositories are dominated by experiments with Affymetrix Microarray data of the ‘HG-U133A’ and ‘HG-U133 Plus 2.0’ chip platforms. In order to work with a sample with an uniform laboratory work-up, we concentrate on data from the ‘HG-U133A’ Affymetrix GeneChip. In order to avoid bias due to specific pre-processing of the raw data, the feature-level extraction output (FLEO) files (CEL files) are used. 17
All experiments from AE repository available on February 27, 2009 and satisfying the following selection criteria are included: FLEO data available, more than 10 arrays have chip type HGU133A, experiment has more than 20 arrays, 50% of the arrays belong to one of the eight cancer entities. Some experiments satisfying these criteria contain identical arrays. For example the arrays from the experiments ‘E-GEOD-3910’ and ‘E-GEOD-3911’ together are identical to the arrays from the super series experiment ‘E-GEOD-3912’. These experiments are not included in the study to avoid duplicate arrays. Thereby 23 experiments are excluded.
A large cancer data set with more than 7000 microarrays is built from about 60 public available experiments in the AE database. An overview of the selected experiments is available in the Appendix. A detailed statistic of the data set is shown in Table 2. Data from cell line experiments and from human patients are grouped together. Furthermore, cancer subtypes are combined to one cancer entity (eg, childhood ALL is included in the ALL cancer entity group).
Statistic of available arrays for selected ArrayExpress experiments grouped by the eight cancer entities.

The R language
18
and the Bioconductor project
19
are chosen as the computational environment. In order to handle several thousand of microarrays for the low- and high-level analyses of our data parallel computing is used.20,21 A Bioconductor package called
The tools ‘boxplot’ and ‘MA-plot’ 19 are used for quality assessment in the pre-processing step. If an array is deficient in both assessments, it is marked as ‘deficient’ and excluded. Sixty deficient arrays for solid cancer experiments and 41 deficient arrays for haemic cancer experiments are excluded, which is about 1% of the data. Due to duplicated arrays in different experiments (from one cancer entity) and several deficient arrays, the set of arrays used in the analysis is smaller than all available arrays. For the breast cancer experiments only 51% can be used in the analysis and about 66% of all arrays. Therefore, the meta-analysis is executed on 4791 microarrays: 2833 arrays for solid tumours and 1958 arrays for haemic disease tumours.
Phenotype Data
No detailed data on the phenotypes of the patients included in the study was available due to lack of compliance with MIAME annotation rules. Even basic information like sex and age of the patients is not completely available. Detailed information on basic features of the tumours are generally missing. Our findings are summarized as follows: 47% of the patients are female and 18% male (36% missing), the median age is 55 (50% missing). All other variables, eg, tumour staging, are available for less than 20% of all arrays. Figure 1 shows the histogram of the age distribution for the haemic and solid cancer group. Since basic information on the tumours are not available the tumour entities may represent quite inhomogeneous groups.

Histogram of the age distribution for the hemic and solid cancer group.
Data Management
Sixty one single experiments and 7255 microarrays define the data set. Due to the large amount of CEL files and about 80 GB data volume, data management and storing is intricate. To make the data management feasible and reproducible, the raw data and processed data are saved in a general defined directory structure on the local hard disk. For every cancer entity, a directory containing the files is created. The file structure is optimized for the data processing with the R language and for re-usability of intermediate results.
The R package called
The package creates automatically the data set generation script. Providing an R list structure object with the AE experiment IDs the complete data set can be regenerated from the AE data base. For the large cancer study the list object is available in the Appendix. Therefore, the data set of our analysis is not submitted as new super-series data set to one of the public repositories. It (raw data and phenodata) is already available in the AE database and can easily constructed by the analyst from the data set generation script. It is straightforward to add new experiments to the analysis. For more details see the vignette of the package or the help files of the package. The package is available at the R-forge repository: http://AEDataManage.R-forge.R-project.org/.
Low-level Analysis
The data is pre-processed in one run using the R packages
The data showed strong batch effects. Correction for batch effects26,27 uses an empirical Bayes framework as proposed by Johnson et al. 27
High-Level Analysis
The PC-Algorithm 28 is used to estimate the network structure (conditional correlation structure) within the set of genes annotated to each pathway for each cancer entities.
Estimating Graphs
Multivariate gene expression data is characterised by its mean value structure as well as its dependence or correlation structure. While the first is concerned with the quantitative amount of transcription activity, the second focuses on the map of direct influences between genes: does the transcription activity of one gene influences the transcription activity of a second gene freezing all other genes annotated to the corresponding pathway on a fixed transcription level. An edge is drawn between two nodes (genes) if a direct influence is assessed. The PC-Algorithm estimates such a graph from observational data.28,29
Thorough validation studies 30 show advantages of the PC-Algorithm compared to competing approaches31–35 especially for sparse graphs in terms of estimation quality (true and false discovery rates for edges) as well as computational speed.
The PC-Algorithm is run with α = 0.05. This is a good choice for a graph with less then 20% of the maximal number of edges. 28 This is a plausible assumption for gene sets annotated to the KEGG pathways.
Comparing Graphs
Graphs on the same set of nodes are compared by the Structural Hamming Distance (SHD). The SHD between two graphs is the number of edge insertions, deletions or flips in order to transform one graph to the other. The smaller the SHD the bigger is the similarity between the two graphs. The SHD is symmetric and can be calculated by SHD = # of different edges in both graphs—# common edges in both graphs.
The null-hypothesis of no structural difference between two tumour entities is tested by a permutation test. The test assesses if an observed SHD between two graphs is untypically large compared to the SHD distribution under the null-hypothesis. This distribution results from comparing two estimated graphs from two data sets which differ just by random fluctuations. The permutation test is carried out after standardizing the transcription values of genes annotated to the specific pathways. The mean value is substracted from the individual measurements and the difference is divided by the standard deviation in each set of the two cancer entities which are compared. The rejection of this null-hypothesis on a 5% significance level is considered as evidence the cell processes as captured by the specific set of pathway genes proves a differential dynamic between both tumour entities considered.
The resampling for the test procedure proceeds as follows:
Choose the SHD to measure differential conditional correlation structure between both graphs.
Estimate each graph by the PC-Algorithm with α = 0.05 from the observed data and determine the SH Dobs between both graphs.
For resampling step i permute the data units between both data sets, estimate both graphs and calculate the specific SH Di (i = 1, …, R).
Determine a permutation P-value by pperm = #{SH Dobs < SH Di}/R.
Reject the null-hypothesis if pperm is smaller then 0.05.
The data is resampled R = 500 times.
Permutation P-values below 0.01 are considered as evidence for a difference. Larger P-values are called marginal (P ≤ 0.05) or not significant (P > 0.05).
Results
A total of 4791 microarrays was grouped into eight tumour entities (four solid tumours with a total of 1958 arrays and four haemic tumours with a total of 2833 arrays). The minimal sample sizes is 177 arrays for probes from CLL patients, the maximal sample size is 1834 arrays for breast cancer tissue (see Table 2). The phenotype information on the individual tumour probes is very sparse and is not considered in the following analysis.
Figure 2 shows the SHD for all six combinations of solid tumours (red triangles), all six combinations of haemic tumours (black triangles), and for all 16 haemic-solid combinations (blue triangles) when conditional independence graphs are estimated for each entity and compared by SHD.

SHD in single pathways for comparisons within solid tumours (black), haemic tumours (red) and between group comparisons (blue).
There is no obvious evidence in any pathway that the SHD for a between group (haemic/solid) comparison is larger as the SHD for a within group (haemic/haemic or solid/solid) comparison.
The comparison within solid tumours can be summarized as follows. It holds that the breast-colon comparison (# of arrays: 1834/197) is only distinct for the Wnt signalling pathway (04310). The breast-lung comparison (# of arrays: 1834/386) results for most pathways in a pronounced difference except the AML pathway (05221) and the Mismatch repair pathway (03430). The breast-prostate comparison (# of arrays: 1834/416) shows marginal or non-significant differences for the p53 signalling pathway (04115), the ECM-receptor interaction pathway (04512), the AML pathway (05221), Non-small cell lung cancer pathway (05223), and the Mismatch repair pathway (03430). The colon-lung comparison (# of arrays: 197/386) shows marginal or non-significant differences for the ECM-receptor interaction pathway (04512), the AML pathway (05221), and the Non-small cell lung cancer pathway (05223). The colon-prostate comparison (# of arrays: 197/416) shows marginal or non-significant differences for the p53 signalling pathway (04115), Apoptosis (04210), the ECM receptor interaction pathway (04512), Prostate cancer pathway (05215), the AML pathway (05221), Non-small cell lung cancer pathway (05223), and the mismatch repair pathway (03430). The lung-prostate comparison (# of arrays: 386/416) shows marginal or non-significant differences for ECM-receptor interaction pathway (04512), Non-small cell lung cancer pathway (05223), and the Mismatch repair pathway (03430).
SHDs (permutation P-values) for different hemic and solid cancer entities and pathways.

The comparison within haemic tumours can be summarized as follows. The ALL-AML comparison (# of arrays: 916/534) shows for each pathway a distinct conditional correlation structure. The ALL-CLL comparison (# of arrays: 916/177) shows marginal or non-significant differences for all pathway except Cell cycle (04110). The ALL-LYM (# of arrays: 916/331) comparison shows marginal or non-significant differences for p53 signalling (04115), ECM-receptor interaction (04512), Non-small cell lung cancer (05223). The AML-CLL comparison shows marginal or non-significant differences for the ECM receptor interaction (04512), Prostate cancer (05215), AML (05221), Non-small cell lung cancer (05223), and mismatch repair (03430). Comparing AML-LYM (# of arrays: 534/331) shows only the Mismatch repair pathway (03430) as marginal significant. The CLL-LYM comparison (# of arrays: 177/331) shows marginal or non-significant differences for p53 signalling (04115), ECM-receptor interaction (04512), Colon cancer (05210), Prostate cancer (05215), AML (05221), Non-small cell lung cancer (05223), and Mismatch repair (03430).
Table 6 in the Appendix presents the SHD and P-values for the between groups comparisons. They result in distinctive conditional correlation structures in all pathways for most of the pairs. More than two marginal or non-significant P-values are found in the COL-CLL, COL-LYM, LUN-ALL comparisons (see Table 4). No clear evidence for a difference in the COL-CLL comparison is found for p53 signalling (04115), Apoptosis (04210), ECM-receptor interaction (04512), Prostate cancer (05215), AML (05221), Non-small cell lung cancer (05223), mTOR signalling (04150), Base excision repair (03410), Nucleotide excision repair (03420), and Mismatch repair (03430) pathway. No clear evidence for a difference in the COL-LYM comparison is found for p53 signalling (04115), ECM-receptor interaction (04512), Prostate cancer (05215), AML (05221), Non-small cell lung cancer (05223), mTOR signalling (04150), and Mismatch repair (03430). Finally, no clear evidence for a difference in the COL-CLL comparison is found for p53 signalling (04115), Apoptosis (04210), ECM-receptor interaction (04512), Prostate cancer (05215), AML (05221), Non-small cell lung cancer (05223), mTOR signalling (04150), Base excision repair (03410), Nucleotide excision repair (03420), and mismatch repair (03430) pathway.
Number of pathways with no evidence for difference in conditional correlation structure.

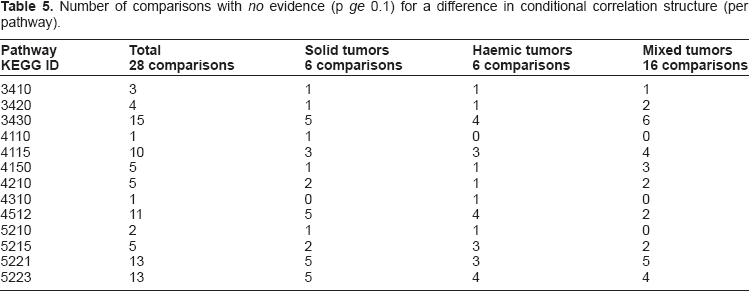
We use the number of pathways with no evidence for differential conditional correlation structure as a measure for similarity between tumor entities. Table 4 and Figure 3 summarize the situation. Table 5 lists the number of comparisons between and within groups with a permutation P-value above 0.1. The highest ranked pathways with respect to no evidence for a difference are Mismatch repair (03430), Non-small cell lung cancer (05223), AML (05221), ECM-receptor interaction (04512), and p53 signalling (04115) pathway. The pathways Cell cycle (04110) and Wnt signalling (04310) show in all except one comparison a significant difference in conditional correlation structure.

Similarity between tumours in terms of pathways with no evidence for a difference in conditional correlation structure.
Number of comparisons with no evidence (p ge 0.1) for a difference in conditional correlation structure (per pathway).
The major similarity between the entity pairs are visualized in Figure 3. Every node represents an entity and the wide of the edges is the number of pathways with no evidence for a difference. Similar pathway structure can be found between ALL-CLL, BREASTCOLON, and COLON-CLL. In the haemic tumour entities there is a noticeable similarity between lymphatic tumours (ALL, CLL, Lymphoma). In the solid tumour entities there is a similarity between tumours (breast, colon, prostate) arising in gland tissues.
Discussion
Similarities as well as dissimilarities between cellular processes in different tumour entities are of general interest. They promise a better understanding of basic disease mechanism as well as therapeutic principles. To this end many studies are concerned with the comparison of transcription profiles and gene signatures. 4 Bioinformatic tools give easy access to a wide range of signatures 36 and help to validate them over a wide range of disease entities. For example the molecular program of normal wound healing plays an important role in cancer metastasis. Consistent features in the transcriptional response of normal fibroblasts to serum reveal links between wound healing and cancer progression in a variety of common epithelial tumours. 37
Our studies does not focus on transcription profiles but on the structure of wiring between genes annotated to specific pathways and if these structures differ between tumor entities. We formalize the wiring between genes by conditional correlation graphs 28 where the genes of interest define the nodes and a direct influence between two genes is represented by an edge.
The following ideas motivated the study:
Tumours of different tissues may have distinct features in the way the corresponding transcription of genes annotated to the pathways is regulated. Therefore, we compared haemic and solid tumours. Within both groups we defined two subgroups. Solid tumours were split in a group taken from gland (breast, colon, and prostate cancer) and lung tissue. Haemic tumours were split in lymphatic tumours (ALL, CLL, and Lympoma) and AML.
To detect similar regulation structures in major pathways between cancers, we studied generic pathways which are crucial for the cell machinery (Cell cycle, Apoptosis, p53 signalling, ECM-receptor, Wnt signalling), which are disease related (Colorectal cancer, Prostate cancer, Non-small cell lung cancer, AML), and finally pathways which concern DNA repair.
The study is designed as a meta-analysis of data available in public repositories. Uses microarrays from one specific technical platform (HG-U133A) to avoid unnecessary heterogeneity caused by differing technical and lab-specific conditions. The data collection was the most challenging part of the meta-analysis. Our activity focused on the ArrayExpress repository. Here we found 61 studies with a total of 5693 arrays (HG-U133A) arrays which contributed material to the tumours of interest. A total of 101 defect arrays and further 801 duplicates of microarrays were removed. The package
The quality of the downloaded data in terms of phenotype information was very low. It is astonishing that other authors do not report this fact. Phenotype information is generally missing and even incomplete in basic items to characterize the clinical staging of tumours. Our data was taken from clinical studies and only 64% of the studies provided the sex of the patients. Age was missing in 50% of the patients. Detailed information on the tumour (tumour grade was available in 20% of the solid cancer, only sparse information on metastatic disease) was not given.
All studies contributed to ArrayExpress declare formally compliance with the MIAME criteria. 38 MIAME also requests information on the biological properties of the samples and phenotypes that were assayed. Neglecting this information may produce an insensible mixture of probes and invalidates most of the public oncological microarray data for secondary research.
The missing phenotype information confronts us with a potentially inhomogeneous set and a biological mix of probes within a tumour entity which are in different stages of its development. This confounding may invalidate the interpretation of our results.
Furthermore, the observed microarray data quantifies time averages of a complex dynamics with many components. Additionally, the gene expression measured for a few selected genes annotated to a pathway is only a small observation window on the system. The unobserved components also may confound the conditional correlation between two observed genes.
All these restriction impose a severe restrictions on interpretability and only allow a very coarse conclusion if a difference between two conditional correlation graphs is assessed: The dynamics are somehow distinct. Techniques to locate differences between two graphs more precisely to specific subset of nodes of graphs are under study and applied in settings with a stricter control of the phenotype and the confounding. 16
The estimation of conditional correlation structures was performed with the PC-Algorithm. 28 The difference between the estimated structures was quantified by the Structural Hamming Distance. Statistical significance was explored by resampling techniques. The computational challenge were handled by a parallelized computation environment created out of standard open access tools from R and the Bioconductor.18,19 Additional software which was required to build up our pipeline for reproducible calculations is readily provided.
The quantitative results for the conditional correlation structures of the gene sets and tumour quantities studied can be summarized as follows: The inferred structures for the selected thirteen pathways look mostly similar between breast cancer and colon cancer as well as between ALL and CLL samples. The lag of strong differences in the structures between colon cancer and CLL samples never addressed to our knowledge in the literature. There are narrative reports on patients with two different primary tumours where the treatment directed two one of both only resulted in a response of the second and not the first (in our centre a patient with simultaneous colon cancer and AML). The pathways with the most similar conditional correlation of the annotated genes between tumour entities are Mismatch repair (03430), Non-small cell lung cancer (05223), and AML (05221). The wiring between genes annotated to the Wnt pathway (04512) seems to be more similar within as between the tumour entities (solid/haemic).
The study answers both heuristics which motivated the meta-analysis in a limited way. It defined the technical requirements to perform a meta-analysis with about 4800 microarrays. Also, the statistical methods are available which help to tackle the question posed. But, it was not possible to enrich the developed analysis pipeline with necessary biological and clinical data. The publicly available data generally lack relevant and important phenotype information. The sobering experience of our study asks for combined efforts to improve the data quality in public repositories for data from high-throughput technologies.
The dataset used for the presented results is from February 2009. Since then, only 7 new data sets became available which meet our inclusion/exclusion criteria: six for breast cancer and 1 for prostate cancer, all together about 550 arrays. Furthermore, it would have been possible to validate our findings on microarray data derived from microarray type HGU-133 Plus 2.0. We did not perform the validation since we are not able to assure the homogeneity between the populations used for the first step and the validation. In this case we would not be able to discuss possible deviations between the validation based on the HGU-133 Plus 2.0 and the calculation based on the HGU-133 arrays. The HGU-133 Plus 2.0 arrays are more recent as the HGU-133 arrays which may imply that the studies based on the HGU-133 Plus 2.0 array are performed with more specific questions on more specific populations.
Footnotes
This manuscript has been read and approved by all authors. This paper is unique and is not under consideration by any other publication and has not been published elsewhere. The authors and peer reviewers of this paper report no conflicts of interest. The authors confirm that they have permission to reproduce any copyrighted material.
Methodological Considerations for the Interpretation of our Results
A short outline of ideas is given on how to relate biological ideas to the results of the described microarray analyses.
There are two problems: measuring time averages on a narrow set of dynamic processes and confounding of interaction within genes annotated to a pathway by unobserved quantities.
In order to understand the problem of time average, the cell is considered as a large dynamic system which is in a stable state. The multivariate process (Xt)t∈[o,T] describes the dynamic of all entities within the cell over a time period of length T. The data read from a microarray is the average over many cells caught at different time points within the dynamics of the cell-specific system. If the dynamic system is ergodic, its behaviour when it is allowed to run for a long time can be read from the cross-sectional measurements of many simultaneously trajectories at a fixed time point. This is expressed through ergodic theorems which assert that, under certain conditions, the time average of a function along the trajectories exists almost everywhere and is related to the space average. 39
Therefore, if a large amount of cells is assayed we get an average of all measurements from each cell which is identical of the average over time of (Xt)t∈[o,T]:
The covariance matrix of the high-dimensional vector W consists of integrals of covariance (in the diagonal) as well as cross-covariance functions (off diagonal). The term cross-covariance refers to the covariance cov(X, Y) between two random vectors X and Y. In order to distinguish that concept from the “covariance” of a random vector X, which is understood to be the matrix of covariance between the scalar components of X.
If W is observed in the tissue of several individuals, it is possible to estimate the conditional correlation structure of W by a conditional correlation graph. If material from a different biological condition exists, one could estimate a second graph and compare both. In case of a difference between both graphs the conclusion is allowed that the corresponding covariance matrices are different and that also some time averages of cross-covariance functions between components of the cell dynamics are different. This would allow the vague statement that the dynamic system under one condition is different from the dynamic system which governs the alternative condition. A deeper insight given such data is not possible.
The next problem is that we do not see the complex dynamic system. Transcription measurements are only available for a restricted set of genes (defined by the pathway). We do not see the whole of W but only a small subset of it. Let U be the components of W which are observable from the data and V be the components of W which are not measured (protein concentration, gene expression of genes which are not part of our pathway, …).
Often a random dynamical system is considered as a complex Gaussian process and the framework of multivariate normal distributions is available to do a thorough formal analysis. Thereby, the precision matrix of W which is the inverse of the covariance matrix plays the central role to understand direct interactions between the components.
Using this approach allows to understand how the unobserved components influence the correlation structure of the observed data by confounding. Confounding means that the conditional correlation between two genes is also the effect of unobserved components in the system and possibly not a real biological feature that is shared by both genes. This makes it difficult to interpret a conditional correlation graph of genes annotated to a pathway. It may show effects caused from outside and not by biological activity within the pathway.
The precision matrix of W is given by Q and can be partitioned in parts QUU and QVV which describe the conditional correlation structure in the observed part (U) and the unobserved part (V) of the system. The parts QUV and
The precision matrix of the marginal distribution of the observed components U is given by
This formalizes the idea that in the worst case an observed conditional correlation between two pathway genes is not caused by activity within the pathway but transmitted by conditional correlation of the genes with components of the system which are not observed. The following example demonstrates a practical consequence of the formal consideration.
A transcription factor regulates the expression of gene G1. Transcription factors belong to the unobserved V components of W. The concentration of a transcription factor may be regulated by some other protein which is also an unobserved V component of W. This protein is regulated by the transcriptional products of gene G2. The conditional correlation structure of both proteins is an element of QVV while the interaction of the transcription factor with G1 and the protein regulation by gene G2 are represented by elements of QUV. This may imply a non-zero element in