
Abstract
A loss of genetic diversity may lead to increased disease risks in subpopulations of dogs. The canine breed structure has contributed to relatively small effective population size in many breeds and can limit the options for selective breeding strategies to maintain diversity. With the completion of the canine genome sequencing project, and the subsequent reduction in the cost of genotyping on a genomic scale, evaluating diversity in dogs has become much more accurate and accessible. This provides a potential tool for advising dog breeders and developing breeding programs within a breed. A challenge in doing this is to present complex relationship data in a form that can be readily utilized. Here, we demonstrate the use of a pipeline, known as NetView, to visualize the network of relationships in a subpopulation of German Shepherd Dogs.
Introduction
The genetic composition of a breed determines the physical and physiological parameters that make up individuals. Studies have shown that there is a loss of the total amount of genetic polymorphism, generally referred to as genetic diversity, in modern dog populations. Genetic diversity has been affected by population bottlenecks as dogs were domesticated from the wild population, and again through selection for breed type. In particular, purebred dogs have been selectively bred and, in some lines, closely bred with the dominant use of popular sires, resulting in a reduction of genetic diversity. This is revealed by the presence of strong selection signatures when comparing dog genotypes from different breeds.1,2 For purebred dogs, this has been influenced by morphological criteria, as defined by breed standards, and by the dominant influence of champion show dogs. Overall, the loss of diversity is estimated to be >90% compared to ancestral dog populations,3,4 prompting calls for the use of the remaining diversity for maintaining health.5,6
The canine genome sequencing project has generated a greater understanding of genomic structure and variation within and between dog breeds.7–9 It has also enabled the generation of genomic tools to measure metrics across the genome scale, providing detailed insight into genome function,10–15 genetic diversity,16–18 and inherited disorders.19–25 Diversity can be measured using the calculations of population parameters such as “effective population size,” which estimate the equivalent number of individuals contributing to the breeding population that would give rise to the observed variance in gene frequency and inbreeding rate in the population. 26 The larger the effective population size, the greater the predicted diversity. With the advent of low-cost genotyping, molecular data are much more readily available and accessible to measure diversity accurately. However, devising ways to present such high content data in a digestible and effective form, so that they are easily interpreted and applied, is a challenge. One way to do this is to use a visual representation based on network analysis, which has the capacity to provide an intuitive approach to interact with complex data. 27
The German Shepherd Dog (GSD) is the largest breed (purebred) dog population in Australia 28 and is very popular worldwide. Originally used as a herding dog, it has found widespread value as a working dog and as a pet. Using genome-wide genotyping data from a subpopulation of GSD as an example, this study employed the NetView pipeline, a bioinformatic tool developed for livestock 27 and with broad potential utility, 29 to visualize a network that represents individual relationships in a subpopulation of GSD.
Materials and Methods
Study Animals
The dogs selected for this study were all purebred GSDs from Australia. Animals were identified for the study through the German Shepherd Dog League of New South Wales (NSW) and at National Championship Shows. A total of 82 dogs (28 males and 54 females) from 50 different kennels, aged between 1 and 10 years, were included in the analysis (Supplementary Table 1). All procedures were performed in accordance with the guidelines for the use of animals in this research (Animal Research Act, NSW, Australia) and were approved by the Animal Ethics Committee of University of Sydney under protocols 444 and 4949. Owners of all dogs provided written informed consent.
The average proportion of the genome covered in ROH and the average number of runs of different size in German Shepherds.
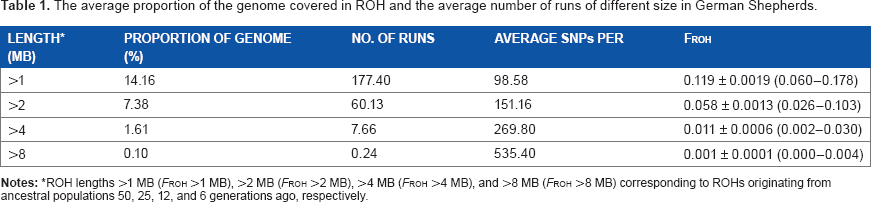
ROH lengths >1 MB (FROH >1 MB), >2 MB (FROH >2 MB), >4 MB (FROH >4 MB), and >8 MB (FROH >8 MB) corresponding to ROHs originating from ancestral populations 50, 25, 12, and 6 generations ago, respectively.
DNA Extraction
Blood was collected from the dogs by a trained professional using EDTA-coated vacutainers. Genomic DNA was isolated from the leukocyte fraction using a modified spin column procedure according to the manufacturer's recommendations (DNeasy or QIAmp; Qiagen). Total DNA was eluted into nuclease-free water, and an initial measurement of DNA quality and concentration was estimated by optical density measurement using spectrophotometry (GE Life Sciences/Pharmacia Biotech).
Genotyping
Genotyping was conducted on the 82 DNA samples using the CanineHD BeadChip (Illumina) and genome core services (GeneSeek Agrigenomics and Veterinary Diagnostics). The high-density bead chip provided comprehensive genome-wide coverage using 173,650 evenly spaced single-nucleotide polymorphisms (SNPs).
Homozygosity and Inbreeding Coefficient Calculation
Quality control filtering was performed using the PLINK version 1.07 software. 30 The dataset was filtered to exclude individuals with >10% missing genotypes and retain SNPs with a minor allele frequency (MAF) >0.05 and SNPs with a 90% genotyping rate. Multilocus heterozygosity (MLH), runs of homozygosity (ROH), and inbreeding were also computed in PLINK version 1.07. ROH in the genomes of the 82 individuals were identified using the homozyg command and the parameters homozyg-window-het 1, homozyg-snp 100, homozyg-window-snp 50, homozyg-window-missing 5, homozyg-window-threshold 0.05, homozyg-kb 1000, homozyg-density 50, and homozyg-gap 100, and ROH were calculated as a proportion of the canine genome. Inbreeding coefficients for genotyped dogs were calculated based on the observed versus (Hardy–Weinberg) the expected number of homozygotes.
Effective Population Size
The effective population size (Ne) was estimated using the linkage disequilibrium method implemented by the program NeEstimator version 2.01.31–33 To avoid bias from close linkage between loci, 10,000 evenly placed SNPs from across the genomes were selected for inclusion in the Ne calculation. The genome was divided into 10,000 segments and one SNP with the highest MAF selected from each segment; the lowest frequency alleles were screened out with an MAF cutoff set at 0.05.
Population Structure
Fine-scale population structure was calculated and visualized using NetView, a population analysis pipeline. 27 An unsupervised network clustering procedure, Super Paramagnetic Clustering (SPC), was used to create a fully connected population network in which individuals were clustered based on the genetic distance as calculated in PLINK from the SNP data. Complete linkage agglomerative clustering was used to produce a relationship matrix using the SNP data in PLINK (Supplementary File 1). The distance matrix was imported into SPC and run with K = 10 and minimum cluster size = 2. The resulting binary edge file produced was combined with the relationship matrix file to generate a weighted relationship matrix. The weighted relationship matrix was then converted into a GML file using the format conversion tool in Network Analysis Tools. 34 The clustering of individuals within the network was then visualized in Cytoscape using the “organic visualization” style setting from the software options. 35
Results
NetView uses a pipeline approach to visualize networks constructed on the basis of genetic relationship analysis. The stages include (i) data preparation and editing, (ii) the computation of a genetic distance matrix, (iii) the construction of a network, (iv) cluster analysis to arrange the individuals within the network, and finally (v) visualization of the network.
Genotype Data Preparation and Editing
Large-scale molecular genetic data, including SNP data, must first be processed for QC and edited to remove anomalies. We used PLINK, a publically available genome analysis toolset, 30 to identify any low call rates and duplication of samples, and to calculate allele frequencies. All 82 individual dogs had high-quality genotyping data and were included in the data analysis. From the original 173,650 SNPs present on the array, 89,265 SNPs remained following frequency and genotype pruning. Of these, 2,997 SNPs failed the missingness test (geno >0.1), while 83,641 SNPS failed the frequency test (MAF <0.05). Therefore, subsequent analysis was performed on 89,265 SNPs for all dogs.
Homozygosity and Inbreeding
Based on the mean MLH value, the degree of heterozygosity in this cohort of GSD was 0.3. When considering the average of all dogs, a total of 14.16% of the genomes were covered with ROH >1 MB, with an average of 177.4 runs per dog, while only 1.61% was covered by ROH >4 MB, and 0.10% by ROH >8 MB (Table 1; Supplementary File 2). Using data from all dogs, the effective population size (Ne) was calculated to be 43. Furthermore, when the molecular data was used to assess autozygosity, the FROH for lengths >1MB averaged 0.119. Values of FROH for other defined thresholds are listed in Table 1.
Genetic Distance Matrix
Stratification within the 82 dogs was determined using the allele sharing distance (ASD) calculation. ASD was calculated as follows: 1 – average proportion of shared alleles. A module to help perform these calculations, based on the identity by state, is available in the PLINK toolset. The resulting distance matrix was used as an input for network computation and was visualized using a color-coded heat map. Pairwise genetic relationships between the 82 GSDs, based on the genome-scale data, are presented in Figure 1A. The diagonal represents the location of each dog compared to itself and is coded to the maximum intensity of blue to indicate identity. Three prominent groupings are evident by shades of blue and in close alignment with the diagonal of the matrix. A commonly used method for visualizing similar data, a multidimensional scaling (MDS) plot, is also included (Fig. 1B).

Representation of the genetic relationship between dogs using molecular data. (
Network Construction
NetView uses unsupervised network clustering methodology, specifically SPC, implemented in the publically available software program, Sorting Points into Neighborhoods (SPIN). 36 The SPC method is based on the physical properties of ferromagnets (the magnetic phase transitions of spin systems), 37 but has been widely applied as a robust algorithm for analyzing gene expression profiles, phylogenetic trees, protein classification, and functional molecular networks.38,39 The GSD relationship matrix was used as an input into SPIN/SPC and run with a constant K-value of 10, and a minimum cluster size of 2.
Network Visualization
To visualize the network, NetView incorporates the SPIN/SPC output into the Cytoscape software. Cytoscape is a flexible open-source software platform to visualize complex biomolecular network data. 35 The resulting network is shown in Figure 2A. There are three clear clusters of closely related dogs, with 11, 12, and 14 dogs identified in each of these clusters. These clusters represent the most closely related dogs within a line. This can be compared with the relationship matrix that details the results for each of the pairwise comparisons (Supplementary Table 1). The other dogs are shown to be more distantly related, with varying contributions to the network. The population structure is represented in terms of nodes, edges between nodes, and thickness of edges. Figure 2A represents a static and dynamic display of the network, which may be explored in detail. A static example of a zoomed view of one region of the network is shown in Figure 2B. The network may also be scaled to incorporate additional genetic data or to add annotations or other types of relevant data. For example, a weighting may be included for gene coexpression data.

Network visualization graph produced by Cytoscape depicting the genetic relationships and degree of relatedness between individual GSDs based on SNP data. Individuals are represented as nodes and lines between dogs represent relationships. (
Discussion
Genome diversity is directly relevant to maintain a healthy breed and reduce morbidity from inherited disorders in dogs. Geneticists use measures of inbreeding and ROH as estimates of population-based descriptions of homozygosity. However, inbreeding averages do not capture risk to individuals very well and even ROH can be poorly correlated with disease prevalence, especially if based on common SNPs. 3 This may be confusing when applied to breeding programs. Visualization can reflect accurate relationships and provide a tool for mate selection in a relatively simple manner. We have adopted the tools that are described as NetView, a pipeline approach to construct a relationship network. This study demonstrates the application of NetView to visualize the genomic diversity in a cohort of GSD.
Maintenance of breed genetic diversity in dog breeds is a key goal for promoting health and welfare of animals. Different methods for measuring diversity have been developed based on genealogical and molecular data. Average values for coefficients of inbreeding are often quoted when discussing reduced diversity, and with the availability of molecular data, direct measures of genetic heterogeneity, or its converse, ROH, may be considered. ROH are classified according to the length of the observed homozygosity, with short runs reflecting more ancient haplotypes and long runs reflecting likely close relationships between parents. Long runs of ROH are enriched for deleterious mutations. Measured at a breed level, these parameters do not necessarily correlate with diseases across the entire breed, but the probability of inherited diseases arising in subpopulations of the breed is increased. Bateson and Sargan 40 estimated that, in a breed with a recessive disease allele frequency of 10%, a 13% reduction in heterozygosity translates to ~1.2% increase in the prevalence of an inherited disease. Within a breed, there is a limit to the available genetic diversity, which may be measured as the effective population size and is related to the ancestral founder population and the selective breeding effects over the intervening period. However, for purebred dogs, these practices have resulted in some very complex pedigree structures. Commonly, the complexity and reduced diversity arises from the limited use of breeding dogs, with preference given to the use of champion sires or selected dogs with desirable conformational features. As a result pronounced sire effects, such as increased inbreeding, may be restricted to subpopulations within the breed. The simplest advice for breeders has been to avoid mating dogs that are close relatives. Adopting this approach beyond the immediate family can be difficult to determine, and simply minimizing coancestry may have a little effect on the breed diversity over the longer term. 41
With the Introduction of increasing levels of available molecular data for individual dog genomes, either as a complete sequence or genome-wide SNP genotyping, the potential to identify disease-causing mutations has grown markedly. This information is now incorporated into breed health strategies for registered dogs and is helping in the decision of managing allele frequencies in the population via DNA testing and avoiding carrier matings, or even breeding to eliminate the mutation entirely, although the latter approach needs to be carefully considered to offset potential loss of diversity. 6 With the expansion of molecular data, the capacity to accurately calculate relationships is also markedly enhanced. These data provide another level of information for breeders and hold the potential for improved choice of mating pairs when compared with simply not mating close relatives. Molecular data provide the means to calculate the actual genetic similarity of dogs, independent of geographic location and the extent of pedigree information. However, simplifying the data to present an overview of complex relationship or pedigree information is a challenge. One approach has been adopted to develop computer-based algorithms. Windig and Oldenbroek 41 developed a computer-based simulation program to manage inbreeding at a national level for Golden Retrievers in the Netherlands. Others have developed breeding values for complex traits using traditional methods of estimated breeding values to incorporate into breeding decisions for specific disorders.42–45 Such programs need to have oversight, since selection based on individual traits can lead to unintended adverse consequences. Despite this potential drawback, the availability of a single numerical measure of a complex trait has proven to be highly valuable for selective breeding in livestock species. However, when choosing mates simply to maintain diversity, a simple visual method to identify the degree of genetic similarity may also be beneficial, such as a network view, as demonstrated in this study.
Visualization reflects an accurate measure of the relationship between two animals from molecular data. Typically, this creates a complex matrix or analysis that is difficult to represent in a simple format. Visualization of complex data has the advantage of providing an immediate source of information on the diversity spectrum across a subpopulation or even across the entire population of extant dogs within a breed. Interpretation of the visualized data is intuitive, and the network may be presented in a dynamic form to allow for exploration of an additional level of detail. The NetView approach has the advantage of providing a pipeline protocol using free software modules. The application of the pipeline to the GSD data in this article demonstrates the step-by-step procedures. Now, this analysis pipeline has also been implemented in Python. 29
Author Contributions
Conceived and designed the experiments: SM, HM, MK, PW. Analyzed the data: SM, RB, MK, PW. Wrote the first draft of the manuscript: SM, RB, PW. Contributed to the writing of the manuscript: SM, RB, HM, MK, PW. Agree with the results and conclusions: SM, RB, HM, MK, PW. Jointly developed the structure and arguments for the paper: SM, RB, MK, PW. Made critical revisions and approved final version: SM, RB, MK, PW. All authors reviewed and approved of the final manuscript.
Footnotes
Acknowledgments
This work was supported by the Canine Research Foundation. We thank the German Shepherd Council of Australia and all the dog owners for their consent and generous support for this research.