
Abstract
Background
Modeling protein-protein interactions (PPIs) using docking algorithms is useful for understanding biomolecular interactions and mechanisms. Typically, a docking algorithm generates a large number of docking poses, and it is often challenging to select the best native-like pose. A further challenge is to recognize key residues, termed as
Results
We had earlier developed a computer algorithm, called PPCheck, which ascribes pseudoenergies to measure the strength of PPIs. Native-like poses could be successfully identified in 27 out of 30 test cases, when applied on a separate set of decoys that were generated using FRODOCK. PPCheck, along with conservation and accessibility scores, was able to differentiate ‘native-like and non-native-like poses from 1883 decoys of Critical Assessment of Prediction of Interactions (CAPRI) targets with an accuracy of 60%. PPCheck was trained on a 10-fold mixed dataset and tested on a 10-fold mixed test set for hotspot prediction. We obtain an accuracy of 72%, which is in par with other methods, and a sensitivity of 59%, which is better than most existing methods available for hotspot prediction that uses similar datasets. Other relevant tests suggest that PPCheck can also be reliably used to identify conserved residues in a protein and to perform computational alanine scanning.
Conclusions
PPCheck webserver can be successfully used to differentiate native-like and non-native-like docking poses, as generated by docking algorithms. The webserver can also be a convenient platform for calculating residue conservation, for performing computational alanine scanning, and for predicting protein-protein interface hotspots. While PPCheck can differentiate the generated decoys into native-like and non-native-like decoys with a fairly good accuracy, the results improve dramatically when features like conservation and accessibility are included. The method can be successfully used in ranking/scoring the decoys, as obtained from docking algorithms.
Keywords
Background
Protein-protein interactions (PPIs) are critical for the normal functioning of a cell. Proteins interact with one another and carry out biological processes such as signal transduction, gene regulation, and immune response. Since interactions of two proteins often result in one or more biological processes, it is important to gain knowledge on interacting partners of proteins and hence their functions. We now have several databases1–3 that record PPI data from high-throughput experimental methods for thousands of proteins.
Protein-protein docking, the method of assembling two identical/different proteins together using physics-based computational algorithms, is still a challenging problem. Although we now have the methods that can explore all the possible rigid-body conformational states for the two proteins in a bound state, selection and ranking of the native-like pose is still a major problem. It is well understood that only when two proteins bind with one another in the correct conformation, they perform the designated function, and hence, selecting the native-like pose assumes central importance.
Several methods have been developed both for sampling the conformational space of the two proteins, which bind with one another, and to select the best native-like pose from the pool of generated complexes. Many of these algorithms perform grid-based searches to sample the conformational space. These algorithms inherently use shape/size complementarity, desolvation, or electrostatic interactions,4,5 physical force fields,6,7 empirical functions,8–10 and knowledge-based potentials derived from existing determined structures11–14 to dock the two proteins. Scoring of the docked poses is generally performed using either residue-level potentials or atomic potentials. While most residue-level potentials are simple to construct, easy to use, and are computationally very fast, atomic potentials are more accurate and also computationally more demanding. Several methods have been developed to computationally identify and/or predict the interacting partners for the proteins. These methods predict/identify interactions using features such as hydrophobic patch size, 15 evolutionary-conserved positions,15,16 position-specific sequence profiles and residue neighbor list, 17 surface accessibility,17–19 distance,20% structural similarity, 16 secondary structure contributions,21% amino-acid composition,21,22 dipeptide composition, and biochemical tripeptide composition. 22 PISA, 23 one of the most popular prediction tools for predicting the stability of a complex, uses several features such as free energy of formation, solvation energy gain, interface area, hydrogen bonds, salt-bridges across the interface, and hydrophobic specificity.
Earlier, in our lab, we developed COILCHECK 24 and COILCHECK+, 25 which can be used for structural analyses and validation of special class of PPIs, namely, in coiled-coils. PPCheck is an improvised version of these tools with many significant new features (like consideration of only interface residues in calculation of normalized energy per residue, inclusion of interface waters in hydrogen bond energy calculations, and implementation of an optimum distance cutoff” that can be used in a generalized way for calculating electrostatic interactions). PPCheck can be used to analyze diverse set of protein-protein interfaces, where simple distance criteria are employed to screen for interface residues followed by a quantitative view of the strength of interactions at the interface. PPCheck has been applied on a benchmark dataset of protein-protein complexes and standard values for the number of interface residues and the strength of PPIs had been obtained earlier. 26 PPCheck can be used to analyze a set of docking decoys to recognize the native-like and the non-native-like poses. It uses a combination of energy, conservation, and accessibility scores to rank the models that are generated by the docking algorithm(s). When applied, separately, on a dataset of 30 dimers and decoys from six targets of Critical Assessment of Prediction of Interactions (CAPRI),27–31 it showed promising results in differentiating the native-like and the non-native-like poses.
Experimental alanine scanning mutagenesis is time consuming and an expensive way of finding out the structurally important residues. FoldX 32 is one of the popular webservers that is used for prediction of important interactions that provide stability to the protein complexes, but it is not very accurate. Thus, there is a necessity for a new and powerful tool that can reliably predict the changes in binding energy of the protein complex when one of the residues is mutated to alanine. When applied on a set of 40 mutations from experimental studies, PPCheck performed well in calculating the changes in binding free energy of the complexes.
Hotspots are the interface residues that contribute maximally toward the stability of the complex, and when mutated to alanine, they impart an appreciable decrease in binding strength (difference of 2 kcal/mol or more in the binding energy). They are generally seen to exist in clusters called
PPCheck is freely available as a webserver at http://caps.ncbs.res.in/ppcheck/.
Methods
Identification of non-covalent interactions
Simple distance criteria are employed for the preliminary identification of non-covalent interactions, such as van der Waals, electrostatic, and hydrogen bonding. The respective energies are calculated using standard force fields as described in the following.
If the atoms of amino acids from two neighboring chains come within a distance of 7Å, then they are considered to be interacting and contribute to van der Waals interaction energy.
Van der Waals interaction energy is calculated as

Electrostatic interactions have been reported, and the corresponding energies are calculated using CHARMM package,
47
if the charged residues are within or equal to an optimum distance cutoff of 10Å. Coulomb's equation was used to quantify these interactions as follows:
Hydrogen bonds are identified, and the corresponding energy is calculated using Kabsch and Sander's equation as used in the DSSP program as follows:
where
Water molecules, when present at the interface, are considered when they form bridging hydrogen bonds with amino acids from two interacting protein chains. The single point charge model of water is considered, 48 and hence, the values of the charges are chosen as follows for the water-amino acid interactions in the Kabsch and Sander's equation 49 :
All the non-covalent interaction energies are summed up to total energy, and the ratio of total energy to the number of interface residues is termed as
PPCheck, like COILCHECK, 24 also reports residues involved in hydrophobic, strong electrostatic (salt-bridges) interactions, and short contacts, based on distance between specific atoms and nature of amino acids. All the hydrophobic amino acids, such as Leu, Ile, Val, Trp, Phe, and Tyr, are reported for hydrophobic interactions, if they are found within or equal to a Cβ-Cβ distance of 7Å. If oppositely charged amino acids are observed within or equal to a Cβ-Cβ distance of 4Å, then they are considered and reported as potential salt-bridges. Atoms are reported to be engaged in short contacts, if their spatial distance at the interface is lesser than the allowed van der Waals distance.
Short contacts are calculated as

Implementation
PPCheck has been developed using a combination of HTML, PERL, and PHP. The webserver works fine on all the browsers and the platforms. It takes ~22 seconds to identify interactions between two protein chains having ~150 amino acids each.
Selection of right cutoff for electrostatic interactions
Electrostatic interactions are long-range forces. In order to select the right cutoff for these kinds of interactions, the number of charged residues at the interfaces with Cβ-Cβ distance within various cutoff distances (7Å, 8Å, 10Å, 12Å, and 15Å) was calculated in the training dataset.
Dataset for prediction of native-like docking pose
In an earlier study, 26 PPCheck was applied on 270 non-redundant, well-characterized, and high-quality protein-protein interfaces where crystal structures were determined with resolution better than 2.5Å. It was observed that in most of the stable PPIs, the number of residues at the interface ranges from 51 to 150 and the normalized energy per residues is better than -2 kJ/mol (ie, less than -2 kJ/mol). These values were used as standardized criteria to distinguish the native-like docking pose from the non-native-like ones.
As studied earlier,
50
a set of six CAPRI targets (T24, T25, T26, T29, T32, and T36) with a total of 1883 decoys (best-predicted models by CAPRI participants) was collected from the CAPRI website maintained at the European Bioinformatics Institute (EBI) (http://www.ebi.ac.uk/msd-srv/capri/capri.html). In all, 132 of 1883 decoys were deemed as
Residue conservation as an additional parameter with PPCheck to predict accuracy of native-like docking decoys
To improve the performance of PPCheck in its ability to differentiate native-like docking poses from the non-native-like ones, residue conservation and solvent accessibility were used as additional features. For finding out the extent of residue conservation of a protein, homologous sequences were identified using Position-Specific Iterative (PSI)-BLAST,
51
against non-redundant (NR)-database (March 2013) with one iteration (Blastp), at an e-value cutoff of 10-2. The resultant hits are collected and clustered at 45% sequence identity using CD-HIT
52
(word size = 2). Multiple sequence alignment was then performed using ClustalW,
53
and the extent of residue conservation at each position was scored using structure-based alignment matrix created by Johnson and Overington matrix.
54
The conservation score for each residue is calculated as


Conservation score for each residue was further normalized to a range between 0 and 1 by dividing it by 100 (maximum amino-acid substitution score in structure-based matrix is 100 for cysteine-cysteine substitution).
Solvent accessibility is calculated using protein surface accessibility (PSA) module of JOY
55
program. A residue is treated as exposed if the relative accessibility as compared to a model tripeptide is more than 7%. If the relative accessibility of a residue is less than 7%, then it is considered as
PPCheck was applied on an earlier studied dataset
26
of well characterized 270 protein-protein complexes in order to select the optimum values of solvent accessibility and number of conserved residues (conservation score > 0.65) present at the interface, which can help in clear differentiation of native-like poses from the non-native-like ones. It was observed that more than 75% of the protein-protein interfaces (209/270 protein-protein interfaces) (Supplementary File 1) fell either in strong interactor or medium interactor categories. An interface was termed as
Studies on an additional dataset for evaluating the effectiveness of methodology
In order to assess the prediction accuracy of PPCheck, a non-redundant set of 30 dimers (15 homodimers and 15 heterodimers) was selected, as studied earlier, 56 to constitute the current test dataset. For the 30 dimers, the two interacting chains were separated and then allowed to dock using FRODOCK. 57 For all the generated docked poses for each of the 30 pairs of chains (30 complexes), PPCheck was applied and its ability to predict best native-like docking pose was evaluated. Top-5, top-10, and top-20 models ranked by PPCheck were compared with the already available native pose (in PDB) with respect to (i) root mean square deviation (rmsd) of C-alpha atoms, as obtained from MMalign, 58 and (ii) percentage of common interface residues (pcir) as observed in the native pose.
Similarly, rmsd values and pcir were calculated and compared between the top-1, top-5, top-10, and top-20 models of the test dataset, when conservation and solvent accessibility scores were used to assist PPCheck in differentiating the native-like docking poses from the non-native-like dosing poses.
Dataset for hotspot prediction
A set of 192 residue mutations from ASEdb and 126 residue mutations from BID were considered for training and testing PPCheck for hotspot prediction. The two datasets ASEdb and BID are mutually exclusive and independent of each other. Also, the same datasets have been largely used by almost all the existing methods of hotspot prediction; thus, consistency in the datasets is maintained. This also ensures a fair comparison between the existing methods.
ASEdb contains information about differences in binding energy of the complex when a single residue is mutated to alanine. A residue is considered as a hotspot if a gain of 2 kcal/mol or more of free energy of interaction is obtained, when mutated to alanine. Non-hotspots are the residues that when mutated to alanine causes a change in the binding energy by less than 0.4 kcal/mol. A total of 77 hotspots and 115 non-hotspots from ASEdb and 39 hotspots and 87 non-hotspots from BID were mixed and randomly rotated 10 times to form mutually exclusive 10-fold training and 10-fold test dataset. All further studies were carried out using these datasets.
Extent of spatial residue interaction
The number of residues from the partner chain with which a particular residue (say A) in the protein chain interacts is defined as the ESRI represented as
Normalized extent of spatial residue interaction
The ratio of the number of residues that interact with an interface residue (say
Extent of energy contribution
The energy contributed by a residue (say A), present at the interface, while interacting with residues present at the interface of the interacting partner is known as the
Normalized extent of energy contribution
Normalized extent of energy contribution (NEEC) of a residue is the ratio of EEC of a residue to the average EEC of all the residues present at the interface. The definition of NEEC is explained in a detailed manner, using an example, in Supplementary File 2.
Comparison of hotspot prediction performance of various methods
In order to evaluate the performance of PPCheck, parameters such as 


Dataset for performing computational alanine scanning
ASEdb records information about changes in binding energy when a residue is mutated to alanine. A set of randomly selected 40 such mutations (Supplementary File 3) was extracted from the database, and computational alanine scanning was performed using PPCheck.
Results and Discussion
Selection of optimum cutoff for electrostatic interaction
A number of charged residues at protein-protein interfaces were calculated between Cβ and Cβ atoms at various distance cutoffs of 7Å, 8Å, 10Å, 12Å, and 15Å within the training dataset. An optimum distance cutoff is recognized as a value beyond which a significantly large number of residues are spuriously included as
Increase in the number of charged interface residues at various Cβ-Cβ atom distance cutoffs in the training dataset. An increase in the number of interface residues (charged residues) is recorded in various bins (0-2, 3-4, 5-6, 7-8, and >8) in the 262 protein-protein interfaces (where water is a part of the interface and) when the distance cutoff between Cβ and Cβ atoms of charged residues for calculating electrostatic interactions is increased from 7Å to 8Å, 8Å to 10Å, 10Å to 12Å and 12Å to 15Å.
PPCheck as a reliable tool for predicting native-like docking pose out of many decoys
In an earlier study,26% PPCheck was applied on 270 non-redundant, high-quality protein-protein interfaces, and it was observed that the number of residues in a stable protein-protein interacting complex ranges from 51 to 150, whereas the normalized energy per residue is better (less) than -2 kJ/mol. These values can be considered as gold standard for optimal normalized energy at protein-protein interfaces and hence were used to differentiate the native-like docking poses from the non-native ones.
Results on a dataset of 30 dimers
PPCheck was applied on 30 dimers (15 homodimers and 15 heterodimers) that were earlier used to train DockScore, 56 an in-house algorithm for ranking docking decoys. For these 30 complexes, each chain was separated and then redocked using FRODOCK after altering its orientation. The aim was to check the consistent efficiency of PPCheck in predicting the native-like models in top-1, top-5, top-10, and top-20 ranks, respectively, out of 99 generated poses.
We observed that PPCheck and conservation and solvent accessibility scores could successfully rank native-like docking pose in top-1 position, from the 99 generated poses by FRODOCK (with an average C-alpha rmsd <4Å from the crystal structure of the complex) in 27 and 29 complexes out of 30. When poses within the top-5 PPCheck ranks are considered, 26 out of 30 complexes could be identified, but with increasing structural deviations from the native crystal structure.
Similarly, PPCheck could successfully rank native-like docking pose in top-1 position (>60% of common interface residues) between native pose and FRODOCK-generated pose in 25 out of 30 complexes. Figure 2 shows the performance of PPCheck in ranking the native-like poses in top-1, top-5, top-10, and top-20 positions.

Performance of PPCheck in ranking docking decoys. Top-1, top-5, top-10, and top-20 decoys, as ranked by PPCheck, and their similarity with native pose with respect to rmsd (
For analyzing the performance of PPCheck in differentiating native-like and non-native-like docking pose, CAPRI dataset was selected. A total of 1883 decoys, which were all submitted as best models by the respective CAPRI participants, corresponding to six CAPRI targets 50 (T24, T25, T26, T29, T32, and T36), were selected. When PPCheck alone was applied on these 1883 decoys/models, it could successfully identify 91 (out of 132; 68.9%) near-native-like models (Table 1).
Performance of PPCheck (with and without conservation and accessibility) in identifying the native-like (TP) and non-native-like (TN) docking poses from six CAPRI targets.

Residue conservation, solvent accessibility, and PPCheck
Although PPCheck showed significant capabilities in differentiating the native-like docking poses from the non-native-like ones in a stringent dataset such as CAPRI decoys, we included residue conservation and solvent accessibility as additional parameters to further improve the accuracy of differentiation. Conservation score for all the residues of the interacting chains was obtained by collecting homologous sequences followed by multiple sequence alignment (please see the Methods section for greater details).
Out of the 1883 decoys from the six CAPRI targets, CAPRI assessment team recognized 132 decoys as native-like poses, while remaining 1751 decoys as non-native-like poses. PPCheck, along with residue conservation and solvent accessibility, could successfully differentiate 71 native-like poses and 1057 non-native-like poses. Thus, an overall accuracy of ~60% was achieved in differentiating the native-like (71 out of 132) and non-native-like (1057 from 1751) docking poses.
PPCheck as computational alanine scanning tool
PPCheck was applied on a set of randomly selected 40 mutations from ASEdb and the change in binding energy of the complex when a specific residue was mutated to alanine was recorded. A correlation of 0.716 was observed (Fig. 3) between the changes in binding energy as recorded from experimental studies and as obtained from PPCheck. This correlation should be considered with caution as it has been obtained from a comparatively small dataset and the proportionality constant between the two axes is not 1. Further, there appears to be better correlation for mutations with large changes in binding energy.
Scatter plot showing the correlation between changes in binding energy of the protein complex (measured in kcal/mol) as measured from PPCheck and experimental studies. A correlation of 0.716 was observed for 40 mutations, selected randomly from ASEdb. Please note that the regression value is about 0.513 and the proportionality constant between the two terms is not 1.
Selection of optimum ESRI
Hotspots are interface residues that are generally seen to occur in clusters, 59 and they contribute to the stability of the complex, 27 along with providing specificity to the complex. Therefore, interface residues are expected to interact with large number of residues within the protein and form the partner chains. PPCheck was therefore applied on the 10-fold mixed training dataset (192 mutations obtained from ASEdb; 126 mutations obtained from BID), and the ESRI (please see the Methods section for explanation) of all the interface residues was calculated using residue-centric normalized PPCheck energies. We then checked how well the top-5 to top-15 residues, having the highest normalized ESRI (more than 1) and NEEC more than 1, were observed as hotspots in various protein-protein complexes in the training dataset. Figure 4 shows how the various parameters, such as true positive rate (TPR) and false positive rate (FPR), vary when top-5 to top-15 residues were considered as a hotspot from the training dataset. The best results were obtained when top-9 residues having the highest ESRI were considered as hotspots.
Selection of optimum EEC
Hotspots are the residues that bring a change of more than 2 kcal/mol when mutated to alanine, 59 and they contribute more energy than an average interface residue. Thus, we believe that those interface residues that contribute high pseudoenergies while interacting with residues present at the interface will also have the maximum tendency to act as a hotspot. In order to support our assumption, PPCheck was applied on the 10-fold mixed training dataset (192 mutations obtained from ASEdb; 126 mutations obtained from BID) and the EEC of all the interface residues was calculated. We then checked how well the top-5, top-6, top-7, and top-15 residues having the highest EEC (NEEC more than 1) and NESRI more than 1 were observed as hotspots in the various protein-protein complexes in the training dataset. Supplementary File 4 shows that the optimum results for hotspot prediction on 10-fold mixed training dataset were obtained when the EEC is selected as 8.
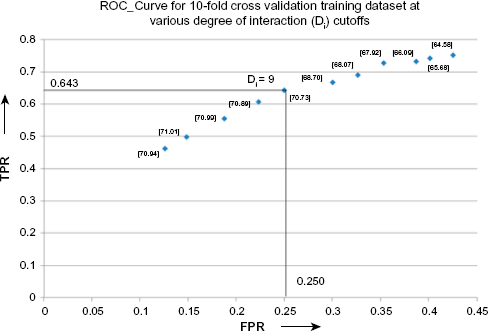
TPR versus true negative rate curve for the ESRI, represented as
Selection of optimum ESRI for predicting hotspots
A comparison between ESRI and EEC when top-5 to top-15 residues were treated as hotspots revealed that ESRI gave better results than EEC in almost all the cutoff values. Hence, top-9 residues having the highest ESRI (NESRI more than 1) and NEEC more than 1 were selected as hotspots.
How PPCheck predicts hotspots? Selection of ESRI or EEC for prediction
For every cutoff from top-5 to top-15 for ESRI and EEC methods of hotspot prediction, ESRI method gave improved results, ie, ratio of TPRs and FPRs from the ESRI method was better than that from the EEC method. Hence, the ESRI method was used for prediction of hotspots, ie, top-9 residues having the highest ESRI (NESRI more than 1) and NEEC more than 1 were selected as hotspots.
PPCheck as a hotspot prediction tool
PPCheck and other hotspot prediction tools, such as Robetta,
60
FOLDEF,30% KFC,
61
MINERVA,
62
HotPoint,
63
KFC2a, and KFC2b,64% were tested on 126 mutations from the BID dataset, and various parameters such as
Performance of various hotspot prediction programs on an independent test dataset.

Successful cases
Complex between soluble tissue factor protein and blood coagulation factor VII-A protein (PDB ID - 1FAK; interacting chains - T and L): Alanine scanning mutagenesis results show that two residues, T-LYS-20 position and T-ASP-58 position in soluble tissue factor, act as hotspots. Out of these two, KFC2b could predict only T-LYS-20 as hotspot, whereas PPCheck could identify both these residues as hotspots (Fig. 5A).
Complex between ATP-dependent HSLU protease ATP-binding subunit HSLU and ATP-dependent protease HSLV (PDB ID - 1G3I; interacting chains - A and G/H): Experimental studies reported six residues, A-ASP-438, A-LEU-439, A-ARG-441, A-PHE-442, A-ILE-443, and A-LEU-444, as hotspots. KFC2b could successfully predict only three of them (A-PHE-442, A-ILE-443, and A-LEU-444), whereas PPCheck could predict all the six hotspots (Fig. 5B).
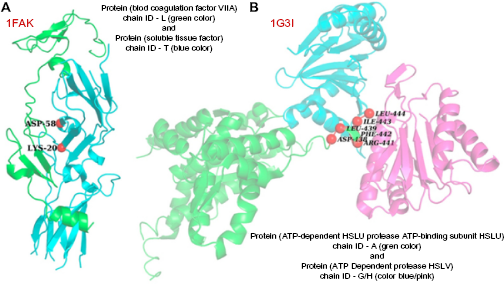
Experimental hotspots that were successfully predicted by PPCheck but were missed by KFC2b. (
Cases where both the programs fared equally well
Complex between EPO receptor and EPO mimetics peptide 1 (PDB ID - 1EBP; interacting chains - A and C/D): Residues A-PHE-93, A-MET-150, A-PHE-205, and C-TRP-13 were found to be hotspots as per alanine scanning mutagenesis results. Both KFC2b and PPCheck could successfully predict three residues each as hotspots for this complex. While KFC2b reported A-MET-150, A-PHE-205, and C-TRP-13 residues as hotspots, PPCheck reported A-PHE-93, A-MET-150, and C-TRP-13 as hotspots (Supplementary File 5).
Unsuccessful cases
Either one or all of the available hotspot prediction programs could successfully predict majority of the hotspots. However, there are some experimentally determined hotspots that could not be predicted by any of the available programs. H-HIS-76 in the complex between DES-GLA factor VII-A (heavy chain) and peptide E-76 (PDB ID - 1DVA; interacting chains - X and H) (Supplementary File 6A), A-ASP-427 in the complex between Nidogen-1 and Basement membrane-specific heparan sulfate proteoglycan core protein (PDB ID - 1GL4; interacting chains - A and B) (Supplementary File 6B), and B-LYS-345 in the complex between beta-catenin and adenomatous polyposis coli protein (PDB ID - 1 JPP; interacting chains - B and D) (Supplementary File 6C) are some of the hotspots that none of the presently available programs could successfully predict. When analyzed in detail, it was observed that all these residues contributed more energy than an average interface residue (normalized energy per residue was greater than 1), but they were found to be exposed (solvent accessibility more than 7%) in the complexed form. These residues were also found to interact with fewer interface residues from interacting partner (ESRI less than 8) and were among moderate or less-conserved amino acids in the proteins. High solvent accessibility (exposed nature of residues in complexed form) and moderate/less conservation of these residues could be the possible reason why these residues could not be predicted by any of the available methods for hotspot prediction. These examples also show that it is informative to apply multiple algorithms for the identification of hotspots and the method with the best statistical measures may not be consistently performing best for every case.
Conclusion
PPCheck is an objective energy scoring scheme to analyze PPIs. It is a valuable resource that can be used for various purposes such as identification of non-covalent interactions at a protein-protein interface, given the coordinates of the two (interacting) chains in a single pdb file. An average docking algorithm generates hundreds of decoys for a given pair of proteins. Most of these generated conformations are incorrect, ie, they do not show any similarity with the native complex. Other successful scoring scheme, such as DockScore, provides scores on a relative basis within the sampled poses and is not meant to recognize cases where all the poses could be incorrect. If more than one software/algorithm is used for obtaining docked complexes, then the complexity of determining the correct pose further increases as the best predicted models by each algorithm can be entirely different. In such cases, PPCheck can be reliably used in differentiating the native-like docking poses from the non-native-like decoys since universal energy ranges have been obtained by studying a large number of protein-protein complexes. 26 PPCheck reported an accuracy of ~60% in differentiating the native-like and non-native-like docking poses over a range of CAPRI targets. Prediction of PPIs and recognition of hotspots at the interface region form the central focus for understanding biochemical pathways and for bioengineering/drug design experiments, respectively. It can also be used to successfully predict the critical residues, hotspots, at the interface, which provides stability and specificity to the complex. PPCheck also finds its application in calculating residue conservation and performing computational alanine scanning. Thus, PPCheck is the only webserver, to the best of our knowledge, which can be reliably used for identifying non-covalent interactions, predicting hotspots at the interface, calculating residue conservation, performing computational alanine scanning, and differentiating native-like and non-native-like docking poses. The availability of PPCheck, which provides objective measures of the strength of interactions, should be valuable.
Author Contributions
Designed the project: RS. Carried out the computational work, including scripting and data analysis: AS. Interpreted the results and included additional features: RS, AS. Wrote the first draft of the manuscript: AS. Provided critical comments to improve the manuscript: RS. Both authors reviewed and approved of the final manuscript.
Supplementary Materials
Supplementary File 1
Table showing best values for strong interactors + medium interactors at CD-HIT word-size of 2, threshold of 0.45, and conservation score of 0.65 or more when applied on earlier studied dataset of 270 protein-protein complexes. An interface is termed as
Supplementary File 2
Detailed explanation of normalized extent of spatial residue interaction (NESRI) and normalized extent of energy contribution (NEEC).
Supplementary File 3
Table showing a set of 40 mutations, selected from Alanine Scanning Energetics database, and their corresponding changes in binding energy as recorded from experimental studies and PPCheck.
Supplementary File 4
True positive rate (TPR) versus true negative rate (TNR) curve for extent of energy contribution (EEC) for 10-fold mixed training dataset. Residues with various “extent of energy contribution” (from 5 to 15) were treated as hotspots in a 10-fold mixed dataset (192 mutations from ASEdb and 126 mutations from BID) in order to select an optimum degree of interaction that can be used in a generalized manner to predict hotspots. Optimum results for hotspot prediction were obtained when top-8 residues with the highest degree of energy (normalized degree of energy more than 1) and normalized degree of interaction more than 1 were treated as hotspots.
Supplementary File 5
Experimental hotspots that were predicted with equal success by both PPCheck and KFC2b. Both PPCheck and KFC2b could successfully predict three of the four experimental hotspots in the complex between EPO receptor and EPO mimetics peptide 1 (PDB ID - 1EBP; interacting chains - A and C/D). While PPCheck predicted A-PHE-93, A-MET-150, and C-TRP-13 as hotspots, KFC2b reported A-MET-150, A-PHE-205, and C-TRP-13 residues as hotspots.
Supplementary File 6
Examples of unsuccessful cases, where some experimentally determined hotspots could not be predicted by any of the available programs. (
Footnotes
Acknowledgments
This work and AS are supported by the Centres of Excellence (CoE), Department of Biotechnology (DBT), India. AS thanks the vice chancellor of SASTRA University for encouragement and support. The authors also thank Anu G. Nair and Oommen K. Mathew for technical assistance and U.S. Raghavender, Prashant Shingate, and Malini Manoharan for useful discussions.