
Abstract
Field effect in cancer, also called “field cancerization”, attempts to explain the development of multiple primary tumors and locally recurrent cancer. The concept of field effect in cancer has been reinforced, since molecular alterations were found in tumor-adjacent tissues with normal histopathological appearances. With the aim of investigating field effects in gastric cancer (GC), we conducted a high-throughput sequencing of the miRnome of four GC samples and their respective tumor-adjacent tissues and compared them with the miRnome of a gastric antrum sample from patients without GC, assuming that tumor-adjacent tissues could not be considered as normal tissues. The global number of miRNAs and read counts was highest in tumor samples, followed by tumor-adjacent and normal samples. Analyzing the miRNA expression profile of tumor-adjacent miRNA, hsa-miR-3131, hsa-miR-664, hsa-miR-483, and hsa-miR-150 were significantly downregulated compared with the antrum without tumor tissue (P-value < 0.01; fold-change < 5). Additionally, hsa-miR-3131, hsa-miR-664, and hsa-miR-150 were downregulated (P-value < 0.001) in all paired samples of tumor and tumor-adjacent tissues, compared with antrum without tumor mucosa. The field effect was clearly demonstrated in gastric carcinogenesis by an epigenetics-based approach, and potential biomarkers of the GC field effect were identified. The elevated expression of miRNAs in adjacent tissues and tumors tissues may indicate that a cascade of events takes place during gastric carcinogenesis, reinforcing the notion of field effects. This phenomenon seems to be linked to DNA methylation patterns in cancer and suggests the involvement of an epigenetic network mechanism.
Introduction
The field effect in cancer, also called “field cancerization”, was first studied by Slaughter and Southwick 1 and attempts to explain the development of multiple primary tumors and locally recurrent cancer. According to this theory, precancerous cells in proximity to tumors have some genetic fingerprints that are present in fully developed tumors.2,3 Recently, epigenetic features, including DNA methylation, histone modifications, and miRNAs, have been described as early events in carcinogenesis.4,5
miRNAs play fundamental roles in multiple biological processes, including cell proliferation, differentiation, and apoptosis. Altered miRNA expression levels may contribute to disease development in humans.6,7 The first characterized miRNAs were shown to be involved in cellular proliferation and death. Several reports link miRNAs to cancer. Human tumors and tumor cell lines exhibit large differences in miRNA expression levels compared with normal tissue.7–9
miRNA expression patterns differ greatly between normal and cancer cells, and miRNAs are promising epigenetic biomarkers in cancer. 8 To understand the pattern of miRNA expression and to identify epigenetic molecular markers of field cancerization in noncancerous tissues, we performed high-throughput sequencing of miRNAs (SOLiD® platform) in paired samples of gastric adenocarcinomas and adjacent non-cancerous tissue and compared the results to those of gastric mucosa.
Methods
Biological material
Four surgically resected gastric adenocarcinomas were analyzed. Paired fresh samples of histologically proven cancer and noncancer samples were collected and frozen in liquid nitrogen immediately after resection. Three tumors were of the intestinal type, according to Lauren classification, and one was of the diffuse type. TNM classification (UICC/International Union Against Cancer) for intestinal tumors is as follows: T1N0M0, T1N1M0, and T4N1M0. The diffuse tumor was a T1N0M0. Every tumor was located in antrum. Adjacent samples were select by a dedicated pathologist, and a mirror slide of each sample was provided to guaranty absence of tumor cells or other pre-neoplastic lesions. Samples were microdissected before sequencing and tumor samples have at least 80% of tumor cells. For comparison, the miRnome of antrum without tumor published by the authors9% was used.
For miRNAs quantitative real-time-polymerase chain reaction (qRT-PCR) validation, 39 fresh tissue samples were collected from patients treated at João de Barros Barreto Hospital/Federal University of Pará, Brazil, distributed as follow: 14 samples of gastric cancer (GC), 4 samples of GC-adjacent tissue, and 21 gastric tissues without cancer.
Clinical data collection
Clinical and anatomopathological data of patients were obtained directly from the records using the Lauren histological classification and staging according to the 7th edition of the pathological TNM staging (UICC/International Union Against Cancer).
Ethics statement
The ethical principles of the Declaration of Helsinki were followed, and written informed consent was obtained from all patients. The study was approved by the Research Ethics Committee of João Barros Barreto University Hospital (Hospital Universitário João Barros Barreto -HUJBB), Federal University of Pará (UFPA) (protocol number 14052004/HUJBB).
miRNA library
Total small RNA was obtained from tissue samples using mirVana Isolation Kit (Ambion Inc., USA). Concentration and quality were determined using a Nanodrop 1000 spectrophotometer, and purification and size selection were performed using 6% polyacrylamide gel electrophoresis. Using SOLiD® small RNA Expression Kit (Ambion Inc., USA), 200 ng of small RNA of 150-200 bp were used as template to obtain the miRNA library. All library miRNAs were tagged with unique and specific amplification primers, known as the barcode system (Life Technologies, CA, USA). Then, 50 pg of the library was pooled with seven other miRNA libraries at the same concentration. A fraction of the library pool (0.1 pg) was amplified and fixed on magnetic beads using emulsion PCR. The ePCR product was deposited on a single slide and subjected to multiplex SOLiD® sequencing reaction.
SOLiD® ultra-deep sequencing and data analysis
The SOLiD® (version 4.0) sequencing system (Life Technologies) was used to generate reads 35 bp long. The second step was to decode the barcodes, matching each bead sequence to the specific sample. All gastric tissues’ small RNA sequences are available at European Nucleotide Archive under accession number ERP004687 and E-MTAB-2273. Sequence analyses were performed using SOLiD® System Small RNA Analysis Tool (Life Technologies) and MiRanalyzer. 10 First, we filtered out all sequences that matched RNA contaminants such as tRNA, rRNA, DNA repeats, and adaptor molecules. After excluding contaminant reads, we aligned all sequences against miRNA precursor sequences using MirBase (version 19) and then included only reads that matched mature miRNA sequences. 11
miRNA qRT-PCR (validation)
To extract total RNA from each sample, High Pure miRNA Isolation Kit (Roche) was used, the solutions were quantified using the Qubit® 2.0 Fluorometer (Invitrogen) and diluted to a final concentration of 4 ng/μL. Then cDNA was obtained using TaqMan® MicroRNA Reverse Transcription Kit (Life Technologies), and qRT-PCR was performed using the TaqMan® MicroRNA Assays in Rotor-Gene Q platform (Qiagen) with TaqMan miRNA assays according to the manufacturer's instructions (Life Technologies). The mean expression level of three human endogenous controls (Z30, RNU19, and RNU6B - calibrators) was used as an internal control in all miRNA experiments to allow for the comparison of expression results. The relative miRNA expression levels were then calculated by the comparative threshold cycle (Ct) method (2-ΔCt).
Data analysis
The betaBin model12,13 was used for differential expression analysis and the results were presented as volcano plots. For these analysis R statistical environment was applied (http://www.r-project.org/). Our data was also compared to the expression data from other human neoplasia imported from microRNA.org database14,15 using a heatmap graphical analysis performed on GenePattern v.3.6.1 (http://genepattern.broadinstitute.org).
Additionally, miRNA expression data from 436 samples were downloaded from The Cancer Genome Atlas (TCGA) stomach adenocarcinoma track. 16 These sample were composed of 395 GC tissues and 41 GC-adjacent tissues. The DESeq217 tool was used to compare these groups.
For qRT-PCR expression analysis, we applied the analysis of variance test to compare the miRNA expression levels between GC, GC-adjacent, and noncancer samples. The pairwise group differences were evaluated by Student's t-test adjusting for multiple testing using a Bonferroni's correction. All statistical tests were performed on IBM SPSS Statistics software (version 20).
Results
After filtering for sequence Quality Value (minimum QV > 10 for the first 10 bases) and performing an alignment with MirBase (version 19), 11 there were 148 mature miRNAs in antrum without tumor mucosa. 9 The number of mature miRNAs in the adjacent nontumor samples varied from 231 to 278, while in the tumor samples 245-372 miRNAs were expressed (Table 1).
Number of mature miRNAs and the total read counts in each sample.

The most highly expressed miRNAs were consistent among all the samples. The profiles of the 20 most highly expressed miRNAs in each group (normal, adjacent, and tumor) were compared to the available expression data from other tissues 18 (Fig. 1).

Heat map of the normalized expression of the most highly expressed mature miRNAs in human gastric tissue compared with other normal tissues from the mammalian microRNA expression atlas. 16
Although we observed a consistent pattern among the most highly expressed miRNAs, many miRNAs were differentially expressed (P-value < 0.001 and fold-change >5) when comparing the adjacent samples to antrum without tumor tissue. Among these miRNAs, hsa-miR-150, hsa-miR-3131, hsa-miR-483, and hsa-miR-664a were exclusively downregulated in the tumor-adjacent samples compared with the antrum without tumor tissue (Figs. 2 and 3).

miRNA expression profile in GC and GC-adjacent tissues compared with healthy tissues. Some miRNAs showed significantly different expression in the two other tissue types, compared with antrum without tumor. (

Comparison of antrum and noncancerous tumor-adjacent samples.
Similarly, some miRNAs were differentially expressed between paired adjacent and tumor samples (P-value < 0.001 and fold-change >5; Fig. 4).

Comparison of paired tumor-adjacent and nontumor samples.
Compared with antrum without tumor mucosa, hsa-miR-3131, hsa-miR-664, and hsa-miR-150 were downregulated (P-value < 0.001) in all paired samples of tumor and tumor-adjacent tissues (Table 2, Fig. 2).
MiRNA expression, normalized by reads-per-million, for simultaneously downregulated paired adjacent tumor and nontumor samples versus antrum without tumor (P-value < 0.001, fold-change > 5).
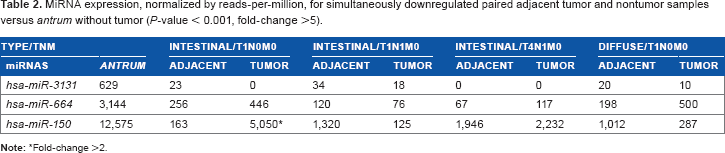
Fold-change >2.
Additionally, some miRNAs were differentially expressed only in certain histological subtypes or specific TNM presentations, compared with antrum without tumor mucosa (Table 3).
miRNAs differentially expressed in specific histological subtypes or TNM presentations.

Many other miRNAs were specifically downregulated in both tumor and tumor-adjacent samples relative to antrum without tumor mucosa. These miRNAs included hsa-miR-26a-1 and hsa-miR-212 in intestinal type T1N0M0, T1N1M0, and diffuse T1N1M0; hsa-miR-93, hsa-miR-3607, and hsa-miR-19b-1 in intestinal T1N0M0; hsa-miR-361 in intestinal T1N1M0s; hsa-miR-483 in intestinal T1N1M0 and T4N1M0; hsa-miR-204 in intestinal T4N1M0 and hsa-miR-142 in diffuse T1N0M0 (Table 3).
To evaluate the differential expression of hsa-miR-3131, hsa-miR-664, hsa-miR-150, and hsa-miR-483 between GC and GC-adjacent tissues, we gather miRNA expression data of 436 samples (395 GC and 41 GC-adjacent tissues) from TCGA stomach adenocarcinoma. 16 Among those samples, no significant expression difference was observed for those miRNA between the group, thus agreeing to our hypothesis of GC field effect.
qRT-PCR
Our results for hsa-miR-3131, hsa-miR-664, hsa-miR-150, and hsa-miR-483 were validated by qRT-PCR on 39 samples (21 noncancer, 4 GC-adjacent, and 14 GC tissues). The hsa-miR-3131 presented too low expression in all samples precluding a more accurate analysis and preventing the translation of its use for future clinical practice. This result was in agreement with both our sequencing data and TCGA.
All other evaluated miRNAs (hsa-miR-664, hsa-miR-150, and hsa-miR-483) were differentially expressed on GC-adjacent samples compared to noncancer samples (P-value < 0.05), while no significant difference was observed between GC and GC-adjacent samples except for hsa-miR-483. Despite the fact that has-miR-150 presented an inverse expression profile in qRT-PCR when compared to the sequencing, the results supported the hypothesis of GC field effect.
Discussion
Most studies to date have compared tumor samples with adjacent nontumor samples to investigate genetic and epigenetic markers and expression patterns of diverse molecules.19–21 This approach, while identifying many potential biological markers, has the bias of regarding tumor-adjacent samples as normal samples. We compared normal tissue samples from noncancer patients to tumor and tumor-adjacent samples in an integrated analysis and found significant differences between normal and tumor-adjacent tissues (Fig. 2), supporting the existence of field effects in cancer. Consequently, tumor-adjacent samples should not be considered normal tissue.
The global number of miRNAs and read counts was highest in tumor samples, followed by tumor-adjacent and normal samples. This phenomenon may indicate that a cascade of events takes place during gastric carcinogenesis, reinforcing the notion of field effects.
Our previous results also showed that a small number of miRNAs account for the majority of miRNA expression in tissues and can delineate tissue signatures. For example, the expression profile of less than 20 miRNAs defines antrum tissue, 9 and a similar situation exists for cardiac tissue.22% These miRNAs are still expressed in tumor-adjacent and tumor samples, although to a far less degree, forming an organ profile. Nevertheless, many other miRNAs seem to be differentially expressed in tumor-adjacent and tumor samples.
These data need to be analyzed from two different perspectives. The first involves looking at specific miRNAs that are differentially expressed among tissues and using them as biomarkers, or even targets, in clinical investigations. This seems to be the common approach but is rarely translated into clinical application. The second approach involves analyzing the entire data set as part of a biological process.
By looking at specific expression patterns, a number of findings were obtained. Some of these findings, as highlighted below, may be potential hallmarks of field effect in GC.
The miRNAs hsa-miR-150, hsa-miR-3131, hsa-miR-483, and hsa-miR-664a are differentially expressed in every tumor-adjacent sample compared to antrum without tumor. This group of miRNAs may indicate the occurrence of field effects in GC because differentiated expression of these regulatory molecules can provide a permissive environment for subsequent events in gastric carcinogenesis. In this context, the potential for clinical application seems high because screening of patients at risk for these markers can improve clinical management.
These miRNAs have been mentioned as biomarkers of a variety of tumors.21–24 Here, we suggest that the simultaneous downregulation of these four miRNAs may be a marker of field effect in gastric carcinogenesis. It is important to note that this finding can only be proven by sequencing the complete miRnome of normal gastric mucosa.
The hsa-miR-150, hsa-miR-483, and hsa-miR-664 were related to various types of cancers such as pancreatic, lung, bladder, leukemia, colorectal, breast, ovarian, hepatocellular, adrenocortical, esophageal, nasopharyngeal, squamous cell carcinoma, follicular lymphoma, prostate, and gastric.25–40
The hsa-miR-150 available data indicate that this miRNA plays different roles depending on cell context due to its highly variable expression pattern. 41 Among the validated target genes, we highlight the TP53, 42 a major tumor suppressor gene. It suggests an important role of hsa-miR-150 in the carcinogenesis process.
The hsa-miR-664 had been related to promoting tumorigenesis and metastasis processes.33,34 Patel et al found greater levels of hsa-miR-483 in patients with adrenal adenocarcinoma, 43 and Qiancheng Song et al reported that upregulation of hsa-miR-483 is correlated with the progression of human lung adenocarcinoma and promotes the epithelial-mesenchymal transition accompanied by invasive and metastatic properties of lung adenocarcinoma. 44 However, further functional studies are still necessary to explore the targets and the exact role of these miRNAs in cancer cell biology.
Based on our results, we propose that miRNA expression profiles are part of a general epigenetic phenomenon, possibly common to diverse biological situations. With respect to epigenetics and cancer methylation patterns, the comparison of normal versus cancer samples reveals a shift to global DNA hypomethylation and specific areas of hypermethylation.45–48
According to this observation, the elevated expression of miRNAs in tumors and adjacent tissues should be linked to DNA methylation patterns in cancer (possibly with histone modification, expression of small RNAs, etc). In normal differentiated tissue, a small number of specific transcripts are produced, and therefore, few miRNAs might be needed for the following steps of epigenetic control. In tumors, global DNA hypomethylation allows high levels of transcription (and also a reduction in specific transcripts). Consequently, the number of miRNAs significantly increases as part of a control mechanism (some are downregulated and linked to hypermethylation sites).
Globally, hypomethylation sites are distributed along regions of repetitive DNA and intronic and exonic regions. In addition to the production of cancer-related transcripts and chromosomal instability, these regions promote miRNA transcription, as most miRNAs are derived from these same areas.
Most studies, including ours, address the expression patterns of specific miRNAs rather than a more general process involving miRNA expression. Further validation of our concept and identification of the main players and controllers of this network could shed light on new epigenetic interference strategies. Additionally, we propose that this epigenetic network might be a common mechanism in many biological conditions, such as proliferation, differentiation, and tissue regeneration.
Conclusion
Using miRNA high-throughput data from normal gastric mucosa, nontumor-adjacent tissue, and GC tissue, the field effect was clearly demonstrated in gastric carcinogenesis by an epigenetics-based approach. Potential biomarkers of the GC field effect were also identified. Analysis of miRNA profile findings versus the current concepts of cancer epigenetics further suggests the involvement of an epigenetic network mechanism in cancer.
Author Contributions
Conceived and designed the experiments: ARS, PA, AS, SS. Analyzed the data: FCM, IGH, ARS, LM, AV, AP. Wrote the first draft of the manuscript: MBA, FCM, PA. Contributed to the writing of the manuscript: IGH, RB, AK, SS, SD, ARS. Agree with manuscript results and conclusions: MBA, FCM, PA, ARS. Jointly developed the structure and arguments for the paper: MBA, FCM, IGH, PA, ARS. Made critical revisions and approved final version: MBA, FCM, PA, ARS. All authors reviewed and approved of the final manuscript.
Footnotes
Acknowledgments
The authors would like to thank the patients who provided samples for the experiments and the staff of the Hospital Universitário João de Barros Barreto who contributed to the realization of this work.