
Abstract
Retinoblastoma (RB) is a primary childhood eye cancer. HMGA2 shows promise as a molecule for targeted therapy. The involvement of miRNAs in genome-level molecular dys-regulation in HMGA2-silenced RB cells is poorly understood. Through miRNA expression microarray profiling, and an integrated array analysis of the HMGA2-silenced RB cells, the dysregulated miRNAs and the miRNA-target relationships were modelled. Loop network analysis revealed a regulatory association between the transcription factor (SOX5) and the deregulated miRNAs imiR-29a, miR-9*, miR-9-3). Silencing of HMGA2 deregulated the vital oncomirs (miR-7, miR-331, miR-26a, miR-221, miR-17∼92 and miR-106b∼25) in RB cells. From this list, the role of the miR-106b∼25 cluster was examined further for its expression in primary RB tumor tissues (n = 20). The regulatory targets of miR-106b∼25 cluster namely p21 (cyclin-dependent kinase inhibitor) and BIM (pro-apoptotic gene) were elevated, and apoptotic cell death was observed, in RB tumor cells treated with the specific antagomirs of the miR-106b∼25 cluster. Thus, suppression of miR-106b∼25 cluster controls RB tumor growth. Taken together, HMGA2 mediated anti-tumor effect present in RB is, in part, mediated through the miR-106b∼25 cluster.
Introduction
Computational tools are widely used to complement biological investigations, especially in global gene expression analysis and high throughput assays. Advanced computational analyses such as integrated analyses of mRNA and miRNA expression, provide information on several regulatory networks in cancers, 1 including retinoblastoma (RB), a peadiatric ocular tumor. The identification of these molecular networks could implicate potential genes and miRNAs that may behave as biomarkers. It will also help better understand RB biology and clinical management.
RB is a childhood cancer that arises from the primitive retinal layer. The current management is enucleation (removal of eye in childhood), chemotherapy and/or focal therapy. Targeted therapy is gaining importance in the management of RB. 2 4 Gene expression profiling of RB tumors has helped to characterize cell signalling and the molecular pathways involved in its pathogenesis. 5 7 Earlier reports on relative miRNA profiling between normal and RB tumor tissues, and global gene dys-regulation studies (HMGA2, Tiam 1, EpCAM) have indicated several aberrant miRNAs and their regulatory genes. 8 15
We had earlier reported that silencing of HMGA2 reduced cell proliferation in cultured RB cells. 12 HMGA2, a non-histone chromosomal protein, is highly expressed during embryogenesis and in various malignant tumors including RB.16,17 This protein contains structural DNA binding AT-rich domains, and at the C-terminus these domains undergo conformational change due to their interaction with the B form of DNA. This conformational change plays a crucial role in the transcriptional regulation of other proteins which are also involved in the epithelial mesenchymal transition (EMT) pathways. 18 Over-expression of HMGA2 protein is seen in several malignancies and may be due to the suppression of miRNAs, namely miR-15, miR-16, miR-19619,20 and lef-7. 21 In a study on pituitary tumors, E2F1 activation through displacement of HDAC1 by HMGA2 resulted in pRB inactivation. 22
Reports from, in vivo and in vitro studies have demonstrated a reduction in cell proliferation in various cancers including RB by blocking the HMGA2 protein synthesis using antisense methodology.22,23 Our previous study, 12 implicated changes of several abnormal gene networks including mitogen-activated protein kinase (MAP) kinase, JAK/STAT, Ras pathway, Ras induced ERK1/2 and tumor protein 53 (p53) dependent pathways in HMGA2 silenced RB cells.
In the present study, using computational and experimental tools, the role of dys-regulated miRNAs in HMGA2-silenced retinoblastoma (RB) cells was investigated. Their association with the gene targets have been analysed using integrated array analysis. The specific role of miR-106b-25 cluster in RB has also been examined.
Materials and Methods
Primary RB Tumor Samples
Fresh frozen tumor samples were collected from 20 enucleated eyeballs of RB patients reported at Larsen and Toubro Department of Ocular Pathology, Medical Research Foundation, Sankara Nethralaya as part of RB management (2010-2011) and utilised for research purpose. The Institutional Ethics Committee of Vision Research Foundation, Sankara Nethralaya (Chennai, India) has reviewed and approved the study (Institutional ethics clearance number: 2009-146p). Fresh adult retinae were collected from 3 cadaveric eyeballs (received at C.U Shah eye bank, Medical Research Foundation Sankara Nethralaya, http://www.sankaranethralaya.org/eye-bank.html). The collected tumor samples and the normal retinae were snap frozen in liquid nitrogen and stored at −80 °C until further use.
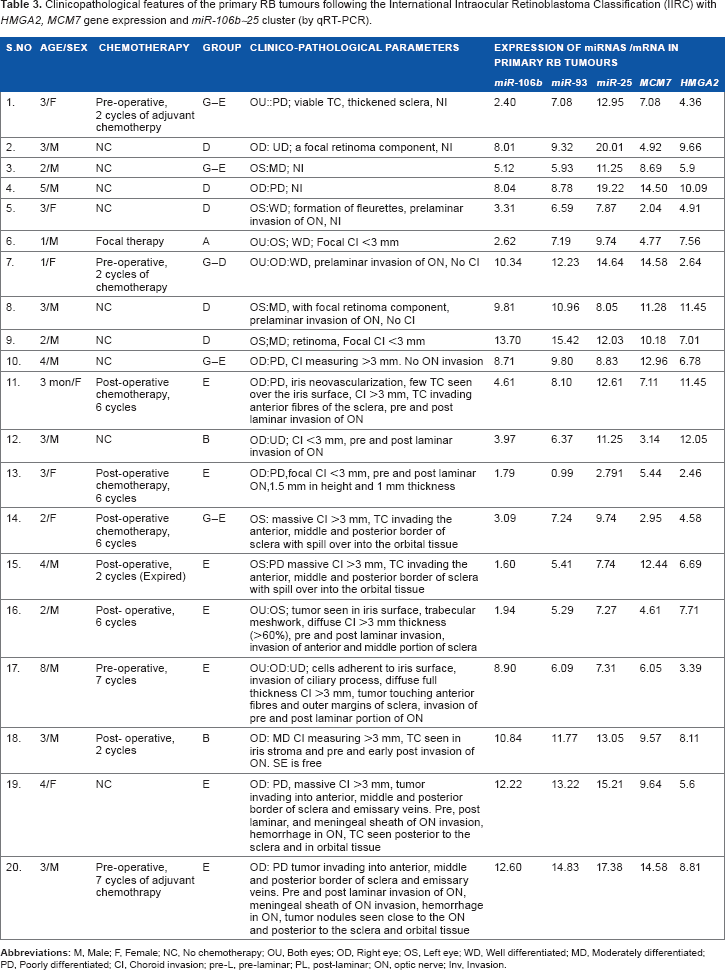
The haematoxylin and eosin stained RB sections were reviewed microscopically and graded by an ocular pathologist (S.K). The clinico-pathological features tabulated in Table 3 are based on the tumor invasion of the choroid, optic nerve or orbit. These RB tumors were recorded as per the report by Sastre X et al. 24
Cell Culture
Human RB cell lines (Y79, Weri Rb1, Riken cell bank, Japan) were used as in vitro model to study the significance of the HMGA2, hsa-miR-106b-25 clusters in RB. The RB cell lines were cultured in RPMI 1640 medium (Gibco-BRL, Rockville, MD, USA) supplemented with 10% heat-inactivated FBS (Gibco-BRL, Rockville, MD, USA), 0.1% ciprofloxacin, 2 mM L-glutamine, 1 mM sodium pyruvate, and 4.5% dextrose (Sigma Aldrich, St. Louis, MD, USA) and grown in suspension at 37 °C in a 5% CO2 incubator.
Transient Transfection in RB cells (Y79, Weri Rbl)
The transfection method of silencing HMGA2 using Human HMGA2 siRNA (Hs_HMGA2_6 catalogue number SI03029929: forward strand: 5′-CGGCCAAGAGGCAGACCUATT-3′ and the reverse strand: 5′-UAGGUCUGCCUCUUGGCCGTT-3′, Qiagen, Santa Clara, CA, USA) in RB cells (Y79, Weri Rbl) was carried out as reported earlier. 12
MicroRNA Profiling
The small RNAs were extracted from the HMGA2-silenced RB (Y79) cells using miRVANA kit (Ambion, Foster city, CA, USA) following manufactures protocol. The quantity of RNA was measured by Nano Drop spectrophotometer and the quality of small RNA was assessed using Agilent 2100 bioanalyzer. The extracted total RNA sample was diluted to 50 ng/ul in nuclease free water. About 100 ng of total RNA was dephosphorylated along with appropriate diluted Spike-In control (Agilent Technologies, microRNA Spike-In Kit, Part Number 5190-1934) using Calf Intestinal Alkaline Phosphatase (CIP) master mix (Agilent Technologies, Part Number: 5190–0456) by incubating at 37 °C for 30 min. Following the dephosphorylation, miRNA samples were denatured by adding dimethylsulfoxide and heated at 100 °C for 10 min and transferred to ice-cold water bath. The miRNA labeling was performed using miRNA Complete Labeling and Hyb Kit (Agilent Technologies, Part Number: 5190–0456). The Ligation master mix containing Cyanine 3-pCp was added to the denatured miRNA samples and incubated at 16 °C for 2 hours. The Cyanine 3-pCp labeled miRNA samples were dried completely in the vacuum concentrator (Concentrator Plus, Eppendorf, Germany) at 45 °C to 55 °C for 2 hours. The dried sample were resuspended in nuclease free water and mixed with Hybridization Mix containing blocking solution and Hi-RPM Hybridization Buffer and incubated at 100 °C for 5 min followed by snap chill immediate cooling on ice for 5 min. The samples were hybridized on the Human_miRNA_version 3.15 × 8 array. The hybridization was carried out at 55 °C for 20 hours. After hybridization, the slides were washed using Gene Expression Wash Bufferl (Agilent Technologies, Part Number 5188–5325) at room temperature for 5 min and Gene Expression Wash Buffer 2 (Agilent Technologies, Part Number 5188-5326) at 37 °C for 5 min. The slides were then washed with acetonitrile for 30 seconds. The microarray slides were then scanned using Agilent Scanner (Agilent Technologies, Part Number G2565CA).
Data Analysis of Microarray
The miRNA microarray profiling of the transiently HMGA2-silenced RB cells using Human miRNA Microarray (V3), 8 × 15K chip was performed in two replicates to identify a spectrum of deregulated cellular miRNAs. Intra-array normalization was done using 90th percentile and baseline transformation was done to the median of all the samples. Volcano plot based method was used to identify miRNAs that were 2.0 fold differentially expressed between siRNA-treated and untreated, (P-value ≤ 0.05 was calculated by unpaired Student's t-test and Benjamini Hocheberg based FDR correction). Unsupervised hierarchical clustering of differentially expressed miRNA were done using Pearson uncentered distance matrix and average linkage rule to establish gene clusters that differentiate the two groups (Fig. 1A shows the scatter plot for the top 100 dysregulated miRNAs). Predicted and validated targets of differentially expressed miRNAs was obtained using Microcosm database (www.ebi.ac.uk/microcosm/). Further, significant biological analysis of the non-redundant list of gene targeted by differentially expressed miRNA was performed using DAVID functional annotation tool. Statistically significant Gene Ontology and pathways that were enriched with a corrected P value of ≤0.05 and an FDR of ≥2.0 were chosen for regulatory network modelling. Significantly regulated genes, miRNA along with Gene Ontologies and pathways were provided as input to Bridgelsland Software (Bionivid Technology Pvt Ltd, Bangalore) to obtain the nodes and edges information. Further, Cytoscape V 2.8.1 was used to model the regulatory network.

The miRNA expression profile in HMGA2 siRNA treated Y79 cells.
Transfection of hsa-miR-106b-25 Cluster Antagomirs in RB Cells
Transient transfections of hsa-miR-106b-25 cluster antagomirs (anti-miR-106b, anti-miR-93, anti-miR-25; Thermo scientific, Dharmacon, Lafayette, CO, USA) were carried out in RB cells. The antagomirs for the mature miRNA sequences are: hsa-miR-106b, 5′-UAAAGUGCUGACAGUGCAGAU-3′ (catalogue number: IH-300649–07–0005), hsa-miR-93, 5′-CAAAGUGCUGUUCGUGCAGGUAG-3′ (catalogue number: IH-300512–08–0005), hsa-miR-25,5′-CAUUGCACUUGUCUCGGUCUGA-3′ (catalogue number: IH-300498–07–0005). The scrambled miRNA sequence used in the study is 5′-GCAACGAUGGUCCAACACCUCGGCC-3′ (Thermo scientific, Dharmacon, Lafayette, CO, USA).
Quantitative Real Time PCR
Total RNA was isolated from HMGA2 mRNA expressing primary RB tumor tissues (n = 20) and RB cells (Y79, Weri Rb1: anti-miR treated and untreated cells, scrambled miRNA treated cells) using TRIZOL reagent (Life Technologies, Carlsbad, CA, USA). The extracted total RNA was treated with TURBO DNase to remove the genomic DNA (Ambion, Genetix Biotech Asia Pvt. Ltd., New Delhi, India). A RT-master mix (15 μL) containing 100 ng of total RNA (5 μL), 100 mM dNTPs (0.15 μL), 50 U/μL MultiScribe™ Reverse Transcriptase, (1.00 μL), 20 U/μL RNase Inhibitor (0.19 μL) and nuclease-free water (4.16 μL) was prepared. The prepared reaction volume was incubated in a thermal cycler programmed for the an initial hold for 30 minutes at 16 °C, followed by a second hold for 30 minutes at 42 °C, followed by a third hold for 5 minutes at 85 °C and a final hold at 4 °C.
The gene expression assays for HMGA2 (Hs00171569_m1), GAPDH(Glyceraldehyde-3-phosphate dehydrogenase; endogenous control for gene; Hs99999905_ml), hsa-miR-106b-25 family, hsa-miR-106b (Catalogue number RT 442), hsa-miR-93 (catalogue number: RT 1090), hsa-miR-25 (Catalogue number: RT 403) and miRNA assay control RNU6B (Catalogue number: RT 0011093) were purchased from Applied Biosystems (Lab India, Chennai, India). Normalization of the HMGA2 gene expression was performed with GAPDH, which was determined using pre-developed assay reagents (Applied Biosystems, Bangalore, India). The PCR reaction was performed in 20 μl volume containing 1 μl (100 ng) of the sample cDNA, universal PCR master mix (Taqman, ABI Applied Biosystem, Bangalore, India) and probes for gene/miRNA according to the manufacturer's instructions. The relative expression of the gene in each sample was analysed in triplicates and the miRNA expression in transfected RB cells was analysed in duplicates. The PCR protocol using Taqman probes was performed as follows: 2 min at 50 °C, 10 min at 95 °C followed by 40 cycles of 15 sec at 95 °C and 1 min at 60 °C. Commercial software (SDS version 1.3, ABI, Bangalore, India) was used to determine relative expression of genes/miRNAs after normalisation with cadaveric retina (non-neoplastic tissue control). The relative expression values for HMGA2 gene expression were normalized to the GAPDH and miRNA (hsa-miR-106b-25) expressions were normalized to the RNU6B. Fold change in relative gene expression are expressed as log2 fold change.
Cell Proliferation Assay
Five thousand RB cells (Y79 and Weri Rbl) were plated in 96 wells plate at day 0. On day 1, the cells were transfected with 100 μl of serum free RPMI medium containing 50 pmol of antagomirs and 0.5 μl of Lipofectamine™ transfection reagent (Invitrogen, Darstadt, Germany). The cells were incubated for 24 hours, 48 hours and 72 hours respectively. At the end of the incubation period, serum free RPMI medium containing 5 mg/ml of 3-(4,5-Dimethylthiazol-2-yl)-2,5-diphenyltetrazolium bromide (MTT; Sigma Aldrich, St. Louis, MD, USA) was added to the wells, and the cells were incubated at 37 °C for 4 hours. Following incubation, 100 μl of MTT solubilization solution DMSO (Sigma Aldrich, St. Louis, MD, USA) was added, and the cells were incubated at 37 °C for 10 min. Absorbance measurements were made using a spectrophotometer (Beckman Coulter India Private Ltd, New Delhi, India) at 562 nm, and the background was subtracted at 562 nm.
Immunoblotting
The protein lysate from antagomirstreated and untreated RB cells were prepared using RIPA buffer containing 50 mM Tris-HCl (pH 7.6), 5 mM EDTA, 150 mM sodium chloride, 0.1% PMSF and 250 μl of protease inhibitor cocktail (1 mg/ml). A total protein of 50 μg was resolved by using 12% SDS-PAGE followed by electrophoretic transfer onto the nitrocellulose membrane at 100V for 1.5 hours. The membranes were incubated with primary antibodies for human BIM (1:1000; catalogue No: H-191, Santa cruz, USA), human p21 (1:1000; catalogue No: SC-6246, Santa Cruz Biotechnology, CA), ß-actin (1:5000; Sigma Aldrich, St. Louis, MD, USA) overnight at 4 °C followed by 2 hours of incubation with appropriate anti-mouse horseradish peroxidase-conjugated secondary antibodies. After three intermittent washes for 30 mins each with TBST containing 0.5%Tween-20, the membranes were subjected to chemiluminescence detection method (Supersignal West Femto Maximum Sensitivity Substrate, Pierce Technologies, Germany). To determine the fold-change in the expressions of BIM and p21 proteins in the individual samples, the intensities of the bands were calculated using Quantity One, version 4.7 software in GS 800 calibrated Densitometer (Bio Rad, Gurgaon, Haryana, India) followed with normalization with the respective ß-actin expression.
Flow Cytometry
Flow cytometric analysis was performed on RB cells following transfection. About 2 × 10 5 cells were plated in 24 wells plate, transfected with 50 pm of antagomirs to all the three miRNAs (hsa-miR-106b-25 cluster). Flow cytometric analyses were performed after 48 hours of transfection, using the Annexin V-fluorescein isothiocyanate (FITC) Kit for apoptosis analysis according to the manufacturer's protocol (BD Biosciences, Gurgaon, India).
Scratch Assay
After transfection of RB cells (1 × 10 5 cells/96 well plate), a single uniform scratch was made once a confluent monolayer was attained. 25 The wells were then washed with PBS to remove the detached cells. Media was added to the culture immediately before taking the images. The area of scratch infiltrated by migrating cells at 0 hour, 24 hours and 48 hours of incubation in the experimental groups were calculated using Image J software (Image J, NIH, USA). The difference in area of migration between these time points and their 0 hour area was noted. The average area covered by the treated RB cells relative to untreated RB cells was expressed as percentage of migration at 24 hours and 48 hours of durations.
Statistical Analysis
ANOVA (Post Hoc, Dunnett t-test) was used to compare the controls and test variables for cell proliferation using SPSS software (version 12.0). Paired student's t-test was used to compare the untreated and treated experiment groups for scratch assay. Values expressed for cell proliferation, apoptosis and scratch assay are mean ± SD of at least three experiments. They were considered statistically significant at P ≤ 0.05.
Results
miRNA Expression in HMGA2-Silenced RB (Y79) Cells
The miRNA expression analysis in Y79 cells revealed 188 differentially expressed miRNAs. These differentially regulated miRNAs (supplementary file 1) include 86 up-regulated and 102 downregulated miRNAs. The family cluster classification of up-regulated miRNAs using TAM tool 26 (http://202.38.126.151/hmdd/tools/tam.html) revealed three main clusters: hsa-miR-let7e clusters (miR-99b, miR125a), hsa-miR-506 cluster (miR-513a, miR-513b, miR-513c), and hsa-miR-1283 cluster. Functionally, the filtered 82 up-regulated miRNAs were found to be involved in the activation of the caspase cascade (miR-150, miR-155), angiogenesis (miR-150) and activation of apoptosis, cell cycle regulation (miR-494, miR-150, and miR-155), cell proliferation (miR-150), and tumor suppression (miR-125a, miR-150, and miR-155). From this, it appears that miR-150 and miR-155 expressions are common to the key regulatory cellular functions in RB.
The downregulated 102 miRNAs were categorized into 15 families using TAM tool. Table 1 lists the various miRNA clustering in the specific families along with their function. The suppression of hsa-miR-17 cluster, its paralogs, hsa-miR-106a cluster, hsa-miR-106b cluster, hsa-miR-23b family, hsa-miR-130 family following the silencing of HMGA2 oncogene indicates a positive regulation of these miRNAs by HMGA2. The pathway analysis of these dysregulated miRNAs using TAM tool revealed the down regulation of AKT pathway (P < 0.001). The miRNA involved in this pathway was determined as miR-20a, miR-18a, miR-7, miR-17, miR-19a, miR-331, miR-19b, miR-26a, miR-92a, miR-21 and miR–221. The functional annotations of these deregulated miRNAs are found to be involved in angiogenesis, apoptosis, cell cycle regulation, cell differentiation, cell proliferation, tumor suppression and oncomirs. These data have been submitted to the NCBI: GEO data base (GSE51696).
The list of miRNAs de-regulated in the post- HMGA2 RB cells (Y79) revealed in the microarray analysis and their functional annotations.

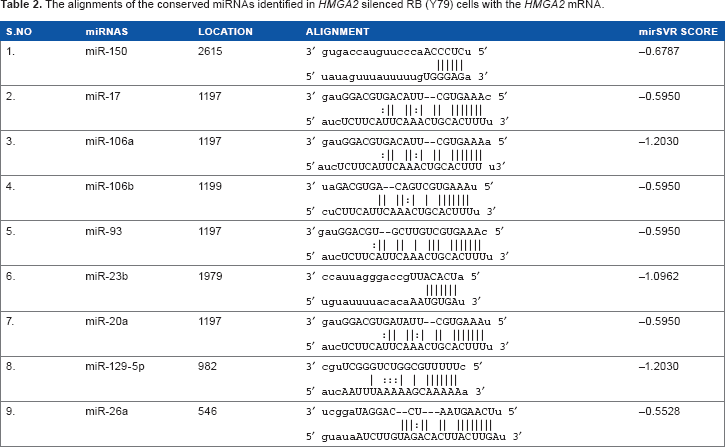
The sequence alignment of the HMGA2 mRNA with the conserved miRNAs described above was carried out using the online tool: microRNA.org-Targets and expression (www.microRNA.org) to confirm its regulatory networks. The output of this analysis has been tabulated in Table 2. Among this list, we could identify the suppression of two oncomir families–hsa-miR-17-92 cluster and hsa-miR-106b cluster with good miR-SVR scores, which are also found in other cancers, including RB.8,11,27
The alignments of the conserved miRNAs identified in HMGA2 silenced RB (Y79) cells with the HMGA2 mRNA.
Integrating Differentially Expressed miRNAs and Their Gene Targets in HMGA2 Silenced RB Cells
To understand the interactions between the dysregulated miRNAs and the genes involved in cancer progression, a computational approach was adopted. The dysregulated genes in HMGA2 silenced Y79 cells obtained from cDNA microarray analysis (published earlier [13]) may be referred to at the NCBI: GEO database (GSE31687).
The present analysis revealed a total of 337 genes that are under the regulatory control of dysregulated miRNAs in HMGA2-silennced RB cells (Fig. 1B). Biological networks were generated by connecting the nodes (genes) and edges (type of regulation) based on Microcosm Database. The BAN shows some highly interconnected genes and their regulatory miRNAs (Supplementary file 2). These networks are vital for tumorigenesis and cancer control (Fig. 1B).
Interestingly, we observed elevated numbers of cell cycle genes with a positive correlation to miR-17∼92 cluster and its paralog miR-106b∼25 cluster. While the biological role of the miR-17∼92 cluster has been reported in RB tumorigenesis,8,11,28 the functional role of the miR-106b∼25 cluster in RB is not understood. The present study, therefore, attempts to characterize the miR-106b∼25 cluster in primary RB tissues, and in HMGA2-silenced RB cells.
Analysis of Transcription Factors, mRNA-miRNA Feed Forward Loops (FFL) and Feed Backward Loops (FBL) in HMGA2 Silenced RB cells
In order to evaluate the interactions between transcription factors, genes (mRNA) and miRNAs, we carried out the feed forward and feed backward loop analysis based on data obtained from Circuits Database. 29 The supplementary file 3 shows the loops obtained with high significance (corrected P value ≤ 0.05) in genes and miRNA expression levels. Enriched loop connections were visualized using Cytoscape V 2.8 with nodes coloured by their fold change (Fig. 2B). Transcription factors that were shown to regulate the differentially expressed miRNA and mRNA were identified based on its role in promoting tumorigenesis. Among these loops, we observed that the key transcription factor, SOX5, is regulated by the miRNAs–hsa-miR-29a, and hsa-miR-9 family (hsa-miR-9*, hsa-miR-9-3). This has been analyzed with the corresponding dysregulated genes, as given below.

Schematic representation for the overall steps in the determination of de-regulated miRNAs in HMGA2 silenced Y79 cells: (a) Silencing of HMGA2 in the RB cells (Y79) using synthetic oligos using RNAi method, (b) mRNA transcripts and miRNA expression levels were profiled using microarray, (c) Integration of significantly dysregulated mRNA transcripts with its regulatory miRNA was annotated, (d) Hierarchical cluster of the GO functions of the up/down regulated genes by the 3 miRNAs of miR-106b∼25 cluster; (e) The number of up-regulated and the downregulated genes targeted by the miR-106b∼25 cluster and (f) Network analysis (Feed Forward Loop (FFL)/Feed Backward Loop(FBL) was annotated.
Network Regulation between SOX5, hsa-miR-29a and TFs/Genes
The predicted regulatory networks between SOX5, miR-29a and the other key regulatory transcription factors/genes derived from the integrated array in HMGA2-silenced RB cells shows the up-regulation of IRF1 (gene involved in nuclear apoptosis), 30 CDX2 (tumor suppressor gene), 31 SPARC (apoptosis mediator and chemo-sensitizer), 32 NAV3 (navigator gene), 33 CREG1 (involved in cellular senescence) 34 and downregulation of NASP (involved in cell growth arrest). 35
Network Regulation between SOX5, hsa-miR-9* and RIT1 Gene
In this network, the downregulation of RIT1, an oncogene 36 mediated through SOX5 and hsa-miR-9* may be a part of the molecular dys-regulation contributing to the arrest of cell proliferation in the HMGA2-silenced RB cells.
Network Regulation between SOX5, hsa-miR-9-3 and TFs (AREB6/ZEB1, CDP, and ANP32B)
The present analysis reveals the link between SOX5, hsa-miR-9-3, and the downregulated genes–AREB6/ZEB1, CDP (transcription factors), 37 ANP32B (negative regulator of caspase 3). 38 These gene downregulations were observed with the concomitant induction of the pro-apoptotic gene BNIP3L. These results explain in part the contributors to cell growth arrest in HMGA2 silenced RB cells.
The current FFL analysis has predicted the various networks existing between the SOX5, miRNAs (hsa-miR-29a, hsa-miR-9* and hsa-miR-9-3) and the key regulatory genes (Fig. 2B). These predicted outcomes can be experimentally validated.
Experimental Validation to Understand the Role of miR-106b∼25 Clusters in RB
The BAN results clearly implicated the dys-regulation of miR-106b∼25 cluster in HMGA2 silenced RB cells. In order to understand the role of miR-106b∼25 in RB tumorigenesis, the following experiments were performed: (a) Assessment of miR-106b∼25 cluster expressions in primary RB tissues (discussed in section 3.4.1), and (b) Implication of miR-106b∼25 in RB cancer cell proliferation using specific antagomirs (discussed in sections 3.4.2-3.4.5).
The miR-106b∼25 Cluster, Its Direct Target MCM7 are over Expressed in RB Primary Tumors
Initially, to understand the role of miR-106b∼25 cluster in RB, the expression of this miRNA cluster was determined in RB primary tumors (n = 20), using qRT-PCR. The median fold change of miR-106b, miR-93, miR-25 and MCM7 were 6.56, 7.67 and 11.25 and 7.9 respectively. Relative to donor retina control, miR-106b∼25 cluster was over expressed in most of the RB tumor samples: miR-106b: 17/21 (85%), miR-93: 19/21 (95%), miR-25: 21/21 (100%), and MCM7: 21/21 (100%) of positivity (Fig. 3). Among the cluster, miR-106b and miR-93 showed a significant difference (P ≤ 0.05) between the invasive and no invasive RB tumors while no significant difference was observed based on tumor differentiation and status of chemotherapy. This reveals the presence of the oncogene MCM7 and its resident intronic miRNAs (miR-106b-25 clusters) in RB tumors.

Expressions of miR-106b∼25 cluster and MCM7 in primary retinoblastoma tumors (n = 20).
Silencing of miR-106b∼25 Cluster Using Antagomirs Down-Regulates HMGA2 and MCM7 Oncogenes
The link between miR-106b∼25 clusters and its gene target (HMGA2) was further established using the short antisense oligos (antagomirs) against the individual miRNAs of this family. A transient transfection with these antagomirs was induced in the RB cell lines resulting in the downregulation of miR-106b∼25 cluster (fold change in the order miR-106b, miR-93 and miR-25): −6.68, −6.60, −10.26 versus untreated cells and a fold change: −4.96, −4.48, −8.06 versus scrambled miRNA-treated control) in Y79 cells (Fig. 4A). In Weri Rb1 cells, we observed the suppression of miR-106b∼25 family in the order miR-106b, miR-93 and miR-25: −8.27, −6.17, 7.06 compared with untreated cells and fold change of −5.88, −7.77, −6.17 (in the order miR-106b, miR-93 and miR-25) compared with scrambled miRNA-treated control (Fig. 4B). The expression of miR-106b∼2S family in the RB cells treated with the mixture of all the 3 antagomirs showed a down regulation of by a fold change in the order miR-106b, miR-93 and miR-25: −1.79, −7.34, −6.51 in Y79 cells and −8.15, −4.50, −6.07 in Weri Rbl cells, respectively (Fig. 4A and 4B).

Differential miRNA (miR-106b∼25 cluster) levels in antagomirs-mix treated RB cells.
After antagomirs transfection (miR-106b, miR-93, miR-25 and mixture) in RB cells, the HMGA2 gene was downregulated by −2.20, −1.89, −1.74, −2.24 fold change in Y79, and by a fold-change of −1.03, −0.71, −1.6, −0.33 in Weri Rbl cells respectively (Fig. 5A). The suppression of HMGA2 transcripts confirms the regulation of these oncogenes by miR-106b∼25 clusters. The downregulation of MCM7 to a fold change −3.51, −1.04, −9.48 and −0.06 in log2 fold change was observed in anti-miRs (miR-106b, miR-93, miR-25 and mixture) treated Y79 cells and −1.72, −2.55, −1.25, −3.03 log2 fold change in anti-miRs (miR-106b, miR-93, miR-25 and mixture) treated Weri Rbl (Fig. 5B). Further we probed the role of this miRNA family in mediating RB cell proliferation.

Differential expressions of HMGA2 and MCM7 in antagomirs treated RB cells.
Role of the miR-106b∼25 Cluster in RB Cell Proliferation and Cell Apoptosis
The MTT assay and Annexin V fluorescence binding assay results reflected the effects of the anti-miR-106b∼25 cluster in RB cells. The Figure 6 (A and B) shows decreased cell proliferation compared to the untransfected RB cells at the end of 24 hrs, 48 hrs, and 72 hrs. At the end of 48 hrs, the percentage of viable cells in the antagomirs treated RB cells in comparison with untreated cells in the order of miR-106b, miR-93, miR-25 and mix were (i) Y79 cells: 67.52%, 64.87%, 64.72%, 67.68%; (ii) Weri Rbl: 66.37%, 68.44%, 64.46%, 66.09% respectively. Moreover, the Annexin V flourescence staining and FACS analysis showed an increased level of apoptosis significantly in the RB cells transfected with the anti-miRs compared to the untransfected RB cells (Fig. 6C, 6D, 6E). The average percentage of early apoptotic cells induced at the end of 48 hrs in the anti-miRs treated RB cells (in the order of untreated control, miR-106b, miR-93, miR-25 and the mix) are (i) Y79 cells: 1.2%, 33.54%, 28.00%, 38.91%, 31.02%; (ii) Weri Rbl: 0.22, 39.86%, 39.82%, 38.417%, 22.09% respectively. These results suggest that these miRNAs promote the cell proliferation and suppresses the apoptosis in RB cells (Y79 control: 1.2%, Weri Rb1 control: 0.22%).

Reduction in RB cell proliferation in anti-miRs (miR-106b∼25, mix) treated cells: The anti-miRs treated Y79 (
Role of the miR-106b∼25 Cluster in RB Cell Growth and Cell Migration
To further understand the role of the miR-106b∼25 cluster in cell growth and cell invasion, the scratch assay was carried out in the antagomirs-transfected and untransfected RB cells. The average area of scratch invaded by the Y79 cells in the order (untreated, antagomirs treated: miR-106b, miR-93, miR-25) at the end of 24 hrs: 17.91%, 10.6%, 9.4%, 9.79% and 48 hrs 25.25%, 4.5%, 4.18%, 4.81% respectively. The average area of scratch invaded by the Weri Rbl cells in the order (untreated, antagomirs treated: miR-106b, miR-93, miR-25) at the end of 24 hrs: 34.71%, 19.96%, 15.33%, 14.31% and 48 hrs 36.16%, 19.28%, 11.15%, 9.06% respectively. These experiments showed a marked reduction in migrating cell populations in the antagomirs transfected RB cells (Fig. 7A and 7B), suggesting that the miR-106b∼25 cluster is involved in RB tumor progression. 25

Influence of miR-106b∼25 cluster antagomirs on cell migratory behaviour in RB cells: Photomicrographs show the migratory behaviour between the untreated and antagomirs treated Y79 (
miR-106b∼25 Clusters Mediates Cell Cycle by Downregulating the Expression of p21 and BIM in RB
The expression of apoptotic proteins–p21 and BIM (direct targets of miR-106b and miR-25 39 ) was measured in the anti-miR-transfected RB cells by immunoblot analysis (Fig. 8A and 8B). This experiment revealed the increase in p21 and BIM protein levels in the antagomirs transfected RB cells compared to the untransfected RB cells. This indicated the apoptotic mechanisms, in part, regulated through the miR-106b∼25, and its relationship with the oncogene HMGA2.

Western blot of p21 and BIM proteins in antagomirs treated cells: The western analysis of p21 and BIM proteins in Y79 (
Discussion
HMGA2 induced miRNA-gene regulatory pathways in RB:
We explored the global miRNA expressions in HMGA2-silenced RB cells. Through an integrated miRNA-mRNA expression analysis, we were able to correlate the dys-regulated miRNAs and corresponding mRNAs (genes) that are involved in various cellular processes (Fig. 2A). The study mainly focuses on the dysregulated miRNAs which have been reported to play a vital role in cancer development (Fig. 9) and their roles in HMGA2-silenced RB cancer cells. 40 42

Schematic representation of the key dysregulated genes and the miRNAs in the post-HMGA2 silenced RB cells contributing to apoptosis and cell proliferation arrest. (
The HMGA2 siRNA treatment induced up-regulation of miR-125a, miR-150, miR-155, and miR-494 which may contribute to cell growth arrest in RB tumor cells through alterations in expression of cancer regulatory genes. miR-125a, known as a tumor suppressor, regulates ERBB oncogene (ERBB2 and ERBB3) via ERK1/2 and AKT phosphorylation. The suppression of this oncogene, through the over-expression of miR-125a was reported to alter the cancer cell phenotype of SKBR3 cells (ERBB2-dependent human breast cancer cell line). 43 miR-125a has also been suggested as a prognostic and therapeutic marker in gastric cancers. 44 High expression of ERBB3, along with the dys-regulation of AKT pathway has also been reported in RB earlier. 45 These studies strongly indicate that one of the mechanisms of HMGA2-silencing mediated RB cell death could be through the over expression of miR-125a (and subsequent oncogene modifications).
miR-150 is reported as a tumor suppressor in lymphoma 46 and corticotropinomas. 47 Watanabe et al. 46 showed that miR-150 directly downregulated the expression of gene targets DKC1 and AKT2 while increasing that of the tumor suppressors, Bim and p53 in lymphoma. This is in line with the present finding of over-expressed miR-150, along with increased level of Bim protein (Fig. 8A and 8B), and our earlier finding of elevated p53 proteins 12 in HMGA2-silenced RB cells. These findings strongly point to the tumor suppressor mechanisms of miR-150 induced by the silencing of HMGA2 gene in RB.47,46 The up-regulated miR-155 in the current study has been previously reported to reverse EGF-induced epithelial-mesenchymal transition (EMT) resulting in inhibition of proliferation, metastasis, invasion, and contributing to increase cisplatin sensitivity in cervical cancer cells. 48 miR-494 is reported to induce cellular senescence by suppressing IGF2BP1 in lung cancer cells. 49 Thus, the up-regulation of miR-155 (fold change = 7.421) and miR-494 (fold change = 2.421) can be linked to cell growth arrest in post-HMGA2 silenced RB cells.
The HMGA2 siRNA treatment has induced downregulation of major oncomirs such as such as miR-21, miR-9, miR-221 and the 2 major families miR-17∼92 cluster and its paralogs miR-106a∼363 and miR-106b∼25 clusters.
miR-21 is known to be an oncomir with its regulatory target genes involved in tumor invasiveness and microvascular proliferations in cancers such as glioblastoma, breast cancer, pre-cell lymphoma. 50 53 The gene targets RECK (a matrix metalloproteinase regulator, fold change: 0.93), 54 PTEN(fold change: 0.64), PDCD4, and TM1 are modulated by this miR-21 in breast cancer. 52 Thus the observed downregulation of miR-21 (fold change: −1.821) links the anti-proliferative effect of HMGA2-silencing with the suppression of the oncomir miR-21. Another oncomir, miR-9, was down-regulated (fold change:-2.878) along with increased expression of E-cadherin gene in HMGA2 silenced RB cells. 55 E-cadherin (CDH1), a gene target of miR-9, is involved in tumor angiogenesis through the activation of ß-catenin that promotes cancer metastasis. 55
miR-21 from an earlier report. 56 and miR-9 from our current integrated data analysis (Fig. 2B) regulate SOX5, a member of (SRY-related HMG-box) family of transcription factors. The over-expression of SOX5 has resulted in regulation of embryonic development and cell fate, 57 malignant B cell proliferation 58 and reduction of glioma cell proliferation with induction of acute cell senescence. 59 The up-regulation of SOX5 (fold change: 1.93), together with downregulation of miR-9 family and miR-21 contributes to HMGA2-silencing, mediated RB cell growth arrest.
In addition, miR-221, which is a suppressor of cell cycle inhibitor proteins p27/Kip1 and p57, and a promoter of RAS-RAF-MEK signalling pathway55,60 was found to be downregulated (fold change: −6.838). This miRNA downregulation may result in the inhibition of cell migration as reported earlier in MDA MB-231, breast cancer cell line61,62 and thus will contribute to the reduction of RB tumor cell proliferation, invasiveness and motility in post-HMGA2 gene silencing.
We also observed the suppression of two major oncomir clusters namely miR-17∼92 and miR-106b∼25 due to the silencing of HMGA2 in RB. The miRNA family, miR-17∼92 clusters and one of its paralogs miR-106a∼363 cluster reside on c13ORF25 genes of chromosome 13 and chromosome X, respectively. The over expression of these clusters have been reported earlier in various cancers such as leukemias, 63 breast cancer 64 and AIDS associated non-Hodgkin's lymphoma. 65 miR-17∼92 expression was reported in RB. 11
In HMGA2 silenced cells, we observed the suppression of the other paralog miR-106b∼25 and its host gene MCM7. HMGA2 is known to be a positive regulator of MCM7, where one of the reported mediators is the E2F family. The involvement of E2F in tumor promotion has been implicated in RB primary tumors.12,66 Further, the HMGA2 silencing also induced suppression of E2F family. 12 Thus the silencing of HMGA2 gene induces downregulation of MCM7 (via E2F family) which in turn prevents the biosynthesis of miR-106b∼25 (please see Fig. 9). In addition, the sequence complementarity between 3′UTR of HMGA2 and miR-106b∼25 may also be a direct target for regulation. The miR-106b-25 has been investigated in detail and is discussed in the next section.
Implication of miR-106b∼25 in RB pathogenesis, validation of its host gene MCM7 and target genes p21, BIM
The miR-106b-25 family includes three miRNAs namely miR-106b, miR-93 and miR-25. This family is highly conserved in vertebrates and resides in the 13th intron of MCM7 gene on chromosome 7.67,68 The MCM7 is well known for its regulation of the replication fork assembly on chromosomal DNA during G1/S phase transition. 69 The suppression of this cluster using inhibitors had resulted in increased apoptosis and G0/G1 cell cycle arrest in oesophageal adenocarcinoma and laryngeal cancer.27,70 Earlier studies have correlated its over expression with poor prognosis in prostrate, endometrial and gastric cancers.71,72 We have observed over-expression of MCM7 in a cohort of 20 primary RB cases (Table 3, Fig. 3). Although miR-106b∼25 cluster, (especially miR-106b) has been reported in RB tumor and serum samples, 73 their gene regulation mechanisms are not known.
Clinicopathological features of the primary RB tumours following the International Intraocular Retinoblastoma Classification (IIRC) with HMGA2, MCM7 gene expression and miR-106b∼25 cluster (by qRT-PCR).
In the present study, the over-expression of miR-106b∼25 cluster was identified in primary RB tumors (n = 20) relative to donor retina. Secondly, we have used a model of RB cells where the miR-106b∼25 cluster was inhibited by specific antagomirs to study its functional and regulatory mechanisms.
In a study on unrestricted somatic stem cells, the various gene targets of miR-106b such as (i) cyclinDl (CCND1), (ii) E2F1 (iii) CDKN1A (p21), (iv) PTEN, (v) RB1, (vi) RBL1 (p107), and (vii) RBL2 have been reported indicating enhanced G1/S transitions with increased levels of E2F transcription factors using bioinformatics and experimental validation protocols. 74 In addition, this cluster of miRNAs have been known to repress the p21 and BIM which are downstream mediators of the TGF-ß signalling pathway. 72
Our results showed the activation of p21 and BIM (Fig. 8A and 8B), along with decreased cell proliferation and invasion, and with concomitant increase in apoptosis in the antagomirs treated RB cells. The observed up-regulation of oncogene, MCM7 in primary RB tumor tissues was complemented by the downregulation of MCM7 gene (Fig. 3) in miR-106b∼25 specific antagomirs treated RB cells. These results strongly points to the role of miR-106b∼25 cluster in promoting RB cell proliferation. 39
To summarize, the integrated analysis between the deregulated miRNAs and genes due to the reduction or suppression of HMGA2 mRNA in the RB cells revealed the downregulation of two main clusters of miRNAs namely miR-106b∼25 and miR-17∼92. These miRNA clusters are known to regulate various key genes such as MCM7, CDKN1A (p21), BIM and EpCAM. These oncomir clusters can be further investigated for their role in RB tumor progression and also during chemotherapeutic interventions.
Conclusions
Improvement in RB management may be achieved by understanding the regulatory gene-miRNA networks involved in RB tumorigenesis and tumor suppression along with their regulatory miRNAs. We have reported the various miRNAs deregulated in the HMGA2-silenced RB cells. The integrated mRNA-miRNA network analysis revealed the regulatory associations between important genes and miRNAs following HMGA2 silencing that result in RB tumor control. Particularly, HMGA2 silencing induced downregulation of the miR-106b∼25 cluster. The tumor promoting role of miR-106b∼25 in RB was clearly documented using specific antagomirs. Taking the results together, it is suggested that (a) miR-106b∼25 cluster itself may be a potential biomarker or target in RB management, and (b) downregulation of the miR-106b∼25 cluster is one of the key mechanisms of cell death induced by HMGA2 silencing in RB.
Author Contributions
Conceived and designed the experiments: SK, NV. Analyzed the data: NV, PRD, MV, SK. Wrote the first draft of the manuscript: NV, PRD, SK. Contributed to the writing of the manuscript: NV, PRD, SK, MV. Agree with manuscript results and conclusions: NV, SK, PRD, MV. Jointly developed the structure and arguments for the paper: SK, NV, PRD, MV. Made critical revisions and approved final version: SK, NV, PRD, MV, VK, AMR. All authors reviewed and approved of the final manuscript.
Supplementary Files
Supplementary File 1
The list of up-regulated and downregulated miRNAs identified in the post-HMGA2 silenced RB cells (Y79). The description of the listed miRNAs includes fold change, miRbase accession number, chromosome location (start and end), and its orientation.
Supplementary File 2
The list of miRNAs and the respective gene targets derived from the integrated analysis of mRNA-miRNA expressions in RB cells (Y79).
Supplementary File 3
The list of miRNAs and respective gene targets derived from Feed Forward Loop/Feed Backward Loop analysis. The first work sheet states the net result of FFL/FBL linking the transcription factors, genes and miRNAs de-regulated in the HMGA2 silenced RB (Y79) cells. Second worksheet provides the list of transcription factors, gene targets, miRNAs, FFL/FBL type, fold change in transcription factor, expression of genes in fold change and expression of miRNAs in fold change.