
Abstract
Retinoblastoma (RB) is a malignant tumor of the retina seen in children, and potential non invasive biomarkers are in need for rapid diagnosis and for prognosticating the therapy. This study was undertaken to identify the differentially expressed miRNAs in the serum of children with RB in comparison with the normal age matched serum, to analyze its concurrence with the existing RB tumor miRNA profile, to identify its novel gene targets specific to RB, and to study the expression of a few of the identified oncogenic miRNAs in the advanced stage primary RB patient's serum sample. MiRNA profiling was performed on 14 pooled serum from children with advanced RB and 14 normal age matched serum samples, wherein 21 miRNAs were found to be upregulated (fold change ≥ +2.0, P ≤ 0.05) and 24 to be downregulated (fold change ≤ –2.0, P ≤ 0.05). Furthermore, intersection of 59 significantly deregulated miRNAs identified from RB tumor profiles with that of miRNAs detected in serum profile revealed that 33 miRNAs had followed a similar deregulation pattern in RB serum. Later we validated a few of the miRNAs (miRNA 17-92) identified by microarray in the RB patient serum samples (n = 20) by using qRT-PCR. Expression of the oncogenic miRNAs, miR-17, miR-18a, and miR-20a by qRT-PCR was significant in the serum samples exploring the potential of serum miRNAs identification as noninvasive diagnosis. Moreover, from miRNA gene target prediction, key regulatory genes of cell proliferation, apoptosis, and positive and negative regulatory networks involved in RB progression were identified in the gene expression profile of RB tumors. Therefore, these identified miRNAs and their corresponding target genes could give insights on potential biomarkers and key events involved in the RB pathway.
Introduction
Retinoblastoma (RB) is a primary intraocular malignancy arising from the retina. The known causes of RB are either RB gene mutation or epigenetic alterations of both alleles, and, yet, there are many unknown causes of RB that need to be deciphered.1,2 Many of the possible reasons for tumor development include genes, proteins, and miRNA's, and many of these have proven to have a role in cell cycle control, cell proliferation, and apoptosis. 3 The study of tumorigenic microRNAs (miRNAs) that can modulate the gene expression is critical for understanding the biology of RB and also finding targets for RB therapy and biomarker identification.
MiRNAs are small, noncoding RNA molecules that have a major role in cellular functions and physiology. The differential regulation of miRNAs has been used for predicting tumor growth and progression in many cancers.4,5 Additionally, the deregulation of miRNAs in body fluids such as plasma, serum, urine, and saliva has given insights to biomarkers for a variety of cancers.6–9 Researchers have also identified differentially regulated miRNAs from primary RB tumors and RB cell lines.10–13 The tumor suppressor nature of miR-34a and the oncogenic nature of miR-17, miR-18a, miR-19b-1, miR-20a, and miR-92a-1 are reported in RB.13–15 Recently, identification of serum miRNA biomarkers and potential gene targets are gaining importance as biomarkers.6,7
Previous studies16,17 have identified molecular pathways in RB from differential gene expression pattern of RB tumors. Using a combination of bioinformatics and biostatistical methods, many target genes have been identified for miRNA.18,19 In this study, we have identified the serum miRNAs that are expressed in an advanced stage of RB by using miRNA microarray, and we have overlapped these data with the tumor miRNA data available in the literature and have selected the important miRNA relevant to RB with their predicted gene targets, which could be used as potential therapeutic targets.10–13 We then validated the concurrent expression of the oncogenic miRNA 17-92 in RB patient serum samples by using quantitative real-time PCR.
Materials and Methods
Serum Samples for miRNA Microarray
This study was approved by institutional review board ethics committee of Vision Research Foundation, Sankara Nethralaya (Ethics clearance number: 249B-2011-P). Serum samples collected from 14 patients diagnosed as RB were used as test group. International Intraocular Retinoblastoma Classification (IIRC) staging and international retinoblastoma classification of these 14 RB tumors revealed 9 tumors at group E and 5 tumors at group D; 10 tumors were unilateral and 4 tumors were bilateral.20,21 Control blood samples were collected from 14 age matched children diagnosed as noncancerous patients enrolled at Medical Research Foundation, Sankara Nethralaya, Tertiary Eye Care Hospital. The patients enrolled in the study had not been subjected to any pre-operative therapy before enucleation. The parents/guardians of the children were informed about the purpose of the study, and signed consent forms have been received as means of acceptance.
Serum Samples for Quantitative PCR Validation
For miRNA validation, serum samples were obtained from children diagnosed as advanced stage RB (n = 20) who were referred from the ocular oncology clinic. The control (non-RB) serum samples (n = 20) were collected from the age matched normal children. The details of the patient's including age, gender, laterality, clinical staging of RB tumors prior to therapy, and clinicopathological information regarding differentiation and invasion of the choroid and optic nerve are shown in Table 1.
Clinicopathologological information of RB patients enrolled in the study.

RNA Extraction and Quality Control Analysis for Microarray
Total RNA was extracted using the circulating nucleic acid isolation kit (Qiagen, India) from serum samples following manufacturer's protocol. Total RNA integrity for microarray was assessed using RNA 6000 nano lab chip on the 2100 bioanalyzer (Agilent Technologies, Palo Alto, CA, USA) following the manufacturer's protocol. Total RNA purity was assessed by the NanoDrop® ND-1000 UV-Vis Spectrophotometer (Nanodrop Technologies, Inc., Rockland, DE, USA).
MicroRNA Microarrays
RB Serum and normal serum samples were pooled and microarray hybridization was done in technical triplicates to accommodate systemic variations and to identify statistically differentially expressed miRNAs as illustrated in Figure 1. The miRNA labeling was performed using miRNA complete labeling and hybridization kit (Agilent Technologies, part number 5190-0456). The total RNA sample was diluted to 50 ng/μL in nuclease free water. About 100 ng of total RNA were dephosphorylated along with appropriate diluted spike in control (Agilent Technologies, MicroRNA Spike-In Kit, part number 5190-1934) using calf intestinal alkaline phosphatase (CIP) master mix (Agilent Technologies, part number 5190-0456) by incubating at 37°C for 30 minutes. The dephosphorylated miRNA sample was denatured by adding dimethyl sulfoxide and heating at 100°C for 10 minutes and transferred to an ice water bath. The ligation master mix (Agilent Technologies, part number 5190-0456) containing cyanine 3-pCp was added to the denatured miRNA sample and incubated at 16°C for 2 hours. The cyanine 3-pCp labeled miRNA sample was dried completely in the vacuum concentrator (Eppendorf, Concentrator Plus, catalog number 5305000) at 45°C to 55°C for 2 hours. The dried sample was resuspended in nuclease free water and mixed with hybridization mix containing blocking solution (Agilent Technologies, part number 5190-0456) and Hi-RPM hybridization buffer (Agilent Technologies, part number 5190-0456) and incubated at 100°C for 5 minutes followed by snap chill on ice for 5 minutes. The samples were hybridized on the human miRNA version 3 array (slide number 252182715127). The hybridization was carried out at 55°C for 20 hours. After hybridization, the slides were washed using gene expression wash buffer1 (Agilent Technologies, part number 5188-5325) at room temperature for 5 minutes and gene expression wash buffer 2 (Agilent Technologies, part number 5188-5326) at 37°C for 5 minutes. The slides were then washed with acetonitrile for 30 seconds. The microarray slide was scanned using Agilent scanner (Agilent Technologies, part number G2565CA).

Hierarchical cluster shows differentially expressed miRNA between RB serum and age matched normal serum.
Serum Sample Processing and Micro RNA Extraction
A volume of 1.5 mL blood was collected from each child directly into serum collection tubes (Vacutainer serum plus blood collection tubes, BD, Franklin Lakes, NJ, USA). The whole blood was allowed to stand for 1 hour at RT (BD manufacturer's protocol) before being centrifuged at 1800 g for 20 minutes at RT. The resultant serum was aliquoted into sterile DEPC-treated 1.5 mL tubes and stored immediately in a freezer at –80°C. Micro RNA was extracted from 0.5 mL of serum samples using circulating nucleic acid isolation kit (Qiagen, India).
Micro RNA Quantification by qRT-PCR Analysis
The expression levels of miRNAs were quantified by qRT-PCR using the human TaqMan MiRNA assay kits (Applied Biosystems, Foster City, CA, USA). The reverse transcription reaction for miRNA-specific cDNA synthesis was carried out with TaqMan MiRNA reverse transcription kit for the small RNAs, RNU6B (assay ID 001093), hsa-let-7a (assay ID 000377), hsa-miR-17 (assay ID 002308), hsa-miR-18a (assay ID 002422), hsa-miR-19b-1# (assay ID 002425), hsa-miR-20a (assay ID 000580), and hsa-miR-92a-1# (assay ID 002137). The above cDNA was diluted to a concentration of 500 ng, which was used for setting quantitative PCR on a 7500 real-time PCR system (Applied Biosystems). The reaction components included TaqMan miRNA assay, cDNA, TaqMan universal PCR master mix amperase UNG to total of 20 μL and incubated at 95°C for 10 minutes, followed by 40 cycles of 95°C for 15 seconds and 60°C for 1 minute. The cycle threshold (Ct) values were calculated with SDS 1.4 software (Applied Biosystems). All the samples were validated in duplicates. The expression of miRNAs from serum samples was normalized using the 2–ΔΔCt method relative to endogenous control.
Statistical Analysis
The significance of serum miRNA 17-92 cluster levels was determined by the Mann-Whitney U test. All P values were two-tailed and P values less than 0.05 were considered statistically significant. All statistical calculations were performed by GraphPad Prism demo 6.0 version (GraphPad Software, Inc., La Jolla, CA, USA).22,23 The mean fold changes of control and RB serum samples are given in the Table 2, and P values and RQ values are provided in Supplement 6.
Mean fold changes of control (n = 20) and RB serum samples (n = 20) obtained by microarray analysis and qRT-PCR.

Bioinformatics and Insilico Analysis
Microarray Data Analysis of RB Serum miRNA
The processed miRNA chip data were imported to Gene Spring GX 12.0.2 for log2 transformation (accession number GSE41321). Signal cutoff measurements were set to 1.0 and normalized to the 90th percentile of signal intensity to standardize each chip for cross-array comparison (Agilent default parameter). 24 Subsequently, microRNA target gene prediction was performed using data from microcosm (http://www.ebi.ac.uk/enright-srv/microcosm/) for the significant hits. Volcano plot based method was used to find out differentially expressed miRNAs between RB serum and normal serum samples. False discovery rate correction at <1% and q-value calculation was done using the Benjamini Hocheberg method. Significant miRNAs were short-listed based on unpaired Student t test, P value cutoff < 0.05. A total of 45 miRNAs with fold change value greater than + 2.0 and less than –2.0 have been considered as significantly deregulated miRNAs (Fig. 1 and Supplement 1). Further, the list of target genes were uploaded to web-based tool DAVID (Database for Annotation, Visualization, and Integrated Discovery) V6.7 for enriched gene ontology terms and significant pathway analysis (Supplement 2). The statistically significant terms were calculated by the Fisher exact test.
Annotations of Differentially Expressed RB Serum miRNA
The differentially expressed 45 miRNAs identified in the RB serum samples include 21 upregulated and 24 downregulated miRNAs. These deregulated miRNAs were classified into four main categories using TAM analysis tool (http://202.38.126.151/hmdd/tools/tam.html/), namely, miRNAs belonging to clusters, miRNA belonging to family, and miRNAs expressed in a tissue specific manner and to relevant functions. From the list of 21 upregulated miRNAs, 11 miRNAs belong to clusters, 9 belong to miRNA families, and 12 miRNAs belongs in different cellular functions. From the downregulated miRNAs, 8 miRNAs belong to clusters, 4 miRNA belong to families, 19 belong to functional type, and 1 belongs to tissue specific type.
In this study, we found several important clusters such as hsa-miR-106b, hsa-miR-1185, hsa- miR-127, hsa-miR-144, hsa-miR-188, hsa-miR-192, hsa-miR-194, hsa-miR-374a, hsa-miR-374b, hsa-miR-424, and hsa-miR-506, while the downregulated miRNAs groups into clusters such as hsa-let-7a, hsa-let-7c, hsa-let-7e, hsa-let-7f, has-miR-1185, hsa-miR-129, and hsa- miR-221. The let-7 clusters are reported to be tumor suppressor function and miR-106b are reported as oncogenic cluster in many cancers.25–28 Apart from these miRNA clusters, we have identified yet another cluster, miR-17-92 (> 1 fold, P < 0.05), in the serum of RB that has a oncogenic role in RB and in other cancers.13,14,29,30
Identification of Deregulated miRNA in RB Tumors
An in-depth review of literature was carried out to procure RB tumor miRNA profiling data, whereby, miRNAs significantly deregulated and validated in RB tumors were enlisted from 4 different studies.10–13 A total of 47 miRNA were found to be upregulated, and 12 miRNA were found to be downregulated as reported in one or more of the chosen publications (Fig. 2 and Supplement 4).10–13
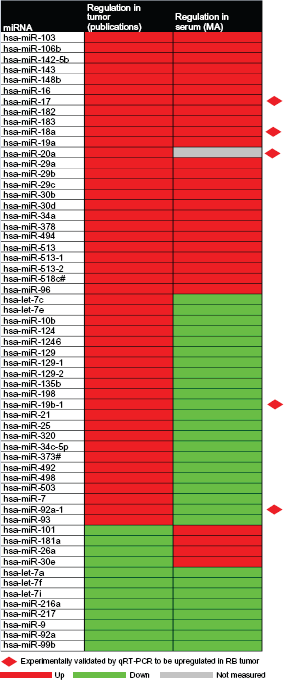
Hierarchical cluster shows common differential miRNAs in RB tumor and RB serum samples.
Comparison and Integration of miRNA Profile of RB Serum and RB Tumor
The expression level of 59 miRNA that were reported to be deregulated in RB tumor samples were then compared with the total deregulated miRNAs reported in RB serum so as to investigate if any of them could be used as potential biomarkers for RB. A heat map was generated to compare the expression of the 59 miRNAs deregulated in primary tumor samples10–13 and 45 miRNAs identified in the serum of RB children (Fig. 2 and Supplement 4). We observed a total of 33 miRNAs, which includes 25 upregulated and 8 downregulated miRNA's in both serum and RB samples.
Gene Enrichment from four RB Gene Expression Studies on RB Primary Tumor
In order to obtain gene expressions in RB tumor samples, gene enrichment analysis was performed. This analysis involves a comprehensive review of literature and deciphers the preliminary data from microarray databases (NCBI and GEO). This study reveals the genes significantly dysregulated and validated in RB tumors were enlisted from 2 publications16,17 and 2 from unpublished data (NCBI, Gene Expression Omnibus [GEO] accession numbers: GSE33048 [http://www.ncbi.nlm.nih.gov/geo/query/acc.cgi?acc=GSE33048] and GSE24673 [http://www.ncbi.nlm.nih.gov/geo/query/acc.cgi?acc=GSE24673]). A total of 947 upregulated genes and 1215 downregulated genes were reported in three or more of the chosen publications.16,17 On further consensus analysis and with respect to cell proliferation, mediation of apoptosis, and negative regulation of cell cycle, a total of 239 upregulated genes and 261 downregulated genes were reported consistently in 3 or more of the previous studies16,17 discussed above (Supplement 3). Furthermore, these differentially expressed genes were also compared with our microarray data to elucidate the potential miRNAs showing differential expression in RB serum.
Prediction of miRNA Mediated Functional Gene Regulation
Gene targets were predicted for the miRNAs that are identified in serum and also common miRNAs of serum and tumors of RB. The miRNA target prediction databases, namely Microcosm, Target Scan, MirTarget2, and Pictar, were queried, and the predicted targets were then compared with a list of upregulated and downregulated genes identified in RB tumors as reported in earlier studies.31–36 To evaluate the strength of the binding of miRNAs to their targets, the minimum free energy for miRNA–mRNA hybridization was also calculated using the program-RNA hybrid. 37 Functional classification of the target genes was carried out with gene ontology (GO) analysis using the DAVID tool. The complete insilico analysis of miRNA screening and target gene prediction is given in the flow chart (Fig. 4). With respect to the identified 33 miRNAs discussed above, gene targets of 29 miRNAs were dysregulated in the RB tumors. (Supplement Figure 5, Supplement 5).

(

The figure shows the schematic representation of work plan designed for insilico analysis of miRNA and predict their target genes.
MiRNA Mediated Functional Gene Network Identification
Deregulated genes in RB tumors that were involved in cell proliferation and programmed cell death were reported as significant from the gene ontology analysis. These genes were correlated with deregulated miRNAs identified in RB tumor and RB serum samples. CytoScape version 2.8.1 software (http://www.cytoscape.org) was used to generate a network showing the miRNA-mRNA connections and indicating the strength of the binding based on the minimum free energy values. Nodes (genes/miRNA) were colored based on their expression profile. The edges (connections) were colored based on positive/ negative or indirect regulation between miRNA and deregulated mRNA (Supplement 2, Supplement Figures 6 and 7).
Microarray Serum 17-92 miRNAs Validation and Data Analysis
Quantitative real-time PCR was performed on serum samples from 20 RB cases and 20 age matched healthy controls. As an endogenous control for serum samples, we verified the levels of RNU6B and hsa-let-7a.38–41 Each assay giving Ct-values < 32 was considered as detectable. The mean fold changes of control and RB serum samples obtained for miRNAs are given in Figure 3A–E.
Discussion
Recent review by Dimaras et al 1 in the current status of RB in developing countries reveals a mortality rate of about 40% to 70% as compared with 3% to 5% in Europe, Canada, and the United States. The review also states that 9000 newly diagnosed RB patients die due to delayed diagnosis annually. In order to prognosticate the disease and to predict the outcome, identification of biomarkers becomes mandatory, as they play a vital role in RB tumorigenesis. 1 Being the most promising biomarkers, miRNAs help to monitor the state of the cancer.42,43 This differential miRNA study may aid in finding the candidate miRNAs for the diagnostic and therapeutic applications with respect to RB management. Moreover, from the previous study, it is evident that the expressions of these miRNAs follow a specific profile and pattern, and expression of these miRNAs is not dependent on RB mutation. 10
In this study, we collected serum samples from children harboring RB at an advanced stage (group D and E) at the time of diagnosis by the ophthalmologist. As the 14 pooled RB serum used for miRNA microarray includes 9 RB of group E and 5 of group D, the identified serum miRNA would reflect their specificity with respect to the advanced tumor (RB) stage. Therefore, the identification of these miRNAs would help in the evaluation of the RB prognosis during the course of therapy and also help to predict the advanced stage earlier. However, there arises a question whether these miRNAs can determine or predict the early stage of RB, namely groups A and B, which is yet to be answered. This may be possible in other solid cancers such as breast cancer or pancreas cancer where a biopsy could be done at early stage and by comparing tumor miRNA and serum miRNA profile with that of advanced stage. However, it is not possible in RB because group A or B are not being enucleated and are improved with focal therapy itself. The majority of RB reported in developing countries, especially India, are at advanced stage, and this study would be helpful in determining the prognosis during RB management as described earlier.44–48
From our study of the serum miRNA profile, a total of 908 miRNAs were detected, which includes 97 upregulated and 558 downregulated miRNAs with a cutoff ± 1.0 fold change (P < 0.05). Further, the statistical data analysis with a cutoff ± 2.0 fold change revealed 45 miRNAs to be significantly deregulated, of which 21 were upregulated and 24 downregulated (Fig. 1). In addition to these results, the four different miRNA microarray studies of RB tumors revealed 59 differentially expressed miRNA ((Fig. 2 and Supplement 4).10–13 Moreover, 10 miRNAs with fold change greater or less than 2.0 (hsa-let -7c, hsa-miR-129, hsa-miR-513b, hsa-miR-513c, hsa-miR-124, hsa-let-7f, hsa-miR-142-5p, hsa-let-7e, and hsa-miR-93) and 33 miRNAs (25 miRNAs upregulated and 8 miRNAs downregulated) were detected significantly based on the intersection of deregulated miRNAs from RB tumor with that of identified miRNAs from serum samples (Fig. 2 and Supplement 4. This reinforces that these 10 miRNAs are specific in contributing RB tumorigenesis and concludes their expression in a synonymous pattern with respect to serum samples.
Retinoblastoma specific gene targets for highly deregulated serum miRNAs (21 upregulated and 24 downregulated) common to RB tumor and RB serum (25 upand 8 downregulated) were predicted by comparative analysis. Here, initially we performed a comparative analysis of the differential RB tumor gene expression profiles from four different microarray studies, and with this final enriched and consensus list of genes, we correlated it with the RB serum miRNA profiling data. The gene ontologies showed that the listed genes are found to be involved in 109 cellular functions, of which we found several key regulatory genes involved in vital functions such as cell proliferation and programmed cell death, which includes proliferating cell nuclear antigen (PCNA), cyclin-dependent kinase inhibitor (CDKN2A), cell division cycle 25 homolog A (CDC25A), kinesin family member (KIF15), erythroblastic leukemia viral oncogene homolog (ERBB), BCL2-associated X protein (BAX), v-raf-1 murine leukemia viral oncogene homolog (RAF-1), and mitogen-activated protein kinase (MAP3 K5) (Supplement 2). From our findings, miR-17 family (hsa-miR-17, hsa-miR-18a, and hsa-miR-106b) triggered higher expression with significant P values (<0.05) and considerable fold changes (>1.0 fold) both in serum and tumor miRNA profiles. Moreover, the high expression of miR-17 family members were reported in RB tumors.13,14 The miR-34a was found to be overexpressed in both tumors and serum miRNA profiles, which was previously proven to have an oncogenic role in RB. 15 To proceed with our study, earlier reported candidate microRNAs (miR 17-92 cluster) in RB tumors had been selected for the validation in another set of RB serum samples (n = 20) by qRT-PCR (Fig. 2). The high expression of the miR-17-92 cluster in the serum samples by qRT-PCR added the significance of this cluster in our study. Though these miRNA cluster origins from the same loci, we observed low levels of miR-19b and miR-92a in the serum samples compared with control than in the RB samples, which has also been reported in other cancers (Table 2). 49 This discrepancy in the expression levels within this cluster between the RB tumor tissues and the serum sample still remains unclear. These differential miRNAs are to be screened and validated on large sample size for their use at the level of diagnostic/prognostic biomarker.
Conclusion
Our study shows the miRNA profile of RB serum at advance stages, which discriminates RB from age matched control serum, and this is the first study to report this finding to the best of our knowledge in the study of retinoblastoma. The study also reveals a subset of miRNAs detected both in the serum and in the primary tumors of RB. These miRNAs and their target genes, reported in advanced stage RB, needs to be validated and, further, to be used either as biomarkers and/or for targeted therapy.
Funding
We acknowledge the department of biotechnology (DBT) grant number BT/01/CEIB/11/V/16, program support for retinoblastoma research and also support from DBT grant number BT/PR12901/AGR/36/636/2009 for providing funding to Dr. S. Krishnakumar for this study. We are thankful to Genotypic Technology Private Limited, Bangalore, for the processing of microarrays.
Author Contributions
Conceived and designed the experiments: KS. Analyzed the data: MB, NV, MV, UV. Equal contribution: MB and NV. Wrote the first draft of the manuscript: MB. Contributed to the writing of the manuscript: NV, MV, UV, KS. Retinoblastoma children diagnosed and serum samples provided by VK. Agree with manuscript results and conclusions: MB, KS, MV, UV. Jointly developed the structure and arguments for the paper: MB, KS. Made critical revisions and approved final version: MB, NV, MV, UV, VK, KS. All authors reviewed and approved of the final manuscript.
Competing Interests
Author(s) disclose no potential conflicts of interest.
Disclosures and Ethics
As a requirement of publication, authors have provided to the publisher signed confirmation of compliance with legal and ethical obligations including but not limited to the following: authorship and contributorship, conflicts of interest, privacy and confidentiality and protection of human and animal research subjects. The authors have read and confirmed their agreement with the ICMJE authorship and conflict of interest criteria. The authors have also confirmed that this article is unique and not under consideration or published in any other publication and that they have permission from right holders to reproduce any copyrighted material. Any disclosures are made in this section. The external blind peer reviewers report no conflict of interest.
Footnotes
Acknowledgements
We would like to express our deepest sense of gratitude to Dr. Doreen Gracias for providing diagnosed control and RB serum samples. We would also like to express our sincere thanks to Rajeswari Vasudevan for her extensive support in providing patient details and consent about the purpose of the sample collection to the patients.
Supplementary Data
Supplement 1. List1.xls.
Supplement 2. List 2, Supplement Figure 6,
Supplement Figure 7.xls.
Supplement 3. List 3.xls.
Supplement 4. List 4.xls.
Supplement 5. List 5, Supplement Figure 5.xls.
Supplement 6. List 6.xls.