
Abstract
Olfaction is the response to odors and is mediated by a class of membrane-bound proteins called olfactory receptors (ORs). An understanding of these receptors serves as a good model for basic signal transduction mechanisms and also provides important clues for the strategies adopted by organisms for their ultimate survival using chemosensory perception in search of food or defense against predators. Prior research on cross-genome phylogenetic analyses from our group motivated the addressal of conserved evolutionary trends, clustering, and ortholog prediction of ORs. The database of olfactory receptors (DOR) is a repository that provides sequence and structural information on ORs of selected organisms (such as Saccharomyces cerevisiae, Drosophila melanogaster, Caenorhabditis elegans, Mus musculus, and Homo sapiens). Users can download OR sequences, study predicted membrane topology, and obtain cross-genome sequence alignments and phylogeny, including three-dimensional (3D) structural models of 100 selected ORs and their predicted dimer interfaces. The database can be accessed from http://caps.ncbs.res.in/DOR. Such a database should be helpful in designing experiments on point mutations to probe into the possible dimerization modes of ORs and to even understand the evolutionary changes between different receptors.
Introduction
Olfactory receptors (ORs) belong to the class A type of G-protein-coupled receptors (GPCRs) and participate in sensing diverse chemical stimuli or odors. 1 ORs are fascinating for their functional significance in detecting food, assaying its quality, and enhancing its flavor; exhibiting reactions to potential toxins and pathogens, and identifying information about reproductive status, gender, genetic identity, conspecifics, mates, as well as threats. ORs activate chemosensory cells involved in neural recognition and behavior, hormone state, and mood. 2 These versatile functions of ORs motivated us to create a non-redundant data repository that can be used in the study of olfacto-sexual function and olfacto-neural communication, and for various practical applications in the fields of pharmaceutics (aromatherapy), cosmetics (perfume manufacturing), food industry, and agricultural pest management.
OR genes are generally expressed in bipolar neurons. The dendritic membrane of the bipolar neurons terminates with filamentous process to increase the surface area, capturing diverse stimuli from the environment. ORs of each genome are peculiar for their sense of olfaction. Although the overall morphology is conserved in different taxa such as vertebrates, insects, and nematodes, 3 they tend to be adaptive in a habitat-dependent and not a species-dependant manner. 4
While fruit fly ORs are simple, the mammalian and vertebrate olfactory systems are interestingly complex in sensing diverse odors. Drosophila ORs show reasonable sequence similarity and orthology with other insect species such as Anopheles gambiae, Heliothis virescens, Endopterygota, and lepidopteran (tortricid moths).5,6 Notably, a candidate OR from the Drosophila genome, OR83b, is strongly conserved across other insect genomes and it functions as a chaperoning co-receptor forming heteromeric complex with ligand-binding ORs. 7 11 Drosophila ORs operate both in ionotropic and metabotropic pathways.
Just like mammalian ORs, insect ORs also retain seven transmembrane (TM) regions. However, interestingly, Drosophila ORs retain reverse topology.11,12 Although insect olfactory sensory neurons (OSNs) and mammalian OSNs are anatomically similar, insect OSNs differ in possessing the sensilla in the antenna and maxillary palp in their olfactory system. 13 There are also fewer insect ORs than in mammalian genomes. Moreover, insect ORs (Drosophila ORs) are evolutionarily distant and do not cluster with vertebrate ORs (Raghu Prasad Rao Metpally, PhD Thesis). 14 Hitherto, attempts have been made to perform cross-genome phylogeny between ORs from selected genomes, to identify and compare the cluster association or distribution of clades between uni- and cross-genome OR phylogeny. 15 These studies also clarify why some Drosophila ORs show the same functional properties and cellular localization, but are distributed in different clusters in uni-genome OR phylogeny. For instance, antennal receptors such as OR22a, OR35a, and OR85b are pentyl acetate-sensitive receptors, 15 but are distributed in different clusters in uni-genome OR phylogeny. Our recent study on cross-genome OR clustering of human and Caenorhabditis elegans GPCRs motivated us to perform a cross-genome OR phylogeny on selected human and C. elegans chemosensory receptors. 16 There is only one annotated OR with well-characterized functions, ie, odr-10 in C. elegans.17,18 Attempts were made to perform cross-genome OR phylogeny with selected human ORs and homologues of odr-10 and to observe the cluster association to interpret the species-specific tendency. Apart from the sequence diversity, the number of ORs varies from species to species. Occurrence of large number of pseudogenes in ORs because of the event of loss of selection pressure and the process of gene duplication followed by functional divergence leads to the formation of multiple gene families and are two important phenomena when we deal with ORs in eukaryotes.
Lower chordates such as fish (for example teleost fish, including the goldfish Carassius auratus) possess class I type of ORs, 19 which help sense water-borne odors. Amphibians possess class I and class II ORs that help to detect air-borne odors. 19 21 The occurrence of class I (which detects water-borne odors) and class II (which detects air-borne odors) types of ORs could be a result of adaptive processes during evolution and are also observed in higher eukaryotes including humans.22,23 Structure analysis helps differentiate these two types of receptors and shows that the length of the extracellular loop 3 (ECL3) in class I-type receptors ranges from 10 to 15 amino acids. On the other hand, ECL3 of class II-type receptors is generally shorter and retains only 12 amino acid residues. 20 However, there is no detailed documentation of class-specific motifs that discriminate the two classes of ORs from multiple genomes. 24 A well-known case study further emphasizes the need of integrated knowledge on sequence and structure to understand the functional property of ORs in general. 20 Therefore, there is a need to integrate knowledge on sequence and structure to understand the property of ORs in general.
The availability of genome sequences for selected genomes such as yeast, fly, worm, mouse, and human (http://genome.weizmann.ac.il/horde/) facilitates our objectives on creating a non-redundant data repository on ORs. 24 27
In this study, we incorporate information on sequence analysis in documenting non-redundant OR sequences, possible cross-genome sequence alignment, phylogeny, and cluster association at uni- and cross-genome levels. Structural analysis on predicted secondary structures, conserved motifs, and dimer interfaces for the selected representative OR sequences from the phylogeny following three-dimensional (3D) modeling was also performed. We report a database on olfactory receptors (DOR), which is intended to provide sequence and structural information on ORs from selected model organisms and human ORs for vast practical applications. DOR is an integrated database that provides sequence and structural information on ORs of selected eukaryotic organisms such as Saccharomyces cerevisiae, Drosophila melanogaster, C. elegans, Mus musculus, and Homo sapiens.
Methodology
The protocols employed for handling the sequence analysis and structural information are described below.
Flow-Chart for Sequence Analysis
A step-wise procedure to generate a non-redundant dataset for the selected eukaryotes is described in Figure 1, and it includes four steps.
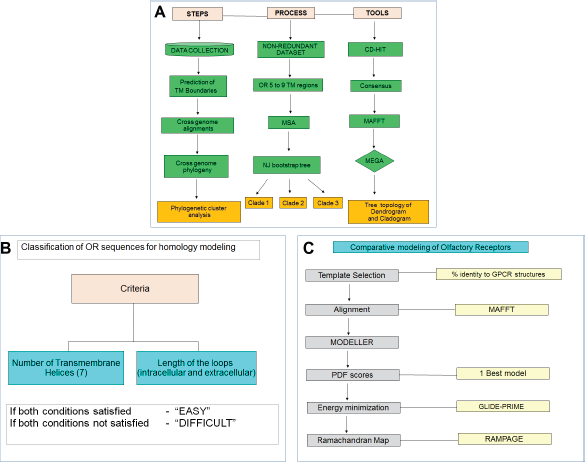
Flowchart for the sequence and structure analysis on ORs in DOR. (
Data Collection and Curation
Preliminary data collection was performed through text matching by using the keyword as “olfactory receptor” along with the genome of our interest in the NCBI protein search. Taking reference sequences from the other sources such as Human Olfactory Data Explorer (HORDE) (http://genome.weizmann.ac.il/horde/) and Olfactory Receptor Database (ORDB) and using related terminologies to ORs such as serpentine receptors, OR-like receptors, and our own support vector machine (SVM)-based classification, searches were also employed to collect ORs from the given genomes. 27 The collected sequences (in FASTA format) were submitted to the CD-HIT server to identify redundant entries (refer Figure 1A). 28 The sequences reported for more than 90% sequence-identity were removed from the dataset. Thus, a non-redundant dataset of 371 ORs from H. sapiens, 338 ORs from M. musculus, and 66 ORs from D. melanogaster was created. 29 31 Only one sequence functionally characterized as an OR in C. elegans (odr-10)17,18 and its 83 homologues, which were collected through BLAST search, were deposited in the database. Five sequences, related to ORs (OR like), were collected from the NCBI protein search for the genome S. cerevisiae. A total of 66 ORs from Drosophila include four sequences, which were identified by our SVM searches. Protein IDs and gene IDs for five selected eukaryotic genomes were retained, and sequence downloads made available for user access.
Prediction of TM Proteins
OR sequences, collected from five organisms, were treated separately to predict the number of TM helices and membrane topology using three methods: HMMTOP,32,33 TMHMM, and PolyPhobius.34,35 The consensus from the prediction of three methods was employed for annotating the final TM boundaries for OR sequences where the residues predicted by at least two of the given methods as helices were assigned a helical conformation. The predictions by three methods and their consensus, as shown as an example in Supplementary Figure 1, is available in the database for every OR sequence.
Conflict in Prediction of Membrane Topology
An OR sequence is predicted to have either “N-in topology” or “N-out topology” based on the algorithm of the prediction method in question, which generally depends on the sequence composition of the loop regions in the sequence. ORs of Drosophila exhibit the “N-in topology” (intracellular N-terminus), whereas ORs from other genomes, such as in worm, mouse, and human, possess “N-out topology” (extracellular N-terminus) similar to canonical topology of GPCRs. As an attempt to align a given OR with various reference sequences, our in-house program called TM-MOTIF could be used effectively. 36 This tool is integrated as part of the DOR database.
Also, we presume that OR sequences that have over/underpredicted TM-helices could either belong to particular OR subfamilies or have some functional significance, as discussed in the case study of hOR17–210. 37 This receptor has been underpredicted with five TM-domains, where prediction methods suggest that this particular receptor does not possess the first two TM helical domains. But experimental data have shown that the gene product of frame-shifted, cloned hOR17–210 cDNA was able to bind an odorant-binding protein and is narrowly tuned for excitation by cyclic ketones to perform chemosensory function. 37 Thus, despite limitations in predicting helix boundaries, our current study retains OR sequences predicted for 7 ± 2 helices for a vast majority of entries in the database. At this stage, datasets of 5, 66, 338, and 371 OR sequences from yeast, fly, mouse, and human genomes were retained, respectively. Odr-10 and 82 homologous sequences of odr-10 from worm were also added to the dataset to create a non-redundant dataset.
Cross-Genome OR Sequence Alignments
OR sequence alignments at uni- and cross-genomic levels were performed. The collected candidate ORs were aligned using MAFFT, and parameters such as JTT 200 scoring matrix and a gap opening penalty of 1.53 were used. 38 The OR sequences from yeast, fruit fly, mouse, human, and worm were used for the uni- and cross-genomic OR sequence alignments.
Parameters such as the number of sequences and evolutionary distance between sequences were considered during alignment. Appropriate alignment methods were employed for the required/respective OR cluster dataset. For instance, human ORs with odr-10 and its homologues from worm and human-mouse ORs were aligned by using MAFFT. 38 However, for other cross-genome alignments, such as fruit fly–yeast–human ORs that consist of distantly related proteins, ClustalW was employed. 39
Uni- and Cross-Genome OR Phylogeny
The generated alignments were imported to MEGA 5.0 for visualizing the quality of the alignment. 40 Starting from MAFFT/ClustalW alignment, wherever required, manual editing was done to remove the unaligned indels from the alignment, and care was taken to retain the average length of the alignment with 335-350 amino acid residues. In cases of cross-genome OR sequence alignments for fruit fly-yeast-human OR phylogeny, because of the occurrence of unusual long loop lengths in fruit fly ORs and remote homology, a large number of indels were observed. Hence, the alignments were improved by manual editing using MEGA 5.0. 39 The final OR alignments at uni- and cross-genomic levels were used to construct phylogenetic trees employing the neighbor joining (NJ) approach for 1000 bootstrap (BS) replicates applying JTT 200 matrix. The resultant tree topologies were analyzed for cluster association at uni- and cross-genomic levels.
Structural Analysis of ORs
Selection of OR Sequences for Homology Modeling
Representative OR sequences were selected so as to obtain a good representation from all the different clusters formed as a result of phylogenetic analysis. A composite classification scheme based on consensus TM prediction was employed to select representative ORs from each cluster. Sequences were assigned a composite score of two binary scores depending on the extent of complexity of modeling, like loop lengths, and predicted number of helices. For instance, if an OR sequence is associated with the presence of seven predicted TM helices and loop length less than 50 amino acids, the composite score would be two and treated as “modeling-easy” (please see Ref. 41 for details). Thereby, 90% sequences of “modeling-easy” class and 10% of “modeling-difficult” class were chosen for 3D modeling (Fig. 1B). The number of representative sequences varies according to the candidate receptors associated in that particular cluster. In all, 50 representative OR sequences were selected from the human genome, 30 from the mouse genome, 5 from the fruit fly, 13 from the worm, and 2 from the yeast genomes to predict the secondary structural details. A total of 100 OR sequences were chosen for homology modeling.
Homology Modeling of Selected OR Sequences
Selection of templates for homology modeling is a crucial step, where shared features such as homology and ligand similarity play important roles. There has been a recent upsurge in the number of structures of GPCRs in PDB (Protein Data Bank), which are possible candidates for homology modeling of ORs. Although ORs belong to the subclass A of GPCRs and have a well-preserved structurally similar scaffold, they bear less than 25% homology with these non-OR GPCRs. 42 Hence, all the GPCR structures and their sequences from PDB were considered as candidates for the template for OR modeling. After removing redundant sequence entries, we aligned the OR and GPCR sequences. The sequence-identity of each OR sequence to a given set of GPCRs was calculated using the needle-all algorithm (Table S1). β-1-adrenergic receptor (PDB code: 2Y02 and 2VT4) retained highest identity for 75% of OR sequences,43,44 followed by bovine rhodopsin (PDB code: 2G87 and 1U19).45,46 Very few OR sequences showed highest identity with other GPCRs such as β-2-adrenergic, 5HT1B, 5HT2B, dopamine, δ-opioid, and squid rhodopsin (Table S1). Wherever possible, both active and inactive state models were generated for a given OR sequence. This would further help us in understanding the differences in ligand binding as well as dimerization of OR in different functional states.
Pairwise alignments of template and query (OR sequences) were obtained using MAFFTv7 (E-INS-i JTT 200 matrix Mafft-homologs option – on). 38 Proper care had to be taken for target-template alignment, which was guided by positional equivalences of the TM helices, motif residues, and refinement procedures of the model such as energy minimization. The alignment is set to retain maximum equivalence in TM, and important motifs such as DRY and NPXXY (in TM3 and TM6, respectively) were kept aligned in both query and template. MODELLER (9.11 version) was used to generate 20 models of each OR sequence. 47 The problem of a blocked ligand entry site by ECL2 (as in rhodopsin) should not arise in ORs, as their ECL2 loops are very long, and for most of the residues, there will not be any equivalences in the template. Hence, ECL2 loops in ORs were modeled based on their spatial restraints by MODELLER, and therefore they will form a conformation based on their own sequence composition, which can be refined by using energy minimization. For ORs from fruit fly, which were predicted to have intracellular N-terminal region, alignment was performed carefully. 48 The models were validated using RAMPAGE Ramachandran plots. 49 The models were energy minimized using the PRIME energy minimization and refinement tools in Schrodinger Suite (Schrödinger, LLC, New York, NY, 2007). An implicit membrane environment was added during the minimization to take care of membrane-induced flexibility in the models. The lowest energy model was then chosen for dimer-interface predictions.
Overall, secondary structural connectivity of GPCRs and ORs is similar as they have seven TM helices with connecting loops. Overall biological function of signal transduction is also known to be common for the template and query. The sequence-identity between any two GPCRs of known structure is in the range of 20-35%. However, the structural similarity in the core TM domain between these GPCRs is very high. 50 The sequence identities between the template and representative ORsequences are about 14-25% (referTable S1). Earlier, we had modeled the ion channel domain of inositol tri-phosphate receptor, starting from the available crystal structure of the potassium channel, even though they showed opposite orientations of channel activity. 51 Therefore, we believe that the overall modeling of insect ORs (N-in topology) is possible starting from the structures of GPCRs (N-out topology).
Such techniques for modeling have shown to yield successful results through analysis of model 5-HT2 A (GPCR) receptors and use of the model for docking studies to identify ligand binding sites. 52
Conserved Residue Prediction of Proteins/Prediction and Mapping of Conserved Residues on OR Models
3D models (both active and inactive states) of representative OR sequences were used to map conserved residues for each of the clusters starting from uni- and cross-genomic clustering of ORs from human, mouse, and fruit fly. For every cluster, conserved residue analysis was performed using ConSurf server. 53 For a given cluster, the multiple sequence alignment pertaining to the respective cluster and one representative sequence (whose 3D model is available) were provided as input. The conserved residues were mapped on the representative sequence and structure. For OR sequences from yeast and worm, we were unable to map conserved residues because of the lack of homologous sequences with high sequence similarity.
Prediction of Dimer Interface for OR Models
Interfaces of OR sequences (both active and inactive states) from human, mouse, and fruit fly were predicted by the method provided in G-protein-coupled receptor interaction partners (GRIP), which requires a 3D structure of a target GPCR and its homologous sequences.54,55 In this work, we used a model structure of a target OR and the sequences that belong to the same subtype as that of the target. GRIP was developed based on three assumptions: first, GPCRs form oligomers based on the domain-contact mechanism, which utilizes the lipid-facing molecular surfaces along TM helices as the interfaces. 56 Therefore, GRIP does not take into account the domain-swapping mechanism, which utilizes buried residues of a monomeric structure after the drastic conformational change of the structure. 54 Second, the residues directly involved in the oligomerization are conserved within the subtype, to which the target belongs. Third, the conserved residues would be more abundant at the interface than at the non-interface surface. Further details about these assumptions are described previously. 55 Based on these assumptions, GRIP searches for the lipid-facing surfaces, along TM helices, where a number of conserved residues are clustered with statistical significance. However, it was difficult to detect a cluster of conserved residues on the surface of the 3D structure. Therefore, GRIP transformed the structure as follows.54,57 The monomeric structure of an OR can be regarded as a thick tube, whose long axis is approximately perpendicular to the membrane plane. In this schematic image, all the OR residues are regarded as constituents of the tube, and the interface residues are considered to cluster on a surface of the tube. If all the residues are projected on the plane perpendicular to the long axis of the tube, then the projected residues form a ring-like distribution on the plane. Then, the interface residues would be clustered in a sector of the ring-like distribution. Principal component analysis was applied to the Cartesian coordinates of the Cα atoms of the OR. The first principal component vector runs along the long axis of the tube-like structure of the structure. Therefore, all the residues are projected on the plane defined by the second and third principal component vectors, and searched for a sector, where the number of conserved residues was statistically significant in the ring-like distribution of the projected residues. The residues within the sector thus detected are considered to correspond to the residues constituting the interface. To predict more than one interface, we removed the predicted interface residues from the data set of surface residues. Using the remaining residues, a second prediction was performed. Predicted interface residues in the second round were found to be located on the interface between a pair of dimers.
Technical Details
DOR is implemented using MySQL database that runs on an Apache web server on Linux OS. PERL and PHP scripts were used at backend for display, and the web interface was developed using HTML and Javascript. MySQL and PHP technology were preferred as they were platform independent and open-source software.
Results and Discussions
Main Features of DOR
DOR provides a user-friendly platform to access features related to OR sequence and structure. The main menu provides three key features: “Sequences and Structures,” “Alignments and Phylogeny,” and “TM-MOTIF” (refer Figure 2A-C; HS51M1 from http://caps.ncbs.res.in/DOR for an example). 36

Snapshot of the home page of DOR. Notes: Snapshot depicting the available main menu in the home page of DOR with user-interactive features. (
OR Sequences of Target Genomes
To retrieve sequences of ORs, users can download the respective sequences (in FASTA format) using the link provided for every sequence in every genome. In the drop-down menu for “Sequences and Structures” called “SOURCE,” the list of five model organisms used in our study is provided and the user can select the organism of their interest.
Predicted TM Boundaries
The “Sequences and Structures” option provides details about predicted consensus TM domain boundaries (refer Figs. 2A and 3C). The display of helix boundaries for the predicted TM-helices can be easily followed using the VIBGYOR notation, where in predicted seven TM helices TM1–TM7 are given in seven colors such as violet (V), indigo (I), blue (B), green (G), yellow (Y), orange (O), and red (R), respectively. When sequences were over predicted (more than seven TM-domains), a pale cream color is assigned to such sequences. Sequences with less than seven TM-domains predicted can also be identified through the incomplete representation in VIBGYOR coloring scheme. 35 The prediction of TM-helices, using three different methods and the consensus helix boundaries, can be viewed from the link provided for each sequence, in which each predicted helix is colored according to VIBGYOR notation (refer Fig. 3E). OR sequences, selected for 3D modeling, are linked to the webpage related to their structural information (refer Figs. 3C and 4).

Pictorial representation of available features in DOR for sequence analysis. Notes: (
Uni- and Cross-Genome OR Sequence Alignments and Phylogeny
Apart from uni-genome alignments of ORs from five selected organisms, some cross-genome phylogenetic analyses are performed and the user can select one of the combinations to view cross-genome phylogeny (use option “Alignments and Phylogeny”) (refer Figs. 2B and 3F, G, and H). Cross-genome combinations of OR phylogenies can be accessed through DOR such as S. cerevisiae – Drosophila – H. sapiens, C. elegans – H. sapiens, and M. musculus – H. sapiens. Multiple sequence alignment (MSA) of ORs used to generate the above-mentioned phylogeny can be downloaded both in ClustalW alignment format (.aln format) and in the format suitable for MEGA alignment session (.mas format) (refer Fig. 3). 36 Phylogenetic analyses at the single and cross-genome levels provide knowledge on clustering of OR sequences based on the similarity between them. 16 For instance, the uni-genome phylogenetic study of Drosophila ORs provides a clear discrimination in the tree topology for the distribution of ORs based on tissue localization (such as receptors from sensilla, maxillary palp, and antennal lobe). 15 When ORs of Drosophila and selected human were aligned and examined by cross-genome OR phylogeny, non-co-clustering was observed as mentioned in previous studies (probably because of the reverse (N-in) topology of insect ORs). 31 Phylogenies of such disparate OR sequences across genomes were retained mainly to impart this important result of non-clustering of ORs from few genomes, for instance human and Drosophila ORs. The only functionally characterized OR (odr-10) of C. elegans with its 82 homologues was aligned with 10 selected representative human ORs,17,18 where in no co-clustering was observed.
Although there is no conflict in membrane topology between ORs in these genomes, nematode ORs stay as a separate cluster in cross-genome phylogeny with human ORs because of evolutionary lineage. But significantly, we could observe clustering of serpentine receptors with human GPCRs at the superfamily level (ie as Sra, Srg, Str, and ‘Others’ superfamily), and they were found to retain species-specific features even during cross-genome sequence phylogeny.17,18 Notably, only the annotated OR (odr-10) co-clusters with its respective Str superfamily and few hypothetical proteins were co-clustered with the Srg superfamily.
Hence, uni- and cross-genome phylogenetic analysis and the resultant clustering provides information about the most related/unrelated sequences at uni- and cross-genome levels (as species-specific clusters, co-clusters). It also provides functional annotation of unannotated/hypothetical proteins as stated in our prior studies on membrane proteins. 16 Our approach employs a rigorous alignment procedure (MAFFT) and tree generation method (NJ method of BS construction from MEGA 5.0) to obtain the trees. 38
By observing tree topology, related sequences that are formed at significant BS values were grouped into clusters, and the sequences belonging to a cluster were re-aligned. For example, 371 human ORs were grouped into 10 OR sub-clusters and were referred to as HSC1-HSC10, and the human OR sub-cluster, namely, HSC1 retains class I-type receptors (refer Table S2).
Among the 54 OR sequences from HSC1 (refer Tables S2 and S3), 49 OR sequences were annotated as class I-type receptors in the human OR phylogeny. The respective annotations were verified with the already-reported study. 23 Therefore, the human OR sub-cluster HSC1 is predominantly associated with class I-type receptors and has been further confirmed by introducing few ORs from fish and amphibians (data not shown). Also, MSA of 10 human OR clusters were used as an inbuilt dataset in the TM-MOTIF tool to observe the predicted TM-helices, conserved amino acids, and amino acid substitutions (AAS) at each position of the alignment. 36
Software and Tools
TM-MOTIF is a downloadable software tool and an effective alignment viewer to map discovered motifs and predicted membrane topology on an aligned set of OR sequences in VIBGYOR coloring scheme (refer Figure 31). 36 TM-MOTIF is helpful in mapping the discovered motifs on the uni- and cross-genomic OR clusters of interest to the user. Pre-aligned sequences of few clusters of GPCRs from human, fruit fly, and worms and 10 human OR sub-clusters are available as inbuilt datasets. Users can associate new sequences to a pre-aligned set of clusters using the sequence search option. The users can also submit their sequences of interest in the MSA (.aln format), along with multiple sequences (in FASTA format), to run the various display options such as “Run-TM,” “Run-Motif,” and “Run-TM-Motif.” Predicted TM-helices can be displayed in VIBGYOR representation using “Run-TM” option. Conserved motifs can be displayed at 60% level of conservation along with AAS at each alignment using “Run-Motif” option. Given an OR sequence and predicted helical boundaries, users can align it to a set of non-redundant GPCR templates in active and inactive states. This alignment can then be used as input for template-based modeling of OR sequences.
Structural Analysis of ORs
Selection of OR Sequences for Homology Modeling
A total of 100 representative OR sequences were chosen for homology modeling (please see Methodology and Table S4 in Supplementary Data). OR sequences belonging to different clusters can be viewed under the “Sequences and Structures” and “Organism” options in the database.
Homology Modeling of Selected OR Sequences
For every active and inactive model generated, the following files can be obtained from DOR database:
Alignment file (alignment between template and query) used for homology modeling (Fig. 4B)
Pictorial representation of available features in DOR for structural analysis. Notes: (
PDB file (output of MODELLER software after energy minimization)
PYMOL session (pse) file, (PYMOL Molecular Graphics System, Version 1.2r3pre, Schrödinger, LLC) – The file contains the OR model where in the predicted TM-helices are colored from 1 to 7 in VIBGYOR color for easy interpretation (Fig. 4C).
Validation chart – The validation chart contains information on sequence-identity of the query with respect to template, RMSD between template and query model, the final energy of the model after energy minimization, and the Ramachandran plot values for full length of the model including loops (Fig. 4D). The full-length structures of the models show more than 90% in the allowed regions (including strictly allowed and partially allowed regions) of the Ramachandran plot.
Conserved Residue Prediction of OR Proteins
For a given cluster, the multiple sequence alignment pertaining to the respective cluster and two-protein alignment between the query and modeling template were analyzed. The conserved residues were mapped on the representative sequence, using related sequences from the same cluster and structure, as mentioned in ConSurf (Fig. 4E, G, and F, respectively). 53 The user can analyze the structurally and functionally conserved residues mapped on OR sequence. The conservation is mapped on the model of OR and provided as pse file where in users can observe the residue conservation as mapped on the model and browse through the position and interactions of conserved residues in the structure.
Dimer Interface Prediction of OR Models
Interfaces of ORs were predicted by the method provided in GRIP,54,55 which requires a 3D structure of a target GPCR and its homologous sequences as mentioned in the Methodology. For every OR model, the primary and secondary dimer interfaces are predicted and mapped on the model. These results can be viewed in the “Dimer interface 1” and “Dimer interface 2” tabs of every model. One example of the dimer interface prediction is shown in Figure 4H.
Conclusion
DOR is a user-friendly and composite resource, with information on sequence and structural information of several ORs. Users can retrieve and download information on both OR sequence and structure arena for five eukaryotic genomes. The list of non-redundant OR sequences can be further used to train machine-learning algorithms and to identify potential OR sequences, and orthologs across genomes.58,59
The “Sequences and Structures” option provides non-redundant OR sequences for the targeted eukaryotic genomes (refer Figs. 3 and 5). The predicted TM-helices for each OR sequence with the start and end positions for each predicted helix are also provided from the link on the number of predicted helices. The predicted boundaries for seven helices are given in seven different colors (VIBGYOR coloring scheme) for easy observation. The option “Alignments and Phylogeny” provides the MSA at uni- and cross-genomic levels and also the phylogenetic trees generated from them. The alignments can be further used to detect conserved motifs. Cross-genome alignments are particularly useful from the evolutionary perspective, to study cluster associations and to select representative sequences.

DOR features for sequence and structural information for ORs. Notes: The three available features “Sequences and Structures,” “Alignments and Phylogeny,” and “TM-MOTIF” are given in boxes on the left-hand side. (
TM-MOTIF, a tool to detect motifs in the set of aligned OR sequences, has been incorporated into the database. 36 An inbuilt dataset of 10 human OR sub-clusters is available in the TM-MOTIF package for users to assign new sequences to these clusters and to view the alignment in VIBGYOR coloring scheme, along with identified conserved motifs on the alignment.
Best representative sequences were selected from the generated clusters (refer Table S4) for 3D modeling, to predict dimer interfaces and to discover functionally important residues and ligand binding pockets (refer Figs. 4 and 5). The development of many different TM-helix prediction algorithms and the recent upsurge of GPCR structures (for a review, please see Venkatakrishnan and coworkers 42 ) have prompted us to consult multiple prediction programs and alternate templates for TM-helix prediction and in homology modeling, respectively. New binding modes for the receptor that play important role in signaling could be identified. The availability of OR 3D models provides a great opportunity to users to analyze the spatial interaction between helices, to conserve residues within helices, and to generate electrostatic contour maps. Such analyses are not curtailed by the limited reliability of the generated models owing to distant relationship between ORs and GPCRs used for modeling. This would further help scientists understand the mechanism of OR function. The dimer-interface prediction for every structure guides us further to study the oligomerization process of these receptors and the functional significance of such higher order oligomers.
Future Work
Other well-known databases on ORs (like ORDB, 27 ORModelDB http://senselab.med.yale.edu/OrModelDB/) either provide mainly sequence information with brief summary on orthologs and paralogs for more than 60 organisms under a broad reference “chemoreceptors” or structural models for a limited number of ORs. Our DOR is an integrated repository that contains information on the sequence, structure, and function of non-redundant dataset of ORs, but for a limited set of five selected eukaryotic genomes. Initiatives have been taken to include OR sequences and structures from additional genomes such as fish and amphibians. This inclusion, in particular, will help users to explore class I- and class II-type receptors in great detail. OR sequences from other genomes will be added to update DOR in future.
Currently, the DOR database provides 3D models for only 100 ORs because of the difficulty in selecting appropriate templates, paucity of closely-related homologues of known structure, and conflicts in predicted topology. Owing to remote homology, limited results are reported for the interface predictions. However, attempts will also be made to provide 3D models in the lipid bilayer and predict ligand binding through virtual screening in the near future. We would, in future, select OR sequences (known data on odor binding) for docking and molecular dynamics analysis. This would provide an insight into functional characterization of these receptors.
Efforts were made to train SVM by using the curated ORs (class A type) dataset as positive dataset and GPCRs (non-class A type) dataset as negative dataset to define the features of class A ORs (refer Table S5). This could be effectively used to detect putative ORs from other genomes and be used for vast practical applications.
Sequences from additional genomes of our interest can be analyzed for phylogeny, and the resultant uni-genome/cross-genome OR clusters can be incorporated into TM-MOTIF program. 36 This could be useful to identify cluster-specific motifs, and a graphical display of secondary structural details can be made for further analysis such as dimer interface prediction (homodimers and heterodimers), ligand-docking, and rational virtual screening of large-scale odor molecules.
Author Contributions
Conceived and designed the experiments: MG, GA, KF, RS. Analyzed the data: BN, SDK, VB, GA, DR, MI, KS, SG. Wrote the first draft of the manuscript: BN, SDK, KH, KS, WN. Contributed to the writing of the manuscript: MG, GA, KF, RS. Agree with manuscript results and conclusions: MG, WN, MG, VB, GA, KF. Jointly developed the structure and arguments for the paper: BN, SDK, KH, RS. Made critical revisions and approved final version: RS. All authors reviewed and approved of the final manuscript.
Abbreviations
olfactory receptor
Protein Data Bank
support vector machine
extracellular loop
G-protein-coupled receptor
Human Olfactory Data Explorer
Olfactory Receptor Database.
Supplementary Data
Figure S1
Prediction of HMMTOP, TMHMM, and PHOBIUS on one OR sequence and the consensus TM-predictions mapped on a sequence.
Table S1
Sequence identity of 100 OR sequences of GPCR structures.
Table S2
Sequence identity of class I OR sequences with OR sequences from previous analysis.
Table S3
Analysis on sequence identity of 10 human OR subclusters.
Table S4
List of selected representative human OR sequences with their respective protein ID.
Table S5.1
Negative dataset for SVM.
Table S5.2
Positive dataset for SVM.
Footnotes
Acknowledgments
We thank NCBS for infrastructural facilities. We also acknowledge Mathew K. Oommen for help in maintaining the updates of DOR web page.