
Abstract
The mitochondrial genome is widely studied in a variety of fields, such as population, forensic, and human and medical genetics. Most studies have been limited to a small portion of the sequence that, although highly diverse, does not describe the total variability. The arrival of modern high-throughput sequencing technologies has made it possible to investigate larger sequences in a shorter amount of time as well as in a more affordable fashion. This work aims to describe a protocol for sequencing and analyzing the complete mitochondrial genome with the Ion PGM™ platform. To evaluate the protocol, the mitochondrial genome was sequenced to approximately 210 Mbp, with high-quality sequences distributed between 12 samples that had an average coverage of 1023× per sample. Several variant callers were compared to improve the protocol outcome. The results suggest that it is possible to run up to 120 samples per run without any loss of any significant quality. Therefore, this protocol is an efficient and accurate tool for full mitochondrial genome analysis.
Introduction
In the past 25 years, human populations have been targeted in several studies by anthropologists, linguists, geneticists, and others who aim to understand the evolutionary factors involved in the formation of sociobiological populations. Classical genetics and polymorphism studies helped to reconstruct part of the history of world populations. 1 6
Mitochondrial DNA (mtDNA) offers several advantages for evolutionary and population genetics compared with nuclear DNA,7,8 such as (i) high number of copies per cell (up to 1000 copies in nervous system-specialized cells, an important feature for rescuing ancestral DNA from degraded samples), (ii) small genome size (16,659 bp), (iii) maternal haploid heritage (passing from mother to progeny without any recombination), and (iv) high mutation rate that allows the tracking of changes over short periods of time, such as the process of human settlement.1–7,9 However, most works have been limited to investigating the hypervariable regions (HVS), which do not represent all the variability of mtDNA. Currently, to address this problem, researchers have employed, among other strategies, full mitochondrial genome sequencing with modern high-throughput sequencing technology. 10 13
Sanger sequencing still presents several advantages, such as high quality and large extension of the generated sequences. However, Sanger sequencing has high costs and demands a large amount of time for full genome sequencing (even for small genomes such as the mitochondrial). New benchtop sequencing platforms, such as MiSeq (Illumina, San Diego, CA, USA) and Ion Personal Genome Machine™ (Ion PGM™ – Life Technologies, Foster City, CA, USA), 14 have allowed access to sequencing data in a small operating time. These technologies have added a separate chapter in the study of population genetics.10,11 However, they are not widely employed, particularly the new technologies, such as Ion PGM™ (Life Technologies).
Considering cost, quality, throughput, and operating time, the new benchtop sequencing technologies are good alternatives to full mitochondrial genome sequencing for forensic, medical, and population studies. Therefore, this work proposes a standard protocol for sequencing and analyzing the complete mitochondrial genome with Ion PGM™ (Life Technologies).
This new protocol includes a mtDNA library preparation and a bioinformatics analysis workflow. Unlike the manufacturer's protocol, this protocol performs all the analyses on an external Linux workstation to avoid consuming sequencer time and enables the use of other third party software for analysis. This study aimed to address, among others, the following goals: to (i) provide a standard mitochondrial preparation and analysis protocol with Ion PGM™ (Life Technologies), (ii) evaluate the efficiency of the variant discovery tools, and (iii) estimate the best software to obtain high-quality results.
Material and Methods
Sample Preparation
This study was composed of 12 DNA samples obtained by oral swab and peripheral blood from anonymous, unrelated Portuguese individuals. All of the samples were collected according to the ethical principles of the Declaration of Helsinki with written informed consent. The total DNA from the oral swab samples was extracted using Chelex® 50 resin (Bio-Rad, Hercules, CA, USA) and from peripheral blood using the PureLink™ Genomic DNA Kit (Invitrogen, Foster City, CA, USA). The samples were later quantified with a Qubit 2.0 Fluorometer (Invitrogen) and were diluted to 10 ng/μL.
mtDNA Amplification
mtDNA was amplified with the primers developed by Torroni et al. 15 and Ramos et al. 9 (Table 1). A total of 12 overlapping amplicons with length between 1270 and 1870 bp were produced to cover the complete mitochondrial genome for each sample. The PCR product was visualized in a 2% agarose electrophoresis gel (Fig. 1), purified using an Invisorb Fragment CleanUp Kit (Invitek, Hayward, CA, USA) and quantified with a Qubit 2.0 Fluorometer (Invitrogen) using the Quant-iT dsDNA HS Assay Kit (Invitrogen).
Primers applied to complete mitochondrial genome amplification.

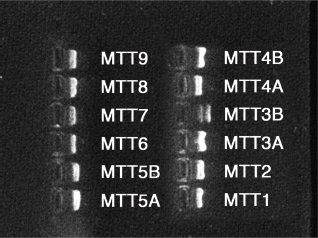
PCR product visualization. Agarose electrophoresis gel (2%) for the visualization of PCR products.
ION PGM™ Barcode Library Construction
The barcode library construction was performed following the protocol “Preparing Long Amplicon Libraries” (Life Technologies) and using the Ion Xpress™ Plus Fragment Library Kit (Life Technologies). A pool of 96 ng of DNA for all of the samples was produced using 8 ng from each. The enzyme Ion Shear Plus Enzyme Mix II (Life Technologies) fragmented the sequences. The product was later purified with the Agencourt AMPure XP Reagent (Beckman Coulter, Passadena, CA, USA), which was added to the Ion P1 and Ion Express Barcode X adapters (Ion Xpress™ Barcode Adapters Kit, Life Technologies) and was hen purified again. A total of 200 base-pair fragments were selected using E-Gel SizeSelect Agarose Gels (Invitrogen). The results were quantified with a Qubit 2.0 Fluorometer (Invitrogen) to confirm the presence of DNA, which were amplified using a Ion Plus Fragment Library Kit (Life Technologies) and purified again to produce the mtDNA libraries for each sample.
The libraries were gathered into a pool of the same concentrations to perform emulsion PCR and enrichment following the Ion Xpress™ Template Kit v2.0 (Life Technologies) protocol. The result was deposited into an Ion 316 Chip Kit (Life Technologies) following the Ion PGM™ 200 Sequencing Kit (Life Technologies) protocol and inserted into an Ion Personal Genome Machine™ System (Life Technologies) for sequencing. The detailed protocol of all procedures is described in the Supplementary Protocol.
Bioinformatic Analysis Workflow
The reads discriminated by barcode (1-12, corresponding to the samples) were transferred to a Linux workstation (24 GB of RAM and CPU 3.0 GHzwith eight cores) for analysis. The reads were converted into FASTQ format using sff_extract (http://bioinf.comav.upv.es/sff_extract/). Read quality was evaluated using FastQC (http://www.bioinformatics.babraham.ac.uk/projects/fastqc/), and low-quality reads were filtered and trimmed using fastx_tools (http://hannonlab.cshl.edu/fastx_toolkit/).
The reads were aligned to the revised Cambridge Reference Sequence (rCRS) 16 using two strategies. The first employed the licensed platform CLC Genomics Workbench 4.9 (CLC Bio, Cambridge, MA, USA) and the second used the open source software Torrent Mapping Alignment Program (TMAP) v.0.3.7 (https://github.com/iontorrent/TMAP) employed in Torrent Suite (Life Technologies). The CLC Genomics Workbench (CLC Bio) has a friendly graphical user interface and a complete analysis platform, among many other features. Conversely, TMAP only has a command line interface but offers compatibility with many common bioinformatics tools.
Both strategies produced Binary Sequence Alignment Map (BAM) format alignments that were processed, indexed, sorted, and analyzed by the tools included in the SAMtools 0.1.17 17 and GATK2.7 18 packages.
Variant Calling
Three strategies were employed for variant calling: the first used the CLC Genomics Workbench 4.9 (CLC Bio) on the CLC alignments, the second used SAMtools on the TMAP alignments, and the third used the GATK variant analysis workflow on the TMAP alignments. The complete bioinformatics workflow is described in detail in the Supplementary Bioinformatics Protocol.
The Single Nucleotide Polymorphism (SNP)s were classified as transitions and transversions, and as synonymous and non-synonymous according to the MITOMAP 19 database. The pN/pS ratio was calculated from these results according to the equation pN/pS = (NSY/N)/(SYN/S), where NSY is the number of non-synonymous mutations observed, N is the number of non-synonymous mutation sites, SYN is the number of synonymous mutations observed, and S is the number of synonymous mutation sites.
To validate our results, two individuals' HVS regions were sequenced by Sanger sequencing and compared to our results. To estimate the protocol potential sample size and minimum coverage, the reads of both individuals were randomly sampled at several rates (2.5, 5, 10, 25, and 50% of the reads) with 100 repetitions each and were compared to the Sanger results. Furthermore, the variants of each repetition were compared among their sampling to infer variant calling coherence.
Statistical Analysis
Statistical analyses and data plotting were performed in R v3.0 (http://www.r-project.org/) statistical package with the aid of ggplot2 v0.9.8 20 package.
Results and Discussion
A single Ion 316 Chip Kit (Life Technologies) run produced 1,341,502 reads and approximately 210 Mbp of sequence distributed across 12 samples (Table 2). All of the barcode reads were correctly identified, with less than a 1% loss, and were uniformly distributed among the samples, corresponding to 8% (approximately 100,000 reads), which is more than that has been reported in previous works10,11 (Table 2). The reads demonstrated an overall good quality (QV ≥ 20) until their 250th base, confirming the protocol quality (Fig. 2).
Number of reads and mapped reads per sample.
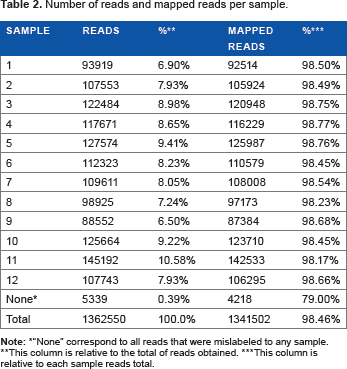
“None” correspond to all reads that were mislabeled to any sample.
This column is relative to the total of reads obtained.
This column is relative to each sample reads total.

Sequenced sample quality distributions per read position. The following plot displays the distribution of qualities per read position obtained by the FastQC software. In the graph, the thick line represents the median quality obtained in the respective read position, and the box represents the quality obtained between the first and third quartiles.
Both alignment strategies yielded similar total mapped reads and coverage. Although less user friendly than CLC, TMAP is recommended because it is faster, license free, and easily compatible with other bioinformatics software. TMAP aligned 98.45% of the reads with average coverage of 1023× for all samples. Schönberg et al. 10 who studied 149 individual mitochondrial genome sequences, obtained an average coverage of only 97.69×, and Gunnarsdóttir et al. 11 who studied 109 individuals, obtained an average coverage of only 54.6×, confirming the quality of our approach. To visualize our results, the mean coverages of consecutive 100-bp windows of the mitochondrial genome are plotted in Figure 3. On average, no window displayed coverage below 500×, although a single sample presented low coverage, likely because of either an unknown deletion or machine error.

mtDNA sequencing coverage per sample. This graph represents a polar plot, the coverage (log10 scale) for each 100-bp mitochondrial genome window for each of the samples, and the grey highlighted areas in the graph represent the amplicon overlap.
To infer the best variant calling strategy and sample size, the results were compared to HVS Sanger sequencing (Table 3). The CLC variant caller is based only on coverage and quality, and is fast and efficient for high-coverage data (>20×).21,22 Conversely, GATK and SAMtools compute the Bayesian genotype likelihood to infer the most probable genotype. This strategy has produced consistent results and consider several samples during genotype imputation that correct low-coverage data (<10×).21,22 Overall, all three strategies presented more than 99% correct rates (rate of correctly called bases by the size of HVS region) (Fig. 4) above the 10% sampling rate, suggesting that, theoretically, up to 120 samples could be sequenced in a single run with a mean coverage of 95.24×, which is similar to previous works.10,11 Unfortunately, commercial barcode libraries have, at most, 96 different tags. Conversely, medical studies are interested in mitochondrial heteroplasmy, and as suggested by Holland et al. 23 and Wong. 12 Next-Generation Sequencing (NGS) may allow the detection of low heteroplasmy levels but demands high-coverage values. Therefore, the number of samples must be adjusted according to the study goals.
Number of variable sites, transitions, transversions, insertions, deletion, synonimous, non-synonimous and pN/pS ratio per mtDNA region.

Mean pN/pS ratio: 0.226.

Correct and miscall rate by read sampling rate. This graph presents the correct and miscall rate by sampling rate and variant calling strategy (CLC, SAMtools, and GATK) compared to the Sanger HVS sequencing. The correct rate is the rate of correctly called bases by the size of HVS region, and the miscall rate is the rate of miscalled bases by the size of HVS region.
Variant calling sampling sensibility was evaluated by measuring the rate of genotype concordance between repetitions of each sampling. All the strategies and samplings were consistent with a 99% concordance rate (Fig. 5) above a 10% sampling rate.
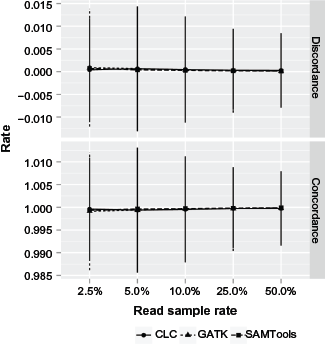
Concordance and discordance rate by read sampling. This graph presents the genotype concordance and discordance rate by sampling rate and variant calling strategy (CLC, SAMtools, and GATK). The concordance rate is the rate of concordant bases between all sampling repetitions divided by the mtDNA length, and the discordance rate is the rate of discordant bases between all sampling repetitions divided by the mtDNA length.
A total of 324 polymorphic sites were observed among all samples, of which 249 were transitions, 15 were transversions, 30 were insertions, and 30 were deletions (Table 4), similar to findings by Gunnarsdóttir et al. 11 and Schönberg et al. 10 However, Schönberg et al identified 855 variant sites, likely because of the different number of individuals and populations investigated (147 individuals from five populations from West Asia). The relative numbers of mutations per classification were similar among all the works (0.93 ± 0.02). Regarding the ratio of transitions to transversions, coding regions presented higher values (17.0) than the control or hypervariable regions (15.5), as previously described.10,11,24 The tRNA regions contained 12 variants, an elevated number considering Gunnarsdóttir et al. 11 detected only 14 among their samples, but in accordance with the number observed by Schönberg et al. 10 (39). These variants in tRNA regions are potential targets for future studies.
Variant call strategy correct rate by sampling rate.

Among the 13 protein-coding regions, 119 synonymous mutation sites and 45 non-synonymous mutation sites were observed (Table 4). The pN/pS ratio was similar to previous works10,11 (P = 0.19 and 0.66, respectively). Likewise, the pN/pS ratio varies significantly among the regions (P = 0.002). All the rates were lower than one, but it is important to highlight that the genes ATP6 (0.484), CYB (0.592), and ND3 (0.957) yielded values farthest from the average (0.226). Compared with the distribution of the pN/pS values from the present work, Gunnarsdóttir et al. 11 and Schönberg et al. 10 observed the widest divergence at ND3, CYB, and ATP8 genes, whereas higher values were observed at ATP6 gene (Fig. 6), suggesting a lighter selective pressure as described previously.10,11
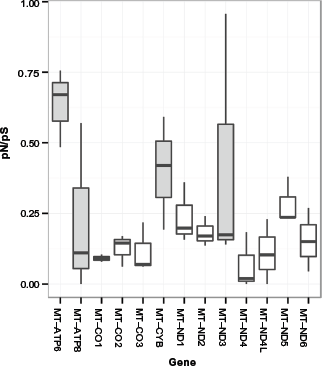
pN/pS ratio distribution per gene. This boxplot displays the pN/pS ratio distribution through the present, Schönberg et al, and Gunnasdóttir et al works, and genes with wider variations and larger pN/pS ratios are highlighted.
To achieve similar results with Sanger sequencing, it would be necessary to perform 12 sequencing reactions per sample, totaling 144 reactions (considering that each amplicon can be sequenced by a single reaction). Each reaction costs approximately $20 and takes approximately 40 minutes to complete; therefore, a similar experiment would cost approximately $2880 and take four days to complete. High-throughput platforms, such as HiSeq (Illumina) and SOLiD (Life Technologies), have a low cost (approximately $0.10/Mbp), but library preparation is complex and the run takes approximately one week or more to complete; each run costs approximately $10,000. 25 28 Conversely, benchtop platforms, such as MiSeq (Illumina), are good alternatives that cost only $1/Mb, with a running time of 27 hours and an average output of 1.5 GB/run. The Ion PGM™ platform has an average cost of $2/Mb and an output of 200 Mbp/run (Ion 316 Chip Kit), but it compensates for this higher cost and limited yield with a running time of only three hours and a small instrument cost (compared with other next-generation platforms). Therefore, the Ion PGM™ yields a good cost-per-run and running time alternative.
Regarding the other protocols for mtDNA genome sequencing employed in the literature,10,11,13 ours is highlighted by its potential to analyze rare and degraded samples. These types of samples, common for forensic and ancient DNA, yield little DNA, and most of the sequences are broken into small fragments. Unlike other protocols10,11,13 that employ few amplicons, our protocol uses 12 amplicons to facilitate the rescue of the complete mtDNA genome of even degraded samples.
Conclusions
The results have demonstrated the accuracy and sensibility of our protocol. The sequencing in this protocol produced over 200 Mbp of high-quality nucleotide sequences (QV ≥ 20) and had made possible the alignment of the full mitochondrial genome of 12 samples using more than 98% of the reads, with an average coverage of 1023×, which is far greater than that of previous works employing similar technologies.10,11 The present work also proposes a sample size increase of up to 96 (as achievable by the barcode libraries), an important feature for population genetic studies. Conversely, the protocol may also be employed for heteroplasmy detection, which is important for forensic and medical studies.12,23 The protocol accuracy was further confirmed by polymorphism analyses. The HVS comparison to Sanger sequencing yielded an accuracy rate of 96% for the best caller (GATK), a value that may even be underestimated because of the small number of samples available for Sanger analysis. Our findings were also compared to previous works and displayed similar patterns.10,11,24 This protocol benefits in the analysis of degraded samples, which are common in forensic and anthropology fields. In conclusion, the proposed protocol provides an important tool for population, medical, and forensic genetics.
Author Contributions
LG and ARS conceived and designed the experiments. AMRS analyzed the data. AMRS and IGH wrote the first draft of the manuscript. AMRS, IGH, LA, LG, and ARS contributed to the writing of the manuscript. IGH, LA, and SB jointly developed the structure and arguments for the paper. AS, SS, LG, and ARS performed critical revisions and approved the final version. All the authors reviewed and approved the final manuscript.
Supplementary Material
Supplementary Protocol.pdf
This protocol includes the complete description of all the molecular assays performed to prepare and apply the mtDNA library on Ion PGM™, including the mitochondrial genome amplification and the Ion DNA library preparation.
Supplementary Bioinformatics Workflow.pdf
This workflow includes the complete description of all the bioinformatic steps applied to perform all the analyses described in the paper, including the command line instructions for each step.
Footnotes
Acknowledgments
The authors would like to thank the researchers Marco Antônio Trindade Amador and Pablo Diego Carmo Pinto for helping to develop the experiment.