
Abstract
Background
While many bioinformatics tools currently exist for assembling and discovering variants from next-generation sequence data, there are very few tools available for performing evolutionary analyses from these data. Evolutionary and population genomics studies hold great promise for providing valuable insights into natural selection, the effect of mutations on phenotypes, and the origin of species. Thus, there is a need for an extensible and flexible computational tool that can function into a growing number of evolutionary bioinformatics pipelines.
Results
This paper describes the POPBAM software, which is a comprehensive set of computational tools for evolutionary analysis of whole-genome alignments consisting of multiple individuals, from multiple populations or species. POPBAM works directly from BAM-formatted assembly files, calls variant sites, and calculates a variety of commonly used evolutionary sequence statistics. POPBAM is designed primarily to perform analyses in sliding windows across chromosomes or scaffolds. POPBAM accurately measures nucleotide diversity, population divergence, linkage disequilibrium, and the frequency spectrum of mutations from two or more populations. POPBAM can also produce phylogenetic trees of all samples in a BAM file. Finally, I demonstrate that the implementation of POPBAM is both fast and memory-efficient, and also can feasibly scale to the analysis of large BAM files with many individuals and populations.
Software
The POPBAM program is written in C/C++ and is available from http://dgarriga.github.io/POPBAM. The program has few dependencies and can be built on a variety of Linux platforms. The program is open-source and users are encouraged to participate in the development of this resource.
Introduction
Evolutionary genetics research routinely capitalizes on the vast amount of data made available by next-generation sequencing technologies. It is now possible to generate high-quality, high-coverage sequence of genomes from conspecific samples or samples from closely related species. These new whole-genome evolutionary analyses are yielding remarkable insights into the nature of adaptive evolution, the genetic basis of quantitative traits, and the origin of species.1–5 Many of these new studies employ chromosome-level spatial scans to identify regions of potential interest. For example, Ellegren et al 2 scanned the genomes of two closely related species of Ficedula flycatcher to identify genomic regions with elevated levels of sequence divergence to aid in the identification of genomic regions involved in the evolution of reproductive isolation. Similarly, Jones et al 4 scanned the genomes of freshwater and marine sticklebacks to identify the genetic basis for adaptation to freshwater and marine environments. Finally, Garrigan et al 3 used whole-genome scans to discover regions of gene flow between species of Drosophila that have already evolved post-zygotic reproductive isolation.
There is a rapidly increasing number of computational tools for performing either reference-based or de novo genome assembly from short-read next-generation sequence data. For reference-based assembly, much of the research has concentrated on developing efficient algorithms for indexing either the reference sequence, the short-read sequences, or both (see Li and Homer 6 for a review). Similarly, the development of algorithms for de novo sequence assembly is also an active field of research and many methods seek to optimize the resolution of the large de Bruijn (or related) graphs into contigs and scaffolds (see Miller et al 7 for a review). However, tools for sequence assembly are not the only areas of active research. Significant progress is being made on improving algorithms for many downstream tasks, such as improving scaffold construction, 8 dealing with repetitive sequence, 9 calling single nucleotide polymorphisms (SNPs), 10 and phasing of haplotypes. 11
Current research should be directed towards the development of computational tools for assembling and refining high-quality alignments from next-generation sequence data. However, much less development has been directed towards downstream evolutionary-based analyses, such as measuring levels of nucleotide diversity and linkage disequilibrium (LD), fitting models of population divergence, and testing for natural selection. It is evident that the analysis tools that evolutionary geneticists have relied on for so long do not feasibly scale to the level of whole-genome analysis. 12 Most evolutionary investigators working with large whole-genome alignments are forced to cobble together a custom bioinformatics pipeline and develop their own tools to parse the needed information. In this paper, I describe an effort to provide a publicly available solution for the evolutionary analysis portion of a next-generation sequencing pipeline. The POPBAM program is a comprehensive suite of evolutionary genomics tools that can be used to analyze whole-genome alignments from multiple individuals, from multiple populations. POPBAM is ideally designed to work in sliding windows across chromosomes or scaffolds. POPBAM has been in continuous development since 2010 and is currently in its third beta release. This paper describes the basic functionality, usage, and performance of the program. POPBAM is also open-source and the community is encouraged to request and help develop needed functionality.
Methods
Overview of the POPBAM program
The POPBAM program is written in a mixture of the C and C++ languages. POPBAM is provided as open-source software under the MIT license. POPBAM is currently in its third beta release. The source code is freely available through the GitHub website (http://dgarriga.github.io/POPBAM). The only dependency for compiling POPBAM is the zlib compression library (http://zlib.net). POPBAM successfully compiles with the GCC compiler (versions 4.4.6 up to 4.7.2 have been tested with the current POPBAM source) and was successfully built with the Microsoft Visual C++ compiler (version 11.0.60315). However, successful compilation requires the C++ 11 standard library. 13 Currently, POPBAM comprises more than 17,000 lines of source code. The majority of the source code for reading BAM files and constructing pileups was forked from SAMtools version 0.1.18 (https://github.com/samtools/htslib), which also includes code for the klib library for constructing generic hash tables (https://github.com/attractivechaos/klib). Furthermore, source code from the PHYLIP version 3.69 14 program was incorporated and modified to construct neighbor-joining trees.
Inputting data into POPBAM
The sequence alignment/map (SAM) format and the compressed version (BAM) are the de facto standard for storing reference-based next-generation sequence assemblies. BAM files include a header containing metadata, the sequence reads, mapping and base qualities, and alignment information in an efficiently compressed format. 15 While POPBAM is capable of reading any BAM file, it is specifically designed to work with merged BAM files that contain reads from multiple samples (individuals). Furthermore, POPBAM is able to group the individual samples according to the population from which it was taken. How POPBAM deals with assigning reads to populations depends upon the information in the header of the BAM file itself. A BAM file header will typically include a sequence dictionary with information about the reference sequence used to generate the assembly and additional information about each read group. A read group typically represents the set of short read sequences generated from a single lane in an Illumina sequencer. In the BAM header, individual read groups can be annotated as coming from a particular sample, or individual (denoted with the standard tag “SM” in the “@RG” line in the BAM header). Therefore, individual samples can be represented by multiple lanes from a sequencer. As an additional layer of hierarchical grouping, POPBAM allows samples to be grouped according to population; this is achieved by the user inserting a modified “@RG” header line that includes the new “PO” tag. The “PO” tag can be any string, as long as the string is identical between samples from the same population.
As an example of how POPBAM assigns reads to samples and populations, consider a BAM file that has three read groups, which are labeled R21, R22, and R25. In this hypothetical example, the R22 and R25 read groups are from two different individuals of the fruit fly species Drosophila melanogaster called “MEL001” and “MEL002”, respectively. The third read group, R21, is from a single individual of the related species D. mauritiana labeled “MAU001”. Thus, the above read group information from the header of this example BAM file would appear as the following three lines:

POPBAM will analyze the above example as two populations, “MAU” and “MEL”, with the “MEL” population having two samples, each represented by a single read group and the “MAU” population represented by only one sample and one read group. The non-standard “PO” tag has to be added manually by the user by editing the text of the BAM header and then re-headering the BAM file with programs such as SAMtools 15 or PICARD (http://picard.sourceforge.net). Alternatively, POPBAM has an option to allow the user to input the BAM header as a separate text file. When adding the “PO” tag, please be advised that the fields of the read group entry must be tab-delimited.
SNP calling
POPBAM will call the consensus genotype for each individual included in a BAM file. POPBAM has the option of calling either a haploid or diploid genotype. The method that POPBAM uses for calling genotypes follows the method outlined in Section 3 of the Supplementary Text of Li et al. 16 Briefly, let α nk be the probability that exactly k reads have errors out of a total of n reads covering a given genomic position. If the sequences of all reads are assumed to be generated independently, then we might expect that

where ε x is the probability that the base in read x is incorrectly called. Empirically, the values of ε are the error probabilities generated during sequencing. However, if errors can be correlated, then we can re-write α nk as
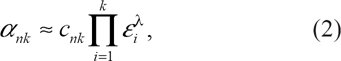
in which cnk is the probability of k errors, given k − 1 errors, and λ is a parameter that controls the error dependency. POPBAM assumes that λ = 0.85. 16 Furthermore, POPBAM improves the accuracy of the consensus genotype call by calculating the probability in Equation 2 separately for reads coming from different strands since errors are expected to be independent between reads for the forward and reverse strands.
POPBAM has a number of options for filtering sites based on different assessments of data quality. All POPBAM commands have global options for filtering reads on quality. For example, the user can set a minimum base quality score for POPBAM to consider individuals sites. Similarly, the user can set minimum mapping qualities for individual reads to be considered, a minimum root mean square mapping score for a consensus base to be called, or a minimum SNP quality score to consider a variant as valid. All quality scores are implemented as Phred scores. 17 Quality scores are assumed to be on the Sanger scale; however, POPBAM can also convert quality scores from the Illumina 1.3+ format. 18 Lastly, users may also exclude sites that either do not have a minimum number of reads aligned for an individual sample or exceed a maximum number of mapped reads. Sites with insertions or deletions are detected by POPBAM, but not considered for further analysis.
Evolutionary analyses
Table 1 lists the seven main command options for the POPBAM program. The first command is called
A description of the seven analysis commands that are available in the current version of the POPBAM software.

POPBAM provides a range of options for analyzing haplotype structure and diversity. Most haplotype-based options are implemented in the

where j is the count of the derived allele and n is the total sample size. 24 Similarly, define hk as an unbiased estimate of extended haplotype homozygosity over the entire genomic interval,
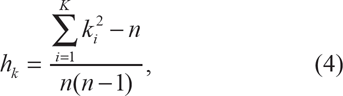
in which ki is the count of extended haplotype i and K is the total number of unique extended haplotypes. Then,
It is expected that EHHS = 0 when each individual in the sample carries a unique haplotype, while EHHS = 1 when the haplotype homozygosity is identical to the site homozygosity at the core SNP. The POPBAM

(see below for definitions of
The POPBAM

in which rij is the correlation coefficient of allele frequencies at SNPs i and j and S is the number of segregating sites in a window. 26 POPBAM has the option of excluding singleton sites when calculating the pairwise values of r 2 . Similarly, for each segregating site, LD can be partitioned on either side of the site to calculate ω:

Then, ωmax is derived from the site in the window that yields the maximum value of ω.
27
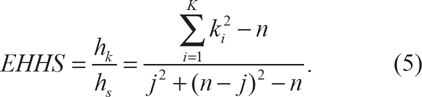
Lastly, Wall's B and Q statistics focus on runs of segregating sites that partition the data in an identical pattern. If site type

and similarly, for Wall's Q,
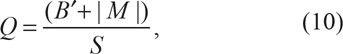
in which |M| is the number of distinct partitions induced by congruent pairs of segregating sites. 28
In addition to the haplotype-based statistics, POPBAM provides functionality for calculating nucleotide diversity within populations and the average number of nucleotide differences between populations. The POPBAM

in which dij is the Hamming distance between sequences i and j, as well as the average number of nucleotide differences between populations,

in which d is the Hamming distance between all sequences from population x with sample size nx and population y with sample size ny.
29
POPBAM reports both π and

The
The
The POPBAM
Finally, the

in which
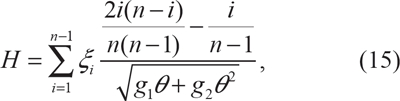
in which g1 and g2 are given in Zeng et al
37
and POPBAM estimates θ as Watterson's moment estimator of the population mutation rate.
38
Tajima's D and Fay and Wu's H were chosen because they consider both the folded and unfolded site frequency spectra, respectively. For the unfolded site frequency spectrum, POPBAM assigns ancestral and derived alleles using the reference sequence; however, the user can also manually specify which sequence should be used as an outgroup to polarize the directionality of a given mutation. The raw count of derived mutation frequencies can be obtained using the
Output and post-processing
POPBAM is designed to calculate a variety of evolutionary-based statistics in non-overlapping genomic windows. The windows are uniformly sized relative to the reference genome coordinates and the size of the windows can be specified by the user at run time. All POPBAM output is formatted as text and is tab-delimited. The output of POPBAM is specifically tailored to be input seamlessly into the R statistical environment. 39 Each of the POPBAM commands produces differing output fields; however, the first four fields are identical across commands: the first column always prints the scaffold/chromosome name, the second column prints the position in the reference sequence where a window starts, the third column prints the reference position of the end of the window, and the fourth column is the total number of aligned sites in the window that was used in the analysis (this includes invariant sites). The columns that follow the fourth column depend upon the POPBAM command and the output options being used. Typically, statistics will be output grouped by populations in the order in which the populations are defined in the BAM header. Exceptions to this output format are limited to the snp function, which generates output formatted as input for a different program or as a list of consensus genotype calls, which also give the SNP quality score and the read depth for each individual in the BAM file. If a particular calculation is not possible in a given window, POPBAM will output the string “NA”, which will be read by the R statistical environment as a missing value.
I provide an example case of using POPBAM to scan the major chromosome arms of ten lines of Drosophila melanogaster
40
and a single line of D. mauritiana
3
for the signature of recent positive natural selection. The D. melanogaster sample comprises nine lines from sub-Saharan Africa and a single line from France. Furthermore, each D. melanogaster individual is represented by a single read group of paired-end 76 bp Illumina reads. The D. mauritiana outgroup is from a single individual with a single read group of paired-end 86 bp Illumina reads. First, the POPBAM
Assessing performance
The performance of the POPBAM program was assessed using a BAM file created from the Drosophila melanogaster short read data described in the previous subsection. However, only the X chromosome was considered for the purposes of measuring the execution time and memory usage of the POPBAM program. The length of the reference sequence for chromosome X is 22,422,827 bp and the input BAM file is 6.8 Gb consisting of a total of 103,464,508 mapped reads. The POPBAM program was tested on server running the Red Hat® Enterprise Linux® 6.4 operating system with dual Intel® Xeon® L5630 processors running at 2.13 GHz with 144 Gb of RAM. POPBAM was compiled using GCC version 4.4.7–3.
Program execution time was assessed using the GNU time program (version 1.7) for the seven different POPBAM commands. Additionally, program execution time as a function of the total alignment length, number of individuals, and the window size was also measured. Furthermore, a profile of POPBAM was created using the GNU profiling tool gprof and the memory heap was profiled using the massif module of the program valgrind.
Results
Performance
Table 2 shows the execution time and peak memory usage trials for each of the major evolutionary analyses performed by POPBAM. In this case, the window size is 10 kb and there is a small amount of variation in both execution time and peak memory usage among the different POPBAM functions. The
Time and memory trials reported separately for the main components of POPBAM functionality. The circumstances of the trials are provided in the text.

The profiling of POPBAM indicates that the program spends nearly two-thirds of its execution time parsing the auxiliary data associated with each read and assigning individual reads to samples and populations. Over 15% of POPBAM execution time is spent generating consensus genotypes. Slightly less than 10% of the execution time is spend processing the pileup from the BAM file. Approximately 8% of the total time is spent implementing the error model. All other functions take less than 1.5% of POPBAM's total execution time. This suggests that POPBAM's run time could be shortened considerably by allowing the program to operate on an input file that consists only of previously called consensus genotypes, such as the VCF format. 41 However, most analyses performed by POPBAM would require a VCF file that also includes all invariant sites as well as variant sites.

Time and memory trials for the nucdiv command (top row) and the ld command using the ωmax option (bottom row). In all graphs, the filled bars show the execution time (in seconds) and the line shows the peak memory usage in megabytes (note that megabytes are shown on the secondary vertical axis, while megabases are shown on the horizontal axis). The first column of graphs shows results for various window sizes. The second column shows results for different total alignment length. Finally, the third column of graphs shows the results for BAM files consisting of either five or ten ingroup individuals (not including one outgroup individual).
Example output
Figure 2A plots the output of the POPBAM

Panel (A) shows the spatial distribution of nucleotide diversity (π) in 10 kb windows across each of the major chromosome arms in ten lines of Drosophila melanogaster. Panel (B) shows the distribution of 10 kb windows on chromosome 3R for the linkage disequilibrium statistic, ωmax, which is sensitive to patterns caused by recent selective sweeps. The window beginning at position 17,250,000 has a significant outlier for ωmax (see text). Panel (C) shows 1 kb windows of ωmax (top) and π (bottom) in the outlier region of chromosome 3R. Finally, panel (D) shows the neighbor-joining tree for the 1 kb window spanning positions 17,250,000–17,251,000 on chromosome 3R with the highest ωmax statistic. D. melanogaster sequences are labeled with the prefix “Dmel” and the D. mauritiana sequence is labeled with the prefix “Dmau”.
It is worth noting that, during its years of development, the numerical accuracy of the statistics calculated by POPBAM have been verified by comparing them with calculations from other programs, such as those built with the libsequence package 21 and the DnaSP program. 42
Conclusions
The POPBAM program is a flexible and extensible tool for conducting studies of population and evolutionary genomics. Although the current beta release of POPBAM has some necessary limitations, goals for the release candidate version of POPBAM include the ability to read and write VCF files and to incorporate genome features, such as those stored in GFF3 files (http://www.sequenceontology.org/resources/gff3.html), to measure levels of nonsynonymous and synonymous polymorphism and divergence, and to analyze polymorphism and divergence by site type (eg, exon, intron, 5′ untranslated regions, etc.). It is important to note that POPBAM is not intended to perform higher-order functions, such as multi-locus or composite likelihood types of analyses. Rather, POPBAM is intended to be used as the penultimate step in any evolutionary bioinformatics pipeline, to fill the void between the genome assembly steps and the final, integrative whole-genome statistical analyses. It fulfills this role by providing an efficient means to measure many aspects of genome polymorphism and divergence. By making POPBAM open-source, I hope that additional functionality and improvements will be suggested by the community of evolutionary investigators working with large next-generation sequence data sets.
Footnotes
Acknowledgments
Thanks to J. Fuller, A. Geneva, S. Kingan, L. Lovato, and J. Vedanayagam for thorough alpha testing of the POPBAM program. Special thanks to Carlos Machado and the Oryza Genome Evolution project for extensive beta testing of POPBAM. Thanks to Sarah Kingan for comments on an earlier draft of this manuscript and helping run the analysis on the Drosophila melanogaster data. Thanks also to three anonymous reviewers for constructive comments on an earlier draft of the manuscript.
Author Contributions
Conceived and designed the experiments: DG. Analyzed the data: DG. Wrote the first draft of the manuscript: DG. Contributed to the writing of the manuscript: DG. Agree with manuscript results and conclusions: DG. Jointly developed the structure and arguments for the paper: DG. Made critical revisions and approved final version: DG. All authors reviewed and approved of the final manuscript.
Funding
This work was made possible by funds from the University of Rochester and the a grant from the National Institutes of Health (R01OD010548).
Competing Interests
Author(s) disclose no potential conflicts of interest.
Disclosures and Ethics
As a requirement of publication the authors have provided signed confirmation of their compliance with ethical and legal obligations including but not limited to compliance with ICMJE authorship and competing interests guidelines, that the article is neither under consideration for publication nor published elsewhere, of their compliance with legal and ethical guidelines concerning human and animal research participants (if applicable), and that permission has been obtained for reproduction of any copyrighted material. This article was subject to blind, independent, expert peer review. The reviewers reported no competing interests.