
Abstract
A conductimetric enzyme biosensor for uric acid detection has been developed. The uricase, as enzyme, is isolated from
Introduction
Uric Acid is a final product in the catabolism processes of purin nucleotide in the human body. In human blood plasma, the reference range of uric acid is among 3.6 mg/dL and 8.3 mg/dL. Excess serum accumulation of uric acid can lead to a type of arthritis known as gout. Elevated serum uric acid (hyperuricemia) is a result from high intake of purine-rich foods, high fructose intake (regardless of fructose's low glycemic index (GI) value) or impaired excretion by the kidneys. Saturation levels of uric acid in blood may result in one form of kidney stones when the urate crystallizes in the kidney. Gout can occur where serum uric acid levels are as low as 6 mg/dL, but an individual can have the serum values as high as 9.6 mg/dL and not have gout. Because of that, the analysis of uric acid level is very important to control human health.1,2
The uric acid can be determined by the spectrophotometric method, the method used 2,4,6-tribromophenol and 4-aminoantipirin as reactants, and uricase is used as a biocatalyst. The absorbance is measured at 492 nm in the range concentrations of 10-20 mg/dL, so this method is not applicable to determine the uric acid in a normal human body. 3 The potentiometric uric acid biosensor has been developed.4,5 The biosensor is based on the oxidation of uric acid calatyzed by uricase to produce CO2. In water, CO2 can be hidrolyzed to form HCO3– and H3O+. In a previous work, we developed a potentiometric uric acid biosensor with uricase immobilized on a chitosan membrane. The limit of detection of that biosensor is 5 ppm and accuracy is more than 95%. However, the biosensor needs large sample volume. 5 In this work, we developed a coductimetric uric acid biosensor. Uricase is immobilized on a nata de coco membrane—Pt electrode, the biosensor has a simple design and is smaller than the potentiometric biosensor.
Conductometric biosensors were developed since 1961 to determine urea. The method was based on the electrical conductovity change. Formaldehyde, pesticides, insecticides and nitrate biosensors were also developed conductometrically. 6 The urea biosensor was improved by a platinum electrode as a matrix for urease immobilization. 7 This research was adapted from the principle of the conductometric urea biosensor.
A conductimetric biosensor measures small changes in conductivity of solution by using a conductimetric transducer, ie, a conductivity meter. Conductivity measurement is based on the biocatalytic reaction of the sample on an electrode. The reaction will produce ions which will result in the change of conductivity. 8 The conductimetric transducer, consists of two electrodes, a reference and a working electrode. Both electrodes are coated with a nata de coco membrane. The enzyme is immobilized on the working electrode but not on the reference electrode. During reaction, CO2 is produced on the working electrode, which is soluble in water to form HCO3– and H3O+. Moreover, on the reference electrode no reaction occurs, so the mobility of ions on the two electrodes is different and the conductivity is changed.
The matrix of enzyme immobilization commonly used, is cellulose acetate, polyacrylamide, gelatin and chitosan.9,10 Nata de coco is a fermentation product from coconut water by
Experimental
Materials and Reagents
Uric acid (analytical grade) was obtained from Merck. Stock solutions of uric acid (200 ppm) were prepared by dissolving the acid in a phosphate buffer, and stored at 4 °C. Low concentration standard solutions of uric acid (1-40 ppm) were freshly prepared from the stock solution before an experiment. Uricase (16 mg/mL) was isolated from
Apparatus
The conductivity-meter was fabricated by WTW, Germany (WTW LF91) and modified with an additional amplifier. A pair of electrodes was made from Pt wire (5 mm × 5 mm, Fig. 1).
The biosensor was designed from Pt-wire (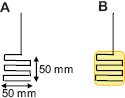
Procedure
Production of Nata de Coco
The coconut water was filtered and boiled. When the solution cooled down, sugar (100 grams/L coconut water), acetic acid (20 ml/L) until the pH is at 3-4, and
Preparation of the Biosensor 12
Platinum wire 5 × 5 mm (Fig. 1A) was coated by a nata de coco membrane. The Pt-wire is inserted between two layers of the membrane which is then fastened to each other. The electrode is dried at 50 °C for 30 minutes (Fig. 1B). For the uricase immobilization, 2 mL enzyme is used; the electrode is immersed in the enzyme solution for 24 hours at 5 °C. The enzyme is immobilized on the working electrode but not on the reference electrode.
Conductivity Measurement
Measurements were conducted at room temperature (25 °C) in a glass cell. The electrodes are fixed in place and are immersed in a phosphate buffer solution until stabilization occurs in the output signal, then the cell is used to measure standard solutions of uric acid. The solution is stirred during the measurement of the conductivity. Conductivities were corrected by the constant cell (K = 0.92 cm-1).
Results and Discussion
The Effect of Nata de Coco Membrane Thickness
The Pt-wire is coated by nata de coco membranes one, two and three times, resulting a 5, 10 and 15 μm dry membrane thickness. The membrane thickness is measured using a micrometer-screw. The conductivity is measured at pH 9, based on previous work result.
5
The optimum performance biosensor is resulted at a 10 μm of membrane thickness (Fig. 2).
Curve of relation of the uric acid concentration to conductivity for various membrane thickness of the biosensor.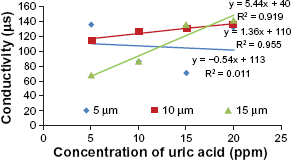
The sensitivity of the biosensor with a 10 μm thickness is smaller compared to the biosensor with a 15 μm thickness, but is opposite for the linearity. The performance of the biosensor depends on the amount of enzyme, and is affected by the size and number of membrane pores. The number of membrane pores increase proportionally with the thickness of the membrane. The immobilized uricase on the 10 μm thickness (28.68 mg) is greater than on the 15 μm thickness (25.10 mg). Hence the rate of diffusion of the ions (which is produced by oxidation of the uric acid) from membrane to the electrode surface is slower at 10 μm thickness than at 15 μm thickness. The research used the 10 μm membrane thickness for evaluation of the biosensor.
The Effect of pH Solution
In this research, the pH range used is 7.5 up to 9.5. There are two reasons. First, in previous works, the maximum immobilized uricase activities are at pH 8-9. Second, the number of HCO3– ions as an oxidation product of uric acid is present (>90%) at pH 7.5-9.5. Figure 3 illustrates that the conductivity is not significantly different for all concentrations of uric acid (1-10 ppm) at pH 8-9.5. At pH 7.5, conductivities show significant dynamic linear correlations with the uric acid concentrations at 1-3 ppm.
Curve of relation uric acid concentration to conductivity in various solution of pH.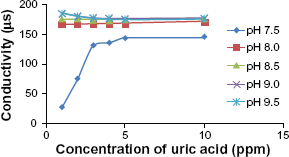
The nata de coco membrane is an acetic cellulose with a —OH function group. That may cause a cross-linking between the —OH and the —NH groups of the uricase. This influences side active conformations and change of the isoelectric pH protein in the uricase. We concluded the optimum pH of immobilized uricase on nata de coco (pH 7.5) is different than on chitosan (pH 9).
Characterization of Biosensor
Response Time
Response time is the time to allow the system to come to equilibrium, which is indicated by the signal stability.
13
Figure 4 illustrates the relation of measuring time and conductivity at several concentrations of uric acid. The conductivity decreases consistently for all concentrations. This phenomenon is caused by the amount of the uric acid loading on the membrane pores. Initially, the ions to arrive to the electrode surface are ions from the buffer solution (Na+, K+, OH–, HPO4=), so the conductivity is caused by these ions. The conductivity of the blank solution (phosphate buffer) averages at 250 μS, which is higher than the conductivity of the uric acid solution. The response time was determined from Figure 4, which is the starting time where the signal is constant; the response time for all concentrations is 3 minutes.
The relation of measuring time and conductivity at 1-6 ppm uric acid concentrations.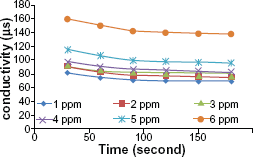
The response time depends on the uric acid concentration at 1-6 ppm. The minimum response time is obtained by the lowest of uric acid concentration. This indicates the dependence of oxidation rate of uric acid to the concentration. That means that uric acid concentration range is smaller than KM (22 ppm) and the oxidation rate is below maximum velocity (Vm).
Range of Uric Acid Concentrations
Figure 5 is a curve to determine the concentration range of uric acid. The curve shows two linear equations and the intercept shows the maximum concentration of uric acid which can be determined by the biosensor. The concentration range of uric acid is 1-6 ppm.
Determination of the concentration range of uric acid.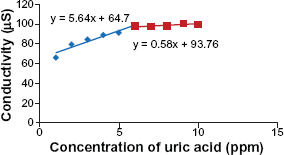
In the human serum, the range of uric acid concentration lies between 3.6 mg/dL (36 ppm) and 8.3 mg/dL (83 ppm). The biosensor is applicable to detect uric acid in human serum if the sample is diluted ten times.
The Biosensor Lifetime
Figure 6 is the relation of the uric acid concentration with conductivity using similar solutions in a five days period. The sensitivity and linearity of the curves are relatively stable at a three days period. However, the sensitivity and linearity decrease after three days. This phenomenon is caused by the release of immobilized enzyme from the nata de coco membrane.
Relation of uric acid concentration and conductivity in five days period.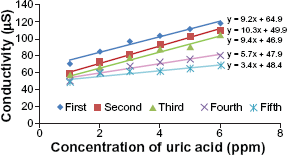
The performance of the biosensor can be improved by changing the enzyme immobilization method and adding a
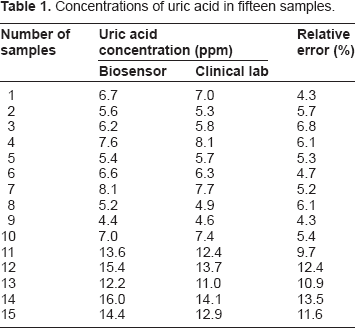
Biosensor Validation
Concentrations of uric acid in fifteen samples.
Conclusion
The conductimetric biosensor for uric acid detection can be made by uricase immobilized on a nata de coco membrane—Pt electrode. The maximum biosensor performances were resulted at 10 μm membrane thickness and pH 7.5. The response time is three minutes and range of concentration uric acid is 1 to 6 ppm. The biosensor has a lifetime of three days and a relative error below 10%, the sensitivity is 9 to 10 μS/ppm.
Footnotes
Acknowledgments
The authors acknowledge the financial support from Ministry of National Education, Indonesian government via Strategy National Research Project (No: 0174.0/023-04.2/XV/2009, December 31th 2008 and SK ReKtor No: 160/SK/2009, May 7th 2009).
This manuscript has been read and approved by all authors. This paper is unique and is not under consideration by any other publication and has not been published elsewhere. The authors and peer reviewers of this paper report no conflicts of interest. The authors confirm that they have permission to reproduce any copyrighted material.