
Abstract
Background
The aim of this study was to determine if there were centers in China with unusually high levels of risk-adjusted mortality in continuous ambulatory peritoneal dialysis (CAPD) patients.
Methods
We analyzed an inception cohort commencing CAPD between 1 January 2005 and 13 August 2015, followed until death, dropout defined as discontinuation of Baxter products, loss to follow-up, or 13 November 2015, whichever occurred first. We calculated standardized mortality ratios (SMRs) from Cox proportional hazards models, adjusting for age, gender, employment status, insurance status, primary renal disease, size of peritoneal dialysis (PD) program, and year of dialysis inception. We calculated 2 SMRs, 1 from models including a fixed effect for center of treatment, and 1 from stratified models.
Results
In this study, there was a 9.9% annual mortality rate in China, with decreasing mortality risk over time. There was significant variation of outcomes between Chinese centers, with up to 20% of facilities having SMRs indicating a higher risk-adjusted mortality rate than average. In particular, larger centers had better than expected mortality than smaller ones. There was significant misclassification of SMRs calculated using stratification versus fixed-effects models, although both showed directionally similar results.
Conclusion
Despite overall satisfactory and improving outcomes, our study showed a significant proportion of PD centers with higher than expected mortality. This is a signal for further assessment of these centers in China, after which there might be a range of actions taken depending on the results of the assessment and context, bearing in mind that the variation seen may be driven by factors unrelated to quality of care or beyond the control of hospital.
Keywords
Globally, the delivery of dialysis care has increasingly focused on improving outcomes through quality assurance programs, using center-specific clinical quality indicators, for either publication/dissemination or as criteria for value-based purchasing. In China, the provision of dialysis is largely through government payers. However, the audit of outcomes is usually only performed on a local level, using informal or ad hoc protocols. There are no large-scale or rigorous systems for comparing outcomes by center in China. This unmet need is well-recognized by stakeholders China—the recently initiated Chinese Renal Data System (CNRDS) registry is the tool of the future for this purpose, and its full functionality is keenly awaited (1).
In general, when national registries are unavailable, an audit of center outcomes against agreed standards can be done using insurance claims or regional data. In China, such claims data are not available and regional data systems do not yet have sufficient completeness and coverage for high-quality analyses. As a last resort, industry-derived data can be used to get an approximate landscape assessment, sourced from supply chain metrics, sales data, or through industry supported third-party providers of patient-facing training and support services. In this paper, we present the first large-scale comparison of center-specific outcomes for PD from China. These data allow a first look at the emerging landscape of center-specific PD outcomes in this country, and potential opportunities to implement systems to improve care.
Methods
Study Design
We performed an observational cohort study, using an “as treated” framework (“did exposure that the patient actually receive affect mortality?”) (5). Of note, all patients in this study were treated with continuous ambulatory PD (CAPD) using twin-bag 2-L Dianeal PD systems (Baxter International Inc, Deerfield, IL, USA). Also of note, 2.5- or 3-L PD systems and polyglucose PD fluid are not available from or sold by Baxter in China.
The study execution was subjected to the conditions of an established governance pathway developed by Baxter Healthcare (Asia) Pte Ltd that is provided in Appendix 1 (available as on-line supplementary material). This pathway is applied to epidemiological studies from the Asia-Pacific region if the studies contain substantial contribution and content from Baxter Healthcare. This process is described in detail elsewhere (6). As a result of the pathway, the study was reviewed and approved by an external ethics committee, the study data inspected and analyses replicated by The Arbor Research Collaborative for Health (www.arborresearch.org), and the interpretation of findings in the local healthcare context established by consensus at a face-to-face steering committee meeting of experts convened in collaboration with the leadership of the China Society of Nephrology.
Participants and Data Source
For this research, data were sourced from the Baxter Patient Support Program, in a manner that is broadly similar to some previous studies from other countries (7–10). In China, Baxter (China) Investment Co. Ltd funds support services to patients treated with its PD products, consistent with local regulations applicable to patient support programs and post-marketing research. The program itself is administered by a separate legal entity that provides patients with regular telephone support and contact, value-added supplies such as treatment log books, and material providing dietary and lifestyle information to supplement hospital education. Patients on Baxter products are enrolled with the Patient Support Program provider and given written and in-person notification that provides an “opt-out” option. After initial contact, there is collection of a limited amount of personal data from patients. The data include date of PD catheter insertion, date of and reason(s) for discontinuation of Baxter products, basic patient demographics, cause of end-stage kidney disease (ESKD), PD sub-modality and prescription, details of patient occupation and medical insurance, and center of care. The Patient Support Program provider holds these data in compliance with local regulations but makes de-identified datasets available to Baxter upon request.
We created a cohort of de-identified patients who initiated PD with Baxter products between 1 January 2005 and 13 August 2015 in China. We excluded patients if they had records of less than 90 days to exclude those who might be treated for acute kidney injury rather than for ESKD, received automated PD at any time, or were less than 1 year of age. We also excluded those with a recorded age of ≥ 95 years as likely ascertainment or recording error. The remainder were followed up until death, dropout from discontinuation of Baxter PD products, loss to follow-up for other reasons, or 13 November, 2015, whichever occurred first. Although not precisely known, our cohort is estimated to represent ∼70% of China's PD population.
Exposure Variables
The primary exposure was the dialysis center. In the source dataset, these data are collected from initial patient enrolment, and updated every 3 months upon follow-up between the Patient Support Program provider and patient. The dialysis center of record is therefore the dialysis center recorded at last patient follow-up. To ensure stability of estimation, centers with fewer than a total of 10 complete patient records were excluded.
We modeled the following patient-related factors: age, gender, primary kidney disease (diabetes, glomerulonephritis, hypertension, other/unknown), occupation (employed, student, unemployed, unknown), medical insurance (Medicare for migrant workers, New Rural Cooperative Medical Scheme/ System [NCMS], self-pay (assuming unknown to be self-pay), Urban Employee Basic Medical Insurance [UEBMI], Urban Resident Basic Medical Insurance [URBMI]), approximately equally-sized quartiles of PD program size (quartile 1: 1 - 131 patients; quartile 2: 133 - 310 patients; quartile 3: 312 - 521; quartile 4: 559 - 2,035), and approximately equally-sized tertiles of era of dialysis inception (2005 - 2009, 2010 - 2012, 2013 - 2015). Continuous covariates other than age were modeled as clinically relevant quantiles in order to avoid the assumption of linear relationships.
Outcome Variable
The primary outcome for the analysis was patient death. The recorded outcome of “withdrawal from dialysis” was included in models as death.
Statistical Methods
We calculated center-specific risk-adjusted standardized mortality ratios (SMRs) (11). These aim to compare the event rate at a given center to that which would be expected, given overall event rates for all other patients with similar characteristics. Any given SMR equals the actual number of patient events at that center divided by the expected number of events. Generally, the amount that a given center's SMR deviates from 1.00 reflects the degree to which the event rate surpasses (> 1.00) or improves upon (< 1.00) typical rates for centers with similar patient characteristics. For example, an SMR of 1.25 indicated a death rate exceeding typical (e.g. overall regional or national) death rates by 25%, on average (e.g. 25 deaths observed where 20 were expected, according to the center's patient case-mix). Similarly, a corresponding SMR of 0.75 would indicate that the center's death rates are 25% lower than expected.
We calculated expected mortality from a Cox proportional hazards model, adjusted for potentially confounding patient case-mix through the inclusion of patient-level variables as stated above. In the mortality analysis, we censored for switch to hemodialysis (HD), kidney transplantation, discontinuation of Baxter PD products, and loss to follow-up for unrecorded reasons, obtaining an estimate of the relative risk of death for each patient based on linear predictor. We initially included all available covariates, removing those with the highest p value from 2-tailed Wald tests of coefficients, using the partial likelihood ratio test to compare the new reduced model with the older larger one. We based final confounder selection upon both biological plausibility and contribution to the comprehensibility of the model, and also the significance of the covariate within the model as assessed by the 2-tailed partial likelihood ratio test, p value at a level of 0.2 when jointly adjusted for other covariates. We modeled primary renal disease, occupation, and type of medical insurance using deviation from means coding (12), since there is no particular rationale for the selection of one group over the other as a reference group.
We include an adjustment for center, which effectively accounts for confounding that might occur between center effects and the covariates, and avoids biases in estimating regression coefficients if there is important variation in covariate distribution across centers. We did this in 2 ways due to a lack of consensus on the best methodological approach for doing so. In the first case, we stratified regression by center (13,14). This approach allows the baseline hazards and trajectories to vary between centers. In the second case, we used fixed-effects for center. In this approach, all centers share the same underlying baseline hazard with the same trajectory over time, but may be shifted up or down for a particular center. We used both approaches due to the possibility of large differences in the baseline hazards between centers in China, and our uncertainty as to whether these would translate into large differences in SMRs.
We calculated errors using a bootstrap estimator, resampling with replacement from the original dataset. We used logarithms of the SMRs (log-SMRs), instead of SMRs, because of better coverage and the approximately normal distribution (15). When calculating variances of the log-SMRs, uncertainties in both the observed and expected numbers of events are accounted for. Our bootstrapping code did not take into account the fact that patients are clustered within facilities—we considered the option of resampling facilities rather than individuals (i.e. all observations within a cluster are sampled, but some clusters are sampled more than once), but the estimate of the variability of the SMRs was not felt to be useful. In addition, we estimated the correlation between patients in centers, and found this to be very small; the intraclass correlation coefficient using large 1-way analysis-of-variance was 0.03208 (95% confidence interval 0.02598 – 0.03818). As such, it seemed appropriate to use simple bootstrapping for our study.
Finally, we used funnel plots to display SMRs, placing thresholds controlling the false discovery rate at 5% and 2% on the plots (16–18).
Where necessary, we made comparisons between groups using the Fisher's exact test, and Mann-Whitney U (or Kruskal-Wallis) tests as appropriate. Where necessary, we assessed agreement between parameters using pairwise correlation and the concordance correlation coefficient (19,20). Analyses were performed using Stata Intercooled MP/14.1 (StataCorp LP, College Station, TX, USA).
Results
Participants
The cohort included 100,192 subjects with 23,838 deaths over 240,116 patient-years of follow-up. Figure 1 illustrates patient flow/disposition. There were 87,183 subjects from 1,134 centers with sufficient data for modeling, with 19,463 deaths and 12,003 who were transferred to HD or transplanted over 222,322 patient-years. Other causes of dropout from Baxter products included loss to follow-up in 5,888 patients, transfer to other brands of PD system in 4,835 patients, and other reasons in 3,023 patients. Table S1 summarizes the study cohort and excluded cohort due to missing data at dialysis inception (the point of commencement of dialysis). The excluded cohort comprised 13% of the potential study cohort, 12.8% pertaining to the number of CAPD exchanges per day missing, and 0.2% to other missing covariates. Subjects with missing data were more likely to be older, male, self-pay, with an unknown/ other cause of primary kidney disease, and from smaller PD programs. Differences between the included and excluded dataset were small or very small in terms of effect size and clinical significance.
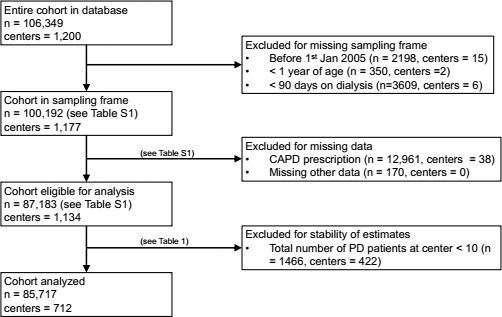
Disposition and flow of patients in the cohort. PD = peritoneal dialysis; CAPD = continuous ambulatory PD.
After excluding centers with fewer than 10 complete patient records, there were 85,717 subjects from 712 centers with sufficient data for modeling, with 19,146 deaths and 11,785 who were transferred to HD or transplanted over 219,371 patient-years. Table 1 compares characteristics of patients excluded in this manner to those that were included in the final cohort for analysis. On average, patients from excluded centers were generally more recent than included ones, more likely to be on less than 4 exchanges per day, to be self-paying, and of unknown employment. Differences between patients from the excluded centers and included centers were small or very small in terms of effect size and clinical significance.
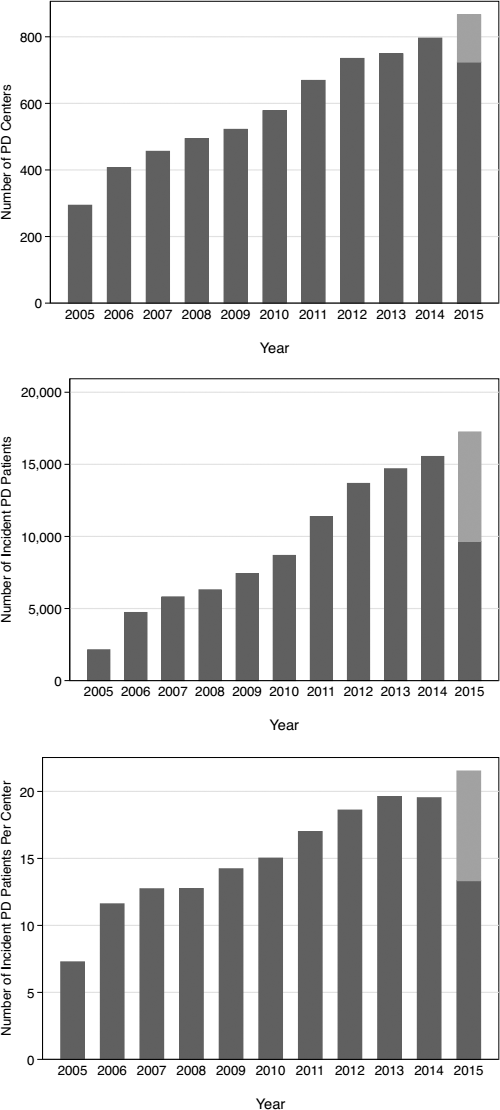
Clinical Characteristics of Patients at Dialysis Inception, by Number of Patients per Center
UEBMI = Urban Employee Basic Medical Insurance; URBMI = Urban Resident Basic Medical Insurance; NRCMS = New Rural Cooperative Medical Scheme/System.
Data are presented as n (%) or mean (standard deviation).
P<0.05.
Descriptive Data
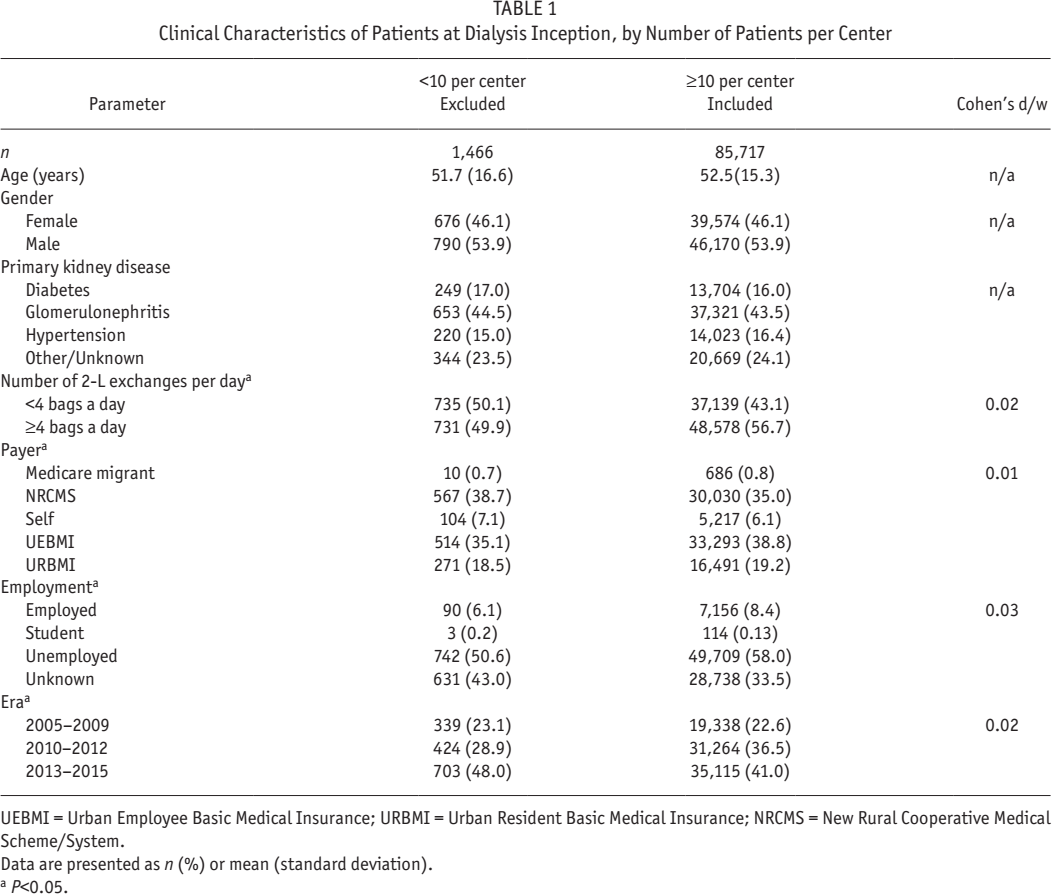
Figure 2 shows the number of PD centers, incident patients on PD, and number of PD patients per center in the final cohort for analysis.
Growth in number of incident PD centers (upper panel), incident PD patients (middle panel), and PD patients per center (lower panel) in the Baxter China Patient Support Program database. Given the sampling frame of the study, data collection in 2015 is incomplete. Estimates are forecasted to the end of year based upon the preceding time series (lighter bars). PD = peritoneal dialysis.
Supplementary Figure 1 illustrates actuarial probability of death. Supplementary Figure 2 shows main effects from the Cox proportional hazards models for mortality, fully adjusted for the patient-level covariates in Table 1 but unadjusted for any center apart from a robust standard error estimate to account for non-independence of observations. For mortality, this model demonstrates a statistically significant 57% decrease in risk in the most recent era compared with the oldest era, and a corresponding 21% decrease in risk in centers in the highest quartile of size compared with the lowest. The patient characteristics of older age, diabetic nephropathy, male gender, and unemployment/unknown employment were associated with higher mortality risk.
For the final Cox model including a fixed effect for center, we tested the proportional hazards assumption by the use of scaled Schoenfeld residuals, and visually by -ln (-ln[survival] versus ln[analysis time]) plots for modality, adjusted for confounders. No violations could be detected in the 50 largest centers. For this model, the associated Harrell's c is 0.7345, and Somers’ D = 0.4690. The Harrell's c is the probability that the survivor has the lower hazard ratio plus half the (possibly negligible) probability that the 2 subjects have equal hazard ratios: this sum is 73.45% on a percentage scale. The Somers’ D implies that when 1 of 2 subjects is observed to survive another, it is 46.90% more likely that the survivor has the lower of the 2 hazard ratios. Informally, these parameters can be interpreted as showing the amount of variation in the primary outcomes explained by the model. For the final Cox model stratifying for center, the associated Harrell's c is 0.7622, and Somers’ D = 0.5245.
Main Results
Figure 3 shows caterpillar plots of SMRs, and Figure 4 shows corresponding funnel plots. Figure 5 shows greater detail for those centers with less than 100 risk-adjusted deaths, by excluding the 48 largest centers in the cohort. Of note, Figure 3 is just descriptive, and no statistical inference can be made from inspecting it. Figures 4 and 5, however, fulfil the definition of being statistical control charts and can be inspected to detect signals of centers that have a higher than expected mortality rate.
Caterpillar plots of SMR for mortality using fixed-effects Cox proportional hazards modeling (upper panel) and corresponding stratified modeling (lower panel). SMR = standardized rate ratios.
In viewing Figures 4 and 5, the SMRs for all hospitals (y-axis) are plotted against the expected numbers of patient deaths (x-axis). The horizontal line at 1 on the y-axis indicates an SMR of 1.0, and the contours indicate 95% and 99% confidence intervals (the contours approximately correspond to ± 2 and 3 standard deviations from 1.0, respectively). If a hospital lies within the confidence intervals, then that hospital has an observed:expected ratio that is statistically consistent (at the 5% level) with 1.0 (i.e. there is no statistical difference in the number of observed and expected events). If a hospital lies above the upper control lines, this indicates that the number of observed deaths is statistically greater than the number expected under the model. Conversely, if a hospital lies below the lines, this indicates statistically fewer observed deaths than expected under the model.
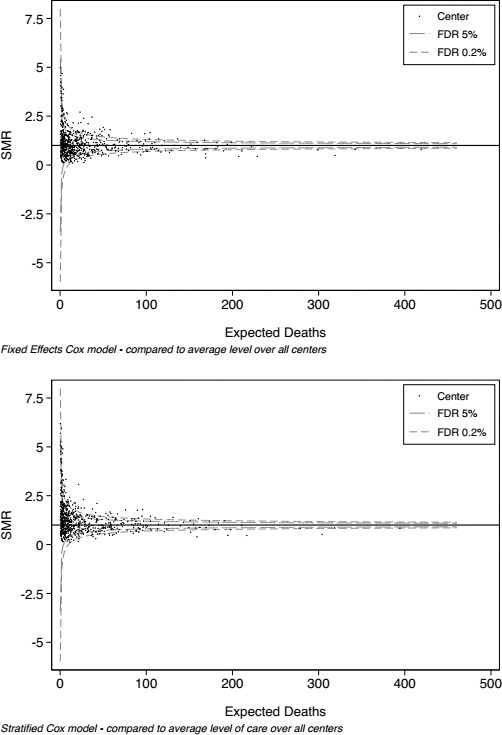
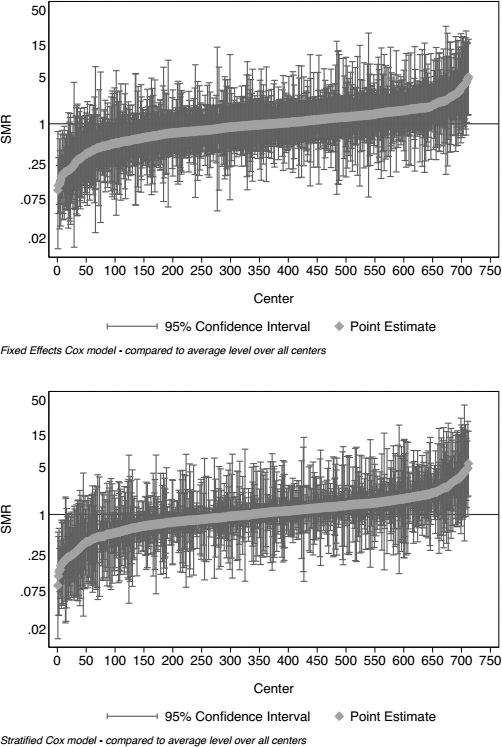
Funnel plots of SMR for mortality using fixed-effects Cox proportional hazards modeling (upper panel) and corresponding stratified modeling (lower panel). Each center is represented by a dot, and statistical control processes are indicated by the contours representing a FDR of 5% (long dash) and 0.2% (short dash). SMR = standardized rate ratios; FDR = false discovery rate.
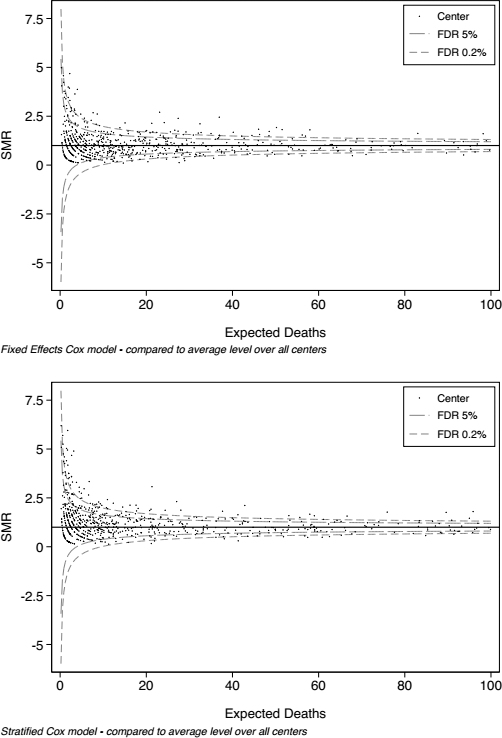
Funnel plots of SMR for mortality using fixed-effects Cox proportional hazards modeling (upper panel) and corresponding stratified modeling (lower panel). The largest 48 centers in the database are excluded, and only those with less than 100 expected risk-adjusted deaths are illustrated. Each center is represented by a dot, and statistical control processes are indicated by the contours representing a FDR of 5% (long dash) and 0.2% (short dash). SMR = standardized rate ratios; FDR = false discovery rate.
Overall, the descriptive and statistical control charts show that there is wide variation in observed versus expected mortality between centers in our dataset. Those centers with a larger number of expected deaths (i.e. bigger centers) had less deaths than expected, after adjustment for the factors in Table 1. For instance, from Figure 4 it can be seen that no center with over 175 expected risk-adjusted deaths had a higher SMR than average.
Other Results
A linear comparison between the 2 methods of calculating SMR indicated some congruity, with a concordance correlation coefficient of 0.95 (0.95 – 0.96), and an average difference of 0.1 (-0.1 – 0.3). However, this result perhaps over-represents the agreement between the methods in terms of classification of centers according to their observed versus expected mortality. Table 2 identifies the proportion of centers being identified as having mortality rates that are higher than expected, comparing again fixed effects and stratified models. The fixed effects model determined higher than expected mortality in 22.3% of centers at the usual false discovery rate (FDR) of 5%, and the stratified model in 16.1% of centers.
Differences in Classification Between SMR-Based Categorization for Mortality Using Fixed Effects vs Stratified Models
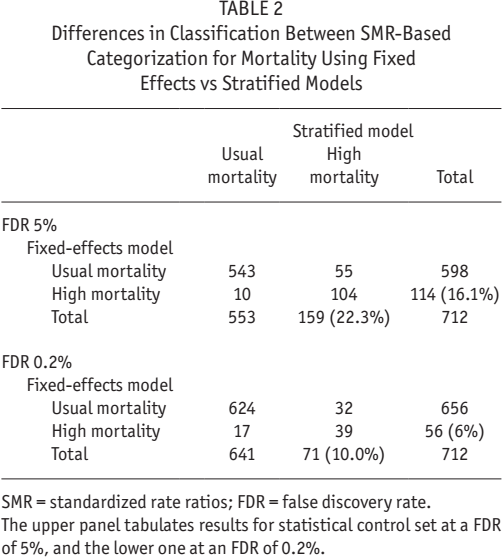
SMR = standardized rate ratios; FDR = false discovery rate.
The upper panel tabulates results for statistical control set at a FDR of 5%, and the lower one at an FDR of 0.2%.
Discussion
Our study indicates high variability in center-standardized mortality on PD in China, and up to 20% of facilities having modeled mortality rates that are higher than the average for cohort. This degree of variation is higher than is reported in national registries from developed nations, such as the Australia and New Zealand Dialysis and Transplant Registry (ANZDATA), where only 1% – 2% of centers have mortality rates that are higher than average (www.anzdata.org.au/v1/dialysis_hospitalreport.html). It is similar, however, to that reported from other developing nations, such as Malaysia (21). Of note, the overall pattern of mortality in the cohort was comparable to the international landscape, with a 9.9% annual rate that (like elsewhere) is improving over time (22 23 24 25 26 27-28).
There are important limitations of this study in terms of data, methodology, and interpretation of results. In terms of data, we do not include important recognized risk factors for mortality, such as details of clinical comorbidity, biochemical, socioeconomic, medication, and health services data. We were, however, able to include and adjust for a range of important predictors. As with the companion articles published along with this one (4,6), insurance status and occupation were powerful predictors of outcome (29 30 31-32), as well as size of PD program, which is recognized as a general indicator of program infrastructure and expertise (33 34 35-36). The main methodological limitation in our study pertains to the assumption of no residual confounding. Our model, however, shows typical explained-variation of around 70%, which is comparable to similar cohort studies to ours and indicative of a similar degree of residual confounding.
The largest interpretive limitation concerns the SMR itself, and the interpretation of point estimates as being true values, subject to random variation. For example, 95% confidence intervals illustrated in the funnel plots indicate a range that is expected to contain the value of the estimate in an infinitely large dataset 19 times out of 20. By definition, therefore, 1 in every 20 results will lie outside of 95% confidence intervals, but be a false discovery due to chance alone. In addition, SMRs calculated by fixed effects or stratified models adjusted using different and non-comparable covariate and censoring distributions become important if, for instance, transplantation rates differ markedly between centers (37).
It is critical to recognize that the SMR is simply an indexing of outcomes to a population average, which in itself represents the most common outcome rather than an ideal one. There are no agreed or specific “official” thresholds that define any SMR as being acceptable or unacceptable. An SMR should only be used to identify facilities that are statistical outliers, after which there should be further clinical assessments. Various actions may follow as appropriate, including quality assurance initiatives, external review, funding changes, or even doing nothing: outcomes at a given center may be driven by factors completely unrelated to the quality of care or beyond the control of individual hospitals (e.g. source population factors, natural disasters, etc.) (38,39).
With all these caveats, what are the causes of the center variation in our study? In China, larger centers tend to be those in sophisticated urban hospitals in major cities, with state-of-the-art infrastructure, multidisciplinary care teams, and up-to-date care protocols and standard operating procedures. In contrast, smaller centers tend to be those in rural or second-tier cites, where care is often delivered by non-specialist staff, in settings which are generally poorly equipped for specialized PD care. A critical point of difference is continuous quality improvement, which is always a feature of larger centers but may or may not exist in smaller ones. Standardized and structured education programs for the training of both doctors and nurses are not available in every center and province, and also tend to be a feature of larger centers.
The plight of smaller PD centers is well recognized in China. Often, they are linked with a designated larger “parent” PD center for oversight. In some situations, this oversight is formal, and the smaller center becomes a “satellite” of the parent center, sharing standardized treatment and follow-up procedures (40). In other situations, the oversight may be looser, with clinical support available when requested, or routine follow-up clinic appointments for all patients at the parent center once or twice a year.
Further research is needed to confirm specific factors responsible for the center effects identified in this study. In China, a given patient's insurance status reflects a combination of their personal socioeconomic status plus care setting. For example, New Rural Cooperative Medical Scheme/System (NRCMS) is farmers’ insurance, and patients with this insurance are usually relatively poor and receiving treatment in a smaller center. To further investigate center effects in China, we have begun to categorize each center in our study by rurality, level and province, to look at the effect of these characteristics on patient outcomes. Hopefully, we can in this way identify opportunities for improved health service delivery.
Conclusion
Our study has several strengths. The sample size is large, with rigorous modeling that includes several novel predictors (e.g. insurance, employment) that led to better overall model discrimination. On the negative side, our models compare average mortality rates over a long period, which means we do not identify change in SMR over time, which would be useful information when considering SMRs in the “real world setting.” Finally, as with all databases, there is a risk of ascertainment error—the Patient Support Program provider obtains data from patients, and these data have not been subjected to an audit of quality control against clinical or government source documents.
Our study is a call to action for routine regulatory monitoring of outcomes on PD in China and further research on processes of care to determine if “quality” of dialysis care is the source of variation between centers (41). This should be undertaken at a national level, with a standard method of calculation, and an agreed reference perspective—different methods for calculating SMRs have been shown to produce markedly different results (39,42). Such measures are an important next step for better improvement outcomes on PD in China.
Footnotes
Acknowledgments
We would like to thank Dr. Jarcy Zee for her expertise and patience in providing an analytical review of our models and data, and the Arbor Research Collaborative for Health for their support of this initiative.
MRM, QY, and JS are fully employed by Baxter Healthcare. The other authors have no financial conflicts of interest to declare.