
Abstract
Spinal cord injury (SCI) is a significant clinical challenge, and to date no effective treatment is available. Oligodendrocyte progenitor cell (OPC) transplantation has been a promising strategy for SCI repair. However, the poor posttransplantation survival and deficiency in differentiation into myelinating oligodendrocytes (OLs) are two major challenges that limit the use of OPCs as donor cells. Here we report the generation of an OL lineage population [i.e., pro-oligodendroblasts (proOLs)] that is relatively more mature than OPCs for transplantation after SCI. We found that proOLs responded to lipopolysaccharide (LPS)-stimulated microglia conditioned medium (L+M) by preserving toll-like receptor 4 (TLR4) expression, improving cell viability, and enhancing the expression of a myelinating OL marker myelin basic protein (MBP), compared to other OL lineage cells exposed to either LPS-stimulated (L+M) or nonstimulated microglia conditioned medium (L-M). When L+M-stimulated proOLs were intrathecally delivered through a lumbar puncture after a T10 thoracic contusive SCI, they promoted behavioral recovery, as assessed by the Basso–Beattie–Bresnahan (BBB) locomotor rating scale, stride length, and slips on the grid tests. Histologically, transplantation of L+M proOLs caused a considerable increase in intralesional axon numbers and myelination, and less accumulation of invading macrophages when compared with the vehicle control or OPC transplantation. Thus, transplantation of proOLs, preconditioned by L+M, may offer a better therapeutic potential for SCI than OPCs since the former may have initiated the differentiation process toward OLs prior to transplantation.
Keywords
Introduction
Myelin sheaths play an important role in maintaining and protecting axons, providing trophic support to myelinated axons, and maintaining electrical impulse conduction in the central nervous system (CNS)1,2. Oligodendrocytes (OLs) are the cell type responsible for CNS myelin pro duction1,2. Primary demyelination in the CNS can be caused by genetic abnormalities, such as leukodystrophies 3 ; by inflammatory damage and neurodegeneration, such as multiple sclerosis4,5, autoimmune encephalomyelitis 6 , and periventricular leukomalacia 7 ; and by CNS trauma, such as spinal cord injury (SCI)8–10.
After SCI, OL cell death occurs at the site of injury and beyond8–11. Surviving OLs are postmitotic and cannot remyelinate axons 12 . To replace OL loss after SCI, a promising strategy is to promote generation of new OLs through oligodendrogenesis. Indeed, progenitor cells are found throughout the CNS, and they give rise to myelinating OLs during development and in adulthood 13 . After SCI, these progenitor cells proliferate robustly14–17 and differentiate into OLs particularly along the lesion border15,17–19. Importantly, oligodendrogenesis and remyelination can be found not only acutely but also chronically after SCI 20 . An alternative approach to replace the loss of OLs is to transplant OLs or their progenitors (OPCs) exogenously after SCI. Indeed, OPC transplantation has been a promising strategy for SCI repair; however, poor posttransplantation survival and deficiency in differentiation into myelinating OLs are two major challenges 21 . Thus, identification of OL lineage cells that survive better than OPCs may offer promise in SCI repair. Eventually, the endogenous and exogenous OL repair strategies may be combined to promote a more complete recovery after SCI.
In the CNS, OL development can be divided into four distinct stages according to the temporal expression of cell surface markers and morphology: undifferentiated OL progenitor cell (OPC; stage 1 or early OPC), pro-oligodendroblast (proOL; stage 2 or late OPC), differentiated preOL (preOL; stage 3 or immature OL), and mature OL (OL; stage 4)22,23. To initiate effective remyelination, precursor cells must switch from an essentially quiescent state to a regenerative phenotype 1 . This transition seems to be triggered by factors derived from reactive microglia1,24.
Microglia dominate sites of CNS injury where they promote both injury and repair 25 . Lipopolysaccharide (LPS; or endotoxin) stimulation has been widely used for microglial activation26,27. Following CNS injury, depletion or inhibition of reactive microglia consistently confers neuroprotection and promotes functional recovery28,29. Paradoxically, the controlled activation or even augmentation of this response can enhance various indices of CNS repair (e.g., axon growth/sprouting, remyelination and delaying demyelination, promoting OPC proliferation 30 ) or enhance preOL survival 31 . These controversial observations illustrate that microglial activation is not an all-or-none process but can vary depending on the stimulation context. Microglial responses to pathologic events are context dependent and adapt as the microenvironment changes. OL lineage cells at different developmental stages may respond differently to LPS-activated microglia stimulation and may undergo different fates, both in vivo32–35 and in vitro30,36.
In the present study, we sought to determine the responses of stage-specific OL lineage cells to toll-like receptor 4 (TLR4)-specific LPS-activated microglia stimulation in vitro. We also determined whether intrathecal delivery of a selected population of these stimulated OL lineage cells (i.e., proOLs), after a contusive SCI, would be a better lineage than OPCs in promoting recovery.
Materials and Methods
Animals and Reagents
All animals, including 35 adult male Wistar rats (weight: 230–250 g, age: 8 weeks) and 28 male neonatal Wistar rats were purchased from the animal center of the Academy of Military Medical Sciences of the Chinese PLA, P.R. China (AMMS). All animal care and surgical interventions were undertaken in strict accordance with the Public Health Service policies on humane care and the use of laboratory animals and with the approval of the institutional animal care and use committee (IACUC) and Institutional Biosafety Committee of the protocol (protocol No. 20100481475). Unless otherwise stated, all other chemicals used in this study were purchased from Sigma-Aldrich (St. Louis, MO, USA).
Isolation of Microglia and Preparation of LPS-Stimulated Microglia Conditioned Medium
Primary mixed glial cells were prepared from neonatal rat neural progenitor cells (NPCs) by a shaking procedure according to the method of Chen et al. with some modifications 37 . In brief, cerebral hemispheres were stripped free of meninges. After a digestion step, the cells were plated into cell culture flasks, and mixed cultures were grown in Dulbecco's modified Eagle's medium (DMEM) 20S [DMEM, 4 mM L-glutamine, 1 mM sodium pyruvate, 20% fetal bovine serum (FBS), 50 U/ml penicillin, and 50 mg/ml streptomycin] at 37°C in 5% CO2 for 7 days with the medium changed every other day (Fig. 1A). Twelve hours after the last medium change, microglia were isolated by shaking the mixed glia-containing flasks for 2 h at 180 rpm. The microglia (purity >95%) were cultured in microglial culture medium [DMEM with 10% bovine serum albumin (BSA)] for 5 days (Fig. 1A).

Schematic drawing of the experimental design and timeline. (A) In vitro isolation of microglia and oligodendrocyte (OL) lineage cells and treatments. (B) Summary of morphology and antigenic profile of different stages of OL lineage cells. (C) In vivo experimental design and timeline. Abbreviations: OPC, oligodendrocyte progenitor cell; proOL, pro-oligodendroblast; preOL, preoligodendrocyte; A2B5, mouse monoclonal antibody to A2B5; PDGFαR, alpha receptor for platelet-derived growth factor; NG2, neural/glial antigen 2; O4, oligodendrocyte marker O4; GalC, galactocerebroside; MBP, myelin basic protein; MG, microglia; L-M, microglial conditioned medium that received no lipopolysaccharide (LPS) stimulation; L+M, lipopolysaccharide (LPS)-stimulated microglial conditioned medium; RS, Rhodobacter sphaeroides, an LPS inhibitor administered simultaneously with LPS; PM, proliferation medium; DM, differentiation medium; BBB, Basso–Beattie–Bresnahan locomotor rating scale; PCR, polymerase chain reaction; wk, week.
For preparing LPS-stimulated microglia conditioned medium, the microglial culture medium was removed and replaced with microglial conditioned medium (containing 0.5% BSA) stimulated or not stimulated with TLR4-specific LPS, abbreviated as L+M and L-M, respectively. LPS was derived from E. coli O111:B4 (Lot: tlrl-3pelps, solubility: 5 × 10 6 EU/ml in water) with a working concentration of 10 1 –10 4 EU/ml (Biocompare, San Francisco, CA, USA). LPS was added at two concentrations: 0.1 and 1.0 mg/ml. For the TLR4 inhibition group, a potent antagonist of LPS, Rhodobacter sphaeroides (RS; 50 nmol/L; Invitrogen, San Diego, CA, USA), was added to the microglia culture along with LPS (LPS-RS). Twenty-four hours later, the conditioned media were collected and filtered with a 0.45-mm filter and stored at −80°C until use. They were applied to OL lineage cell cultures with a 1:3 ratio at defined stages of development (Fig. 1A).
Isolation of OPCs
After removing microglia from mixed glial cell culture, the flasks were subjected to shaking at 200 rpm for 22 h to separate OPCs from the astrocyte layer. The suspension was plated onto uncoated petri dishes for 2 × 2 h to further remove residual contaminating microglia/astrocytes by differential adhesion, and then the cells were seeded onto 200 mg/ml poly-L-lysine-coated coverslips at a density of 3 × 10 4 cells/coverslip and were allowed to proliferate for 2 days in proliferation medium (PM) that contains basal chemically defined medium [BDM; DMEM, 4 mM L-glutamine, 1 mM sodium pyruvate, 0.1% BSA, 50 mg/ml Apo-transferrin, 5 mg/ml insulin, 30 nM sodium selenite, 10 nM D-biotin, and 10 nM hydrocortisone, supplemented with 10 ng/ml platelet-derived growth factor AA (PDGF-AA) and 10 ng/ml basic fibroblast growth factor (bFGF)]. Under the PM, OPCs proliferated and maintained their OPC status (Fig. 1A).
Preparation of Stage-Specific OL Lineage Cells
OPCs were the earliest stage of the OL lineage cells prepared in this study. They were maintained in the PM and were used directly (Fig. 1A). Under the differentiating medium [DM; containing BDM supplemented with 15 nM triiodothyronine and 10 ng/ml ciliary neurotrophic factor (CNTF), and 1× N-acetyl-cysteine (NAC)], OPCs were differentiated into proOLs (2–18 h), preOLs (36–72 h), and OLs (10 days) (Fig. 1A). OL lineage cells at different development stages (purity >90) showed different morphologies and expressed a combination of stage-specific markers (Fig. 1B).
LPS-Activated Microglia Stimulation of Stage-Specific OL Lineage Cells
To determine the effect of LPS-activated microglia stimulation on OL lineage cell survival, proliferation, and differentiation, stimulated or L+M (LPS: 0.1 or 1.0 mg/ml), nonstimulated or L-M, LPS + RS (LPS 0.1 mg/ml + RS 50 nmol/l), or basal (BS) control medium (PM or DM) was added to cultures of four different stages of OL lineage cells for 4 h (OPC and proOL) or 24 h (preOL and OL) (Fig. 1A). OPCs and proOLs stimulated with L+M and L-M (>90 purity) were collected for in vivo transplantation studies.
Cell Viability Assessments
Short-term viability (<72 h) was determined by try-pan blue exclusion staining and live/dead assay according to the manufacturer's instructions (Life Technologies, Grand Island, NY, USA). Live cells were expressed as a percentage of the cells under basal untreated conditions, and dead cells were expressed as a percentage of the dead cells over total cells per field.
Cell survival/death rate in long-term cultures (>72 h) was determined by counting the number of pyknotic nuclei and intact nuclei stained with 4′,6-diamidino-2-phenylindole (DAPI), and the rate is calculated as the number of intact nuclei divided by the number of total nuclei (intact + pyknotic).
Cell viability was also examined using 3-(4,5-dimethylthiazol-2-yl)-2,5-diphenyltetrazolium bromide (MTT) reduction assay following the manufacturer's instructions 38 . Percent viability was calculated by comparing the experimental groups with the control group. Relative cell viability was determined by the amount of MTT converted into formazan crystals and quantified as a percentage of control.
ELISA
The concentrations of tumor necrosis factor-α (TNF-α) and interleukin-6 (IL-6) in the culture media of cells treated as specified were measured using commercially available enzyme-linked immunosorbent assay (ELISA) kits according to the manufacturer's instructions. Absorption at 450 nm was determined in a microplate reader (Tecan Group Ltd., Männedorf, Switzerland).
BrdU Labeling and Immunofluorescence Staining
Bromodeoxyuridine (BrdU) was added to cells at different time points and pulsed for 1 to 2 h to quantify cellular proliferation. The BrdU-treated cells were fixed and acid treated, followed by immunostaining analysis with BrdU-specific antibody. We performed immunostaining using antibodies for BrdU (1:100; Roche, Indianapolis, IN, USA), Ki-67 (1:400; Abcam, Cambridge, MA, USA), A2B5 (1:100; Millipore, Billerica, MA, USA), platelet-derived growth factor α receptor (PDGFαR; Chemicon, Darmstadt, Germany), nuclear Olig4 (O4; 1:100; Millipore), galactocerebroside (GalC; 1:100; Millipore), and myelin basic protein (MBP; 1:250). In all cases, negative controls were treated in the same way, but the primary antibody was omitted in each instance, confirming that staining was specific. Cells demonstrating doublepositive fluorescence were evaluated by counting five randomly selected high-power fields (×200) for each coverglass by two independent investigators under an inverted fluorescence microscope (OLYMPUS FV1200; Olympus America Inc., Center Valley, PA).
SCI Model and Cell Transplantation
We first determined functional efficacy of transplanted proOLs in three conditions: treated with LPS-stimulated microglia conditioned medium (L+M proOL; 1 mg/ml), microglia conditioned medium with no LPS stimulation (L-M proOL), or naive medium (naive proOL). In this experiment, adult male Wistar rats (weight: 230–250 g) aged 8 weeks were randomly divided into five groups (n = 3/group): (1) laminectomy/sham control, (2) SCI + vehicle [artificial cerebrospinal fluid (ACSF)], (3) SCI + L+M proOL, (4) SCI + L-M proOL, and (5) SCI + naive proOL. For cell preparation, the cell suspension was centrifuged at 200 × g for 6 min at 4°C. After the supernatant was removed, cells were resuspended at a final concentration of 5–10 × 10 6 cells/ml with ACSF. The cells were kept in a 0.5-ml microcentrifuge tube on ice until being used for transplantation.
For SCI, rats were anesthetized with sodium pentobarbital [50 mg/kg, intraperitoneal (IP) injection] and subjected to a dorsal laminectomy at the 10th thoracic spinal level (T10) to expose the dorsal surface of the spinal cord 39 . Using an NYU spinal cord impactor, a 10-gauge rod was dropped from a vertical distance of 12.5 mm onto the exposed spinal cord. After the injury, muscles and subcutaneous tissues were sutured in layers, and the skin was stapled. Figure 1C illustrates the timeline and procedures of in vivo experiments.
For cell transplantation, 0.5 × 10 6 OPCs or stimulated proOLs, diluted in 40 ml of the ACSF, were injected intrathecally (IT) via lumbar puncture (L5/L6) at 4 h postinjury (PI). Control animals received laminectomy alone or SCI + vehicle injection. Animals received manual bladder expression twice daily and were inspected for weight loss, dehydration, and distress with appropriate veterinary care as needed.
In the second in vivo experiment, we tested the efficacy of transplanted L+M proOLs, chosen from the first experiment, in their ability to promote histological and behavior recoveries. The transplantation of L+M proOLs was compared with that of OPCs, a well-accepted cell population that shows promise as donor cells for repair after SCI. In this experiment, adult male Wistar rats (weight: 230–250 g) aged 8 weeks were randomly divided into four groups (n = 5/group): (1) laminectomy/sham control, (2) SCI + vehicle (ACSF), (3) SCI + L+M proOL, and (4) SCI + OPC. All cell preparation, SCI, and transplantation procedures followed those described in the first experiment.
Behavior Assessments
Open-field locomotion was evaluated by using the 21-point Basso–Beattie–Bresnahan (BBB) locomotor rating scale 40 . Deficits in descending motor control were examined by the grid-walking test, which is a sensitive measure of the ability of animals to step rhythmically and coordinate accurate placement of limbs. Footprint analysis was performed at different time points using a procedure described previously 41 . Latency of withdrawal response to paw thermal stimulation was observed to evaluate thermal hyperalgesia.
Morphometric Analysis
Rats were euthanized and perfused with 4% buffered formalin, and spinal cords were extracted. Then T10 segments encompassing the lesion epicenter (about 3 mm) were fixed in 2% glutaraldehyde and 4% paraform-aldehyde (PFA) for 2 h, osmicated for 3 h (1% OsO4), dehydrated, and embedded in plastic for toluidine blue staining according to standard procedures 42 . Semithin cross sections (1 mm) were made according to our existing protocol 39 . Every eighth section was collected and stained with toluidine blue for myelin and general morphology. The G ratio and myelin thickness were measured in representative slides (five sections at the injury epicenter, 100 mm apart) by a neuropathologist who was blinded to the treatment groups. The axon diameter (measured to the inner border of myelin), G ratio (defined as the ratio of the axon diameter to the total diameter of the myelinated fiber), and myelin thickness (defined as total diameter of the myelinated fiber minus the axon diameter) were quantified according to previously described methods43,44 from randomly chosen fields (four fields per animal, 20 × 30 mm/field at 100× magnification) within the lesion area from each animal and statistically compared between groups using one-way analysis of variance (ANOVA) followed by Dunnett's T3 post hoc test.
Reverse Transcription Polymerase Chain Reaction (PCR)
Total RNA was isolated with an RNeasy Mini kit (Qiagen, Valencia, CA, USA) and reverse transcribed using avian myeloblastosis virus (AMV) reverse transcriptase. Generated cDNA was amplified by PCR with specific primers for TLR4 (5′-TAC AGA AGC TGG TGG CTG TG-3′, 5′-CCA GAA CCA AAC GAT GGA CT-3′) and glyceraldehyde 3-phosphate dehydrogenase (GAPDH) (5′-CCA CCC ATG GCA AAT TCC ATG GCA-3′, 5′-TCT AGA CGG CAG GTC AGG TCC-3′). After 32 amplification cycles, PCR products were analyzed on 1.5% agarose gels, stained with ethidium bromide, and subsequently visualized under UV light. To confirm the use of equal amounts of RNA in each experiment, all samples were checked for GAPDH mRNA expression.
Statistical Analysis
All data were presented as mean ± standard error of the mean (SEM) and were tested for homogeneity of variances. Differences within and between groups were analyzed using a two-way ANOVA followed by Fisher's LSD post hoc test for repeated measurements with group and time as factors. Time-independent variables were compared with one-way ANOVA followed by post hoc Dunnett's T3 or Bonferroni's multiple comparison posttest. Statistical analyses were performed using GraphPad Prism version 4 (Graph-Pad Software, San Diego, CA, USA). Differences were considered to be statistically significant with a value of p < 0.05.
Results
TLR4-Specific LPS Induces Microglial Activation
A classical tool used to activate microglial cells is LPS stimulation25,26. Within 24 h of LPS exposure, microglial cells were activated and released a number of proinflammatory substances including TNF-α and IL-6. In this study, LPS stimulation resulted in TNF-α (Fig. 2A) and IL-6 (Fig. 2B) release from activated microglia in a time-dependent manner as tested by ELISA. TNF-α abundance peaked at 12 h after LPS exposure and remained significantly high at 48 h. A significant increase in IL-6 release was observed at 12 h and peaked at 48 h (Fig. 2B). A very low level of TNF-α or IL-6 was detected in baseline control medium (BS) at all the time points that were examined (Fig. 2A and B). When RS, a TLR4 antagonist, was added to the microglia culture with LPS, it completely blocked LPS-induced microglial production of TNF-α (Fig. 2A) and IL-6 (Fig. 2B) at these time points. No significant difference in TNF-α or IL-6 expression was observed between the two concentrations of LPS (0.1 or 1.0 mg/ml) administered. Microglial activation was also confirmed by PCR analysis of TLR4 expression (Fig. 2C). After exposure to LPS, LPS-specific TLR4 mRNA expression was significantly increased at 12 h after LPS stimulation, peaked at 24 h, and remained at a significantly high level at 48 h. No difference in TLR4 expression was observed between the two concentrations of LPS (Fig. 2C).
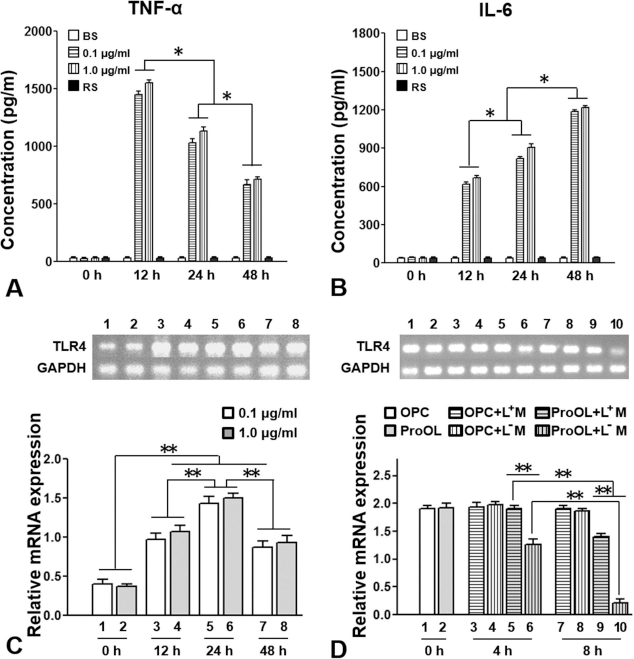
LPS stimulation induced microglial response and TLR4 expression in OL lineage cells. Increased production of tumor necrosis factor-α (TNF-α) (A) and interleukin-6 (IL-6) (B) in microglial medium stimulated with two concentrations of lipopolysaccharide (LPS) (0.1 and 1.0 mg/ml). ∗p < 0.05. (C) Increased microglial toll-like receptor 4 (TLR4) expression was found in a time-dependent manner after LPS stimulation. Results are reported as the mean ± standard error of the mean (SEM) of three independent wells for each experimental condition. ∗∗p < 0.01. (D) Primary cultures of oligodendrocyte progenitor cells (OPCs) and pro-oligodendroblasts (proOLs) were either untreated or exposed to microglial conditioned medium treated with LPS (0.1 mg/ml, L+M) or without LPS (L-M) for up to 8 h followed by polymerase chain reaction (PCR) analysis. Extraction of total RNAs from cells pooled from three samples per group was prepared for the PCR study. Results are reported as mean ± SEM of three independent wells for each experimental condition. ∗∗p < 0.01. Abbreviations: BS, basal microglial medium; RS, Rhodobacter sphaeroides; LPS-RS (50 nmol/L, added to the 0.1 mg/ml LPS-stimulated microglial medium); OL, oligodendrocyte; preOL, preoligodendrocyte; L-M, microglial conditioned medium that received no LPS stimulation; L+M, lipopolysaccharide (LPS)-stimulated microglial conditioned medium; GADPH, glyceraldehyde 3-phosphate dehydrogenase; h, hour.
TLR4 mRNA Is Divergently Expressed in OL Lineage Cells in Response to Activated Microglia Stimulation
In contrast to microglia, direct stimulation of OL lineage cells with LPS did not induce the release of cytokines TNF-α and IL-6 (ELISA analysis, up to 48 h, data not shown). We then tested TLR4 mRNA expression in 2 OL lineage cell types, OPC and proOL, when they were either untreated or exposed to microglia conditioned medium treated without (L-M) or with LPS (L+M, 0.1 mg/ml) (Fig. 2D). Naturally, only undifferentiated OL lineage cells, such as OPCs and proOLs, but not differentiated OLs, express TLR4 31 . Addition of L-M or L+M to OPCs showed no difference between treatment groups, and between treatment groups and the baseline OPCs (Fig. 2D). In contrast, when exposed to L-M, proOLs showed a decrease in TLR4 expression in a time-dependent manner (Fig. 2D, lanes 6 and 10). Such a TLR4 decrease in proOLs could be significantly reversed by administrating L+M at both 4 and 8 h (Fig. 2D, lanes 5 and 9). These results indicate that TLR4 is expressed in proOLs and that its decrease can be reversed, at least in part, by LPS-stimulated microglial activation.
TLR4 Is Expressed in the Injured Adult Rat Spinal Cord and in Animals Receiving Transplantation of Stimulated proOLs
We also determined the expression of TLR4 of the injured spinal cord at different time points or after transplantation of OPCs or stimulated proOLs. Compared with the baseline group (0 day), TLR4 expression was significantly increased at 1 day post-SCI, peaked at 2–3 days, and decreased but remained significantly high at 14 days post-SCI (Fig. 3A). In the sham-operated control, the TLR4 mRNA level was very low. Increased levels of TLR4 mRNA were found in groups that received stimulated proOL transplantation at 1 and 3 days (Fig. 3B). Such increases in TLR4, however, were significantly lower than the OPC and vehicle groups.

Time course of TLR4 expression following SCI or after transplantation of OPCs or stimulated proOLs. (A) Polymerase chain reaction (PCR) analysis shows the time course of toll-like receptor 4 (TLR4) mRNA expression after spinal cord injury (SCI). Values are expressed as mean ± standard error of the mean (SEM) of six groups, n = 3 per group. (B) TLR4 mRNA expression in the sham-operated control (CNT), SCI + stimulated pro-oligodendroblasts (proOL), SCI + oligodendrocyte progenitor cell (OPC), and SCI + phosphate-buffered saline (PBS) groups at 1 and 3 days post-SCI. Values are expressed as mean ± SEM of seven groups, n = 3 per group. ∗p < 0.05; ∗∗p < 0.01; analysis of variance (ANOVA) followed by Bonferroni's multiple comparison posttest. Abbreviations: GADPH, glyceraldehyde 3-phosphate dehydrogenase.
Different OL Lineage Cells Show Different Vulnerabilities to Activated Microglial Stimulation
To better characterize the effects of activated microglia stimulation on OL lineage cells, we determined their survival, proliferation, and differentiation using a live/dead assay and a panel of OL developmental markers for OPCs (A2B5), proOLs (O4), preOLs (GalC), and OLs (MBP), respectively (Fig. 4). For OPCs, treatment with L+M and L-M significantly reduced OPC survival (Fig. 4A). Medium from both nonactivated (L-M) and activated (L+M) microglia strongly enhanced survival of more mature OL lineage cells including proOLs (Fig. 4B), preOLs (Fig. 4C), and OLs (Fig. 4D).

Different stages of oligodendrocyte (OL) lineage cells show selective vulnerability to LPS-stimulated microglial activation. Effects of lipopolysaccharide (LPS)-stimulated or nonstimulated microglial conditioned medium (L+M, microglia conditioned medium that received LPS stimulation, or L-M, microglial conditioned medium that received no LPS stimulation) or Rhodobacter sphaeroides (RS; an LPS inhibitor) on the viability of OL lineage cells at different developmental stages. Cultures received either basal microglia medium (basal, BS), L-M, or L+M (LPS: 0.1 mg/ml) for either 4 h [for oligodendrocyte progenitor cells (OPCs) and pro-oligodendroblasts (proOLs)] or 24 h [for preoligodendrocytes (preOLs) and OLs]. In addition, for the RS group, 50 nmol/L of RS, an LPS inhibitor, was added together with LPS to the L+M. Cell survival is expressed as a percentage of untreated cells in BS (A-D), and cell death is expressed as a percentage of dead cells over total cells per field (E-H). All data are expressed as mean ± standard error of the mean (SEM) (n = 3). (I–L) Effect of L+M or L-M on the differentiation of OL lineage cells. The newly appeared stage-specific markers are expressed as the number of marker-specific cells/all cells per field. Cells were counted in five fields per coverslip (300-600 cells per field). ∗p < 0.05 versus BS; ∗∗p < 0.01 versus BS; ••p < 0.01 versus L-M. Abbreviations: GalC, galactocerebroside; MBP, myelin basic protein.
Medium from both nonactivated (L-M) and activated (L+M) microglia may also enhance the differentiation and maturation of more mature OL lineage cells. For example, immature OLs in basal medium remained less than 50% as undifferentiated GalC+ preOLs (Fig. 4K). L+M strongly accelerated preOL differentiation as evidenced by the presence of higher percentages of GalC+ preOLs. Notably, although L-M also increased GalC+ preOLs when compared to the nontreated control, the effect was weaker than that of the L+M group (Fig. 4K). These data suggest that microglial activation mediates protection of preOLs. For mature OLs, microglial activation enhanced primary OL viability as evidenced by the higher survival (Fig. 4D) and higher percentage of MBP+ mature OLs (Fig. 4L). Administration of LPS-RS failed to affect the viability and differentiation of OL lineage cells (Fig. 4).
Activated Microglial Stimulation Affects the Long-Term Survival, Proliferation, and Differentiation of OL Lineage Cells at Different Developmental Stages
To test further the long-term effect of microglial activation on the viability, proliferation, and myelinating capability of OL lineage cells, we treated these cells with L+M and L-M at different OL stages (Fig. 1A). All cells were allowed to differentiate into the mature OL stage (e.g., approximately 15 days in vitro from the early OPC stage) and then were analyzed. Cell survival was determined with the MTT assay, which was used to assess mitochondrial function in living cells 38 . As shown in Figure 5A, in basal conditions, the survival rate of the OPC group was significantly lower than that of the mature OLs (dashed line, designated as 100%). In the presence of L+M or L-M, the survival rate of the OPC group remained significantly low when compared to later stages of OLs treated with the same conditions (Fig. 5A). Importantly, only stimulated proOLs exposed to L+M showed the greatest survival compared to those exposed to L-M or compared to other OL lineage cells exposed to either L+M or L-M (Fig. 5A). Furthermore, stimulated proOLs exposed to L+M showed the greatest staining for MBP, a myelinating OL marker, than any other cell stages exposed to L+M or L-M (Fig. 5B).

Effect of LPS-stimulated microglial conditioned medium on the proliferation and survival of different stages of oligodendrocyte (OL) lineage cells. (A) Long-term survival assessment of OL lineage cells treated with or without lipopolysaccharide (LPS)-stimulated microglial conditioned medium (L+M, microglia conditioned medium that received LPS stimulation, and L-M, microglial conditioned medium that received no LPS stimulation, respectively). The design can be seen in Figure 1A. Mature OLs with no treatment served as a control (100%, dashed line). (B) Myelinating capacity of OL lineage cells treated with L+M or L-M at different stages. (C) Ki-67+ staining shows the effect of L+M or L-M on oligodendrocyte progenitor cells (OPCs), pro-oligodendroblasts (proOLs), preOL, and OL proliferation compared with OPCs cultured in the basal microglia medium (BS; considered as 100%). (D) Bromodeoxyuridine (BrdU) incorporation assay confirmed the Ki-67+ staining result. BrdU was added during the last 16 h of culture. The data represent the percentage of BrdU incorporation in L+M- and L-M-treated cells compared to that in the BS (considered as 100%). ∗p < 0.05; ∗∗p < 0.01. Two-way analysis of variance (ANOVA) followed by Fisher's LSD post hoc test. Abbreviations: MBP, myelin basic protein; PCR, polymerase chain reaction.
To determine the long-term effect of activated microglial stimulation on proliferation of OL lineage cells, both Ki-67+ staining (Fig. 5C) and BrdU incorporation (Fig. 5D) assays were used. OPCs cultured in the basal medium (BS) containing no microglia conditioned medium were used as a control (100%). We found that exposure to L+M and L-M inhibited proliferation of OPCs (~75–80% of the control) (Fig. 5C). The proliferation rate of proOLs was further reduced in the presence of L+M and L-M compared to that of OPCs. Almost no proliferation was observed in both preOL and OL cells when exposed to L+M or L-M (Fig. 5C). BrdU incorporation assay further confirmed results observed by Ki-67 staining (Fig. 5D).
Effect of Activated Microglia Stimulation on the Morphology of OL Lineage Cells at Different Developmental Stages
OL lineage cells at different developmental stages can be detected by a combination of stage-specific markers (shown in Fig. 1B). OPCs were double labeled with PDGFαR and A2B5 and showed typical bi- or tripolar morphology (Fig. 6A and B). ProOLs were double labeled with PDGFαR and O4, contained a few short processes, and were morphologically simple (Fig. 6C and D). PreOLs were double labeled with GalC and O4 and showed a multipolar morphology (Fig. 6E and F). Mature OLs were double labeled with MBP and O4 and contained membrane sheets or lacy processes, which were extensively ramified (Fig. 6G and H). In general, OL lineage cells stimulated with L+M showed similar morphological characteristics to control culture without microglial conditioned medium.

Effect of lipopolysaccharide (LPS)-stimulated microglial conditioned medium on morphology of OL lineage cells. Each oligodendrocyte (OL) lineage cell type was identified with two stage-related markers. (Rows A and B) Oligodendrocyte progenitor cells (OPCs) were double labeled with platelet-derived growth factor α receptor (PDGFαR) and mouse monoclonal antibody to A2B5 (A2B5). The cells show typical bi- or tripolar morphology. (Rows C and D) Pro-oligodendroblasts (proOLs) were double labeled with PDGFαR and oligodendrocyte marker O4 (O4). These cells contain a few short processes and are morphologically simple. (Rows E and F) PreOLs were double labeled with galactocerebroside (GalC) and O4. These cells show a multipolar morphology. (Rows G and H) Mature OLs were double labeled with myelin basic protein (MBP) and O4. Mature OLs contain membrane sheets or lacy processes, which are thicker than those of preoligodendrocytes (preOLs). Their processes are extensively ramified. In general, stage-specific OL lineage cells showed similar morphological characteristics in control culture medium (A, C, E, G) or in lipopolysaccharide (LPS)-stimulated microglial conditioned medium (L+M; B, D, F, H). Abbreviations: L+M, lipopolysaccharide (LPS)-stimulated microglial conditioned medium; L-M, microglial conditioned medium that received no LPS stimulation; CNT, toll-like receptor 4 (TLR4) mRNA expression in the sham-operated control. Scale bars: 20 μm.
Transplantation of Stimulated proOLs Improves Locomotor Function After a Contusive SCI
We first compared the efficacy of three kinds of proOLs stimulated with LPS-activated microglia (L+M proOL), nonactivated microglia (L-M proOL), or no stimulation (naive proOL) following contusive SCI. The BBB open-field test demonstrated that animals receiving L+M proOLs had significantly improved locomotor recovery at and beyond 4 weeks PI compared to the vehicle, L-M proOL, and naive proOL groups (Fig. 7A). The L+M proOL group, therefore, was selected for the second experiment comparing its efficacy with OPCs, which have been tested previously for transplantation after SCI10,21,45,46.

Transplanted L+M proOLs improved motor recovery after acute contusive SCI. (A) Comparison of Basso–Beattie–Bresnahan (BBB) locomotor rating scale among five treatment groups. The L+M proOL transplantation group showed significant improvement of BBB score than the vehicle, L-M proOL, and naive proOL groups. ∗p < 0.05; two-way analysis of variance (ANOVA) followed by Fisher's LSD post hoc test. (B) Comparison of BBB locomotor rating scale among four treatment groups. The SCI + L+M proOL group showed significant improvement of BBB score than the SCI + vehicle and SCI + OPC groups. ∗p < 0.05; two-way ANOVA followed by Fisher's LSD post hoc test. (C, D) Footprint analysis at 5 weeks post-SCI showed no difference in paw length between the sham and SCI + proOL groups but showed significant differences between the sham and SCI + OPC or SCI + vehicle groups (C). Significant increase in stride length of hindlimbs was found in the SCI + proOL group compared to the SCI + OPC or SCI + vehicle group (D). (E) Grid walking analysis at 4 weeks post-SCI. The number of hindpaw foot drop errors on the grid per run was significantly reduced in the SCI + proOL group compared to the SCI + OPC or SCI + vehicle group. (F) Withdraw response in the 53°C hot plate test at 6 weeks post-SCI. There was a significant difference between the sham and the three treatment groups. However, no difference was found between the three treatment groups. ∗p < 0.05; ∗∗p < 0.01; one-way ANOVA followed by post hoc Dunnett's T3. Abbreviations: L+M, lipopolysaccharide (LPS)-stimulated microglial conditioned medium; L-M, microglial conditioned medium that received no LPS stimulation; proOL, pro-oligodendrites; LH, left hindlimb; OPC, oligodendrocyte progenitor cell; RH, right hindlimb; SCI, spinal cord injury.
When comparing the efficacy of L+M proOLs with OPCs, combined motor performance was evaluated. The BBB open-field test demonstrated that animals receiving stimulated proOLs showed significantly greater recovery at and beyond 4 weeks PI compared to the vehicle and OPC groups (Fig. 7B). Footprint analysis at 5 weeks post-SCI showed significant differences in paw length between the sham and OPC or vehicle group but no difference between the sham and stimulated proOL group (Fig. 7C). In the stimulated proOL group, the stride length was significantly improved (Fig. 7D), and the number of slips on the grid was significantly reduced compared to the OPC and vehicle groups (Fig. 7E). The hot plate test revealed that the withdraw latency was significantly reduced in all three SCI groups compared with the sham group that received only laminectomy (Fig. 7F). These results indicate that transplantation of stimulated proOLs, but not OPCs or vehicle, improved locomotor, but not sensory, recovery after SCI.
Transplantation of Stimulated proOLs Increases Intralesional Axon Numbers and Myelination After a Contusive SCI
To determine whether transplantation of L+M proOLs improved tissue repair, we examined cross sections of the injury epicenter after toluidine blue staining. In all groups, lesions were found to be confined in the dorsolateral area of the spinal cord, leaving the ventrolateral area largely spared. We found that the SCI + L+M proOL group (Fig. 8, right column) contained the greatest amount of intralesional axons and myelin at the lesion epicenter compared to the SCI + vehicle (Fig. 8, left column) or SCI + OPC group (Fig. 8, middle column). In fact, in both the SCI + vehicle and SCI + OPC groups, the lesion epicenter was filled with numerous macrophages. Figure 9B–D further shows the presence of numerous debris-laden macrophages in the lesion epicenter in the SCI + vehicle (Fig. 9B) and SCI + OPC (Fig. 9C) groups and the presence of numerous axons and myelin in the lesion epicenter of the SCI + L+M proOL group (Fig. 9D). Moreover, the SCI + L+M proOL group significantly decreased the G ratio (Fig. 9E) and increased myelin thickness (Fig. 9F) compared to the vehicle and OPC groups. Collectively, these results suggest that acute transplantation of activated microglia-stimulated proOLs is a more superior repair strategy than no transplantation or transplantation of OPCs in enhancing intralesional axon number and myelination. The histological results are also in strong agreement with the behavioral results described earlier.

Transplantation of L+M proOLs increased intralesional axon number and myelination after acute contusive SCI at T10. (A–C) Images of toluidine blue-stained semithin transverse sections show the injury epicenter of different treatment groups. Prooligodendrites were preconditioned with lipopolysaccharide (LPS)-stimulated microglia (L+M proOLs). In all groups, lesions were found to be in the dorsal area of the spinal cord. (D–F) High magnifications of boxed areas in (A)–(C) show the lesion sites filled with cellular structures and myelinated axons. (G–I) At even higher magnifications of boxed areas in (D)–(F), numerous macrophages, engulfed with cellular debris (G, arrows), and degenerating myelin profiles (G, dashed arrows), acellular spaces (H, ∗), and myelinated axons (I) were found in different treatment groups (I). Dashed arrows in (I) illustrate newly formed thin myelin surrounding axons within the lesion site after spinal cord injury (SCI). Scale bar: 200 μm (A–C), 50 μm (D–F), 15 μm (G–I). Abbreviations: OPC, oligodendrocyte progenitor cell.
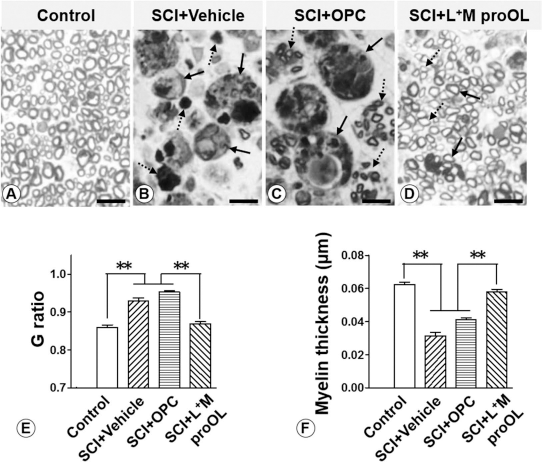
Transplantation of L+M proOLs increased intralesional axon number and myelination. (A–D) Myelinated axons (A), macrophages (B, solid arrows), degenerating myelin debris (B, dashed arrows), myelinated axon fascicles (C, dashed arrows), debris-filled macrophages (C, solid arrows), and thin myelinated axons (D, dashed arrows) were found in the sham (A) and different treatment groups (B–D). Notably, Schwann cells were frequently found to myelinate axons (D, solid arrow). (E, F) The G ratio (E) and myelin thickness (F) are shown. ∗∗p < 0.05; analysis of variance (ANOVA) followed by Bonferroni's multiple comparison posttest. Three rats from each group were analyzed, and a minimum of 500 axons were measured from each rat. Abbreviations: OPC, oligodendrocyte progenitor cell; proOL, pro-oligodendroblast; L+M, lipopolysaccharide (LPS)-stimulated microglial conditioned medium.
Discussion
One consequence of SCI is OL cell death and demyelination contributing to functional deficits. Here we report that L+M proOLs were more resistant to cell death than OPCs in vitro and that intrathecal delivery of L+M proOLs increased intralesional axons and myelin and markedly improved behavioral recovery following a contusive SCI in adult rats. To our knowledge, this is the first time that L+M-stimulated proOLs were transplanted in a SCI model and that such transplantation resulted in histological and functional improvements after SCI.
Activated Microglia Stimulation Has Divergent Effects on Stage-Specific OL Lineage Cells
In this study, we established the isolation and characterization of OL lineage cultures at different developmental stages, allowing us to compare their viability, proliferation, differentiation, and expression of myelin-associated proteins in the presence or absence of activated microglia stimulation. We noted divergent effects of LPS-induced microglia conditioned medium or L+M on viability of OL lineage cells. While reducing the survival of early OPCs, L+M increased the survival of more mature OL lineage cells, including the late OPCs or proOLs. It should be noted that in both cases L+M was able to reverse the baseline state of OL lineage cells by reducing early OPC proliferation and rescuing more mature OL lineage cells from death. In the literature, studies examining the effect of reactive microglia on the survival of OL lineage cells have yielded conflicting results. For example, LPS-induced reactive microglia have been reported to augment 30 or attenuate 36 OPC proliferation or are toxic to them in vitro and in vivo 47 . Our data indicate that activated microglia-induced effects on OPCs may be dependent on the kind of microglial activator used, the factors released from the activated microglia 48 , and the stages of cell maturation.
In this study, we show, for the first time, that activated microglia stimulation enhanced proOL survival, differentiation, and expression of myelin-associated proteins. Although both nonactivated and LPS-activated microglia equally reduced cell death during OL lineage cell differentiation, L+M stimulation at the proOL stage was significantly more effective than other OL stages in supporting cell survival and differentiation. Importantly, cells stimulated by activated microglia at the proOL stage increased the number of live cells by approximately 30–40% compared with the basal, untreated OPCs. This observation indicates that O4+ proOLs benefit from the presence of reactive microglia and presumably resist the deleterious effects that the activated microglia exert on early OPCs. Our results are in agreement with some previous studies showing that more mature OLs are more resistant than OPCs to a wide variety of insults, including inflammation, oxidative stress, and elevated glutamate levels31,49. Though the mechanism needs further investigation, our data indicate that normally occurring OL death may reflect a competition for survival signals from factors released by activated microglia that are limited in amount or availability. This is partially in line with previous studies that most OLs produced in the optic nerve are normally lost within a brief period after they are generated38,50,51. We conclude that L+M-stimulated proOLs are more resistant than early OPCs to a wide variety of insults.
ProOLs May Respond to TLR4-Specific LPS Through a Direct and an Indirect Mechanism
TLR4-specific LPS does not affect other TLRs in vitro 31 . LPS binds to TLR4-myeloid differentiation factor 2 complexes (TLR4-MD2) on host–cell surfaces and promotes their dimerization. This initiates intracellular signaling 52 . In this study, microglial activation was evidenced by the expression of TLR4 mRNA and the release of proinflammatory cytokines in a time-dependent manner after LPS stimulation. The releasing of TNF-α and IL-6 is TLR4 dependent since blocking TLR4 with LPS-RS can completely block such release.
The expression of TLR4 mRNA by both OPCs and proOLs suggests that these cells were directly responsive to LPS. In vitro, TLR4 expression in stimulated proOLs was significantly higher than that in nonstimulated counterparts. In vivo, TLR4 was activated following SCI26,53, but its expression in the stimulated proOL transplantation group was significantly lower than in the OPC or vehicle control groups. These data suggest that TLR4 may play a role in OPC proliferation and differentiation. Additionally, Schonberg et al. showed that intraspinal macrophages could be activated by the TLR4 ligand, which caused a local increase in IL-1β and CNTF and induced NG2+ cell proliferation and oligodendrogenesis 54 . Furthermore, the beneficial effect of macrophages/microglia was also reported in a contusive SCI model, where recovery was impaired in TLR2 and TLR4 null mice 55 . Finally, LPS-stimulated microglial activation via TLR4 improved remyelination, supporting the importance of TLR signaling in repair processes 24 . Thus, the effect of LPS on the transplanted proOLs after SCI could be mediated directly through TLR4 expression on proOLs or indirectly through activated microglia stimulation of proOLs prior to transplantation 56 , or both.
Microglial Activation-Stimulated proOLs Promote Tissue Repair and Behavioral Recovery
In the present study, we first determined that transplantation of L+M proOLs, rather than L-M proOLs, or naive proOLs, improved locomotor recovery in a contusive SCI model, as assessed using BBB locomotor rating scales. We then used comprehensive behavior and histological assessments to determine the efficacy of transplanted L+M proOLs in the same model and compared that with the vehicle and OPC transplantation groups. The OPC group was used as a transplantation control because these cells have shown promise for cell-based repair of SCI10,21,45,46. We found that intrathecal delivery of L+M proOLs resulted in significantly greater behavioral recovery in BBB locomotor rating scale, stride length, and slips on the grid assessments than the vehicle and OPC groups. Histologically, transplantation of stimulated proOLs after acute SCI caused a considerable increase in intralesional axon number and myelination, and less accumulation of macrophages when compared with the nonstimulated OPCs. Thus, proOLs may be a better source of OL lineage cells than OPCs for transplantation in promoting repair and recovery after SCI. We did not consider using late-stage OLs (preOLs or mature OLs) for transplantation because these cells are postmitotic, nonmigratory, and unable to remyelinate upon transplantation into lesions22,23,57. Since our grafted L+M proOLs were not prelabeled, it was difficult to determine the fate of these cells in vivo after being IT delivered. Our histological and functional assessments, both blinded, indicate that these cells played a functional role. However, further studies need to be conducted to determine their survival, migration, and differentiation in this model using prelabeled proOLs.
Comparing with direct transplantation of OPCs, induction of OPCs to proOL in vitro prior to transplantation, as presented here, may be more advantageous since these cells have already initiated the differentiation process toward more mature OLs, and such process, when initiated, may be less affected by the host microenvironment. It is conceivable that without fully differentiating, grafted OPCs cannot exert their myelination function. One reason for the lack of full differentiation after OPC transplantation is that reactive astrocytes may inhibit differentiation of grafted OPCs into OLs with concurrent promotion of astrocyte differentiation 45 . For OPCs to differentiate into mature OLs, the first and critical step is to initiate their differentiation into OL lineage rather than into astrocytes. Our results indicate that transplantation of proOLs is more advantageous than that of OPCs, since the former have already initiated the myelinating process and, therefore, will likely continue to mature after transplantation.
Conclusions
The current study reports a promise of intrathecal delivery of proOLs, stimulated by activated microglia, into a clinically relevant, contusive SCI model. Such an approach may offer a promising therapeutic potential to promote tissue repair and functional recovery after SCI.
Footnotes
Acknowledgments
This work was supported by a postdoctoral grant from the China Postdoctoral Science Foundation (20100481475). The authors thank Ms. Patti Raley, a medical editor, for her critical reading of the manuscript. The authors declare no conflicts of interests.