
Abstract
Pancreatic and duodenal homeobox 1 (Pdx1) is a transcription factor that regulates the embryonic development of the pancreas and the differentiation toward β cells. Previously, we have shown that exposure of mouse embryonic stem cells (mESCs) to high concentrations of diethylenetriamine nitric oxide adduct (DETA-NO) triggers differentiation events and promotes the expression of Pdx1. Here we report evidence that Pdx1 expression is associated with release of polycomb repressive complex 2 (PRC2) and P300 from its promoter region. These events are accompanied by epigenetic changes in bivalent markers of histones trimethylated histone H3 lysine 27 (H3K27me3) and H3K4me3, site-specific changes in DNA methylation, and no change in H3 acetylation. On the basis of these findings, we developed a protocol to differentiate mESCs toward insulin-producing cells consisting of sequential exposure to DETA-NO, valproic acid, and P300 inhibitor (C646) to enhance Pdx1 expression and a final maturation step of culture in suspension to form cell aggregates. This small molecule-based protocol succeeds in obtaining cells that express pancreatic β-cell markers such as PDX1, INS1, GCK, and GLUT2 and respond in vitro to high glucose and KCl.
Keywords
Introduction
Research efforts have been made over the last 15 years to generate pancreatic β-cell surrogates from stem cells. Thus, generation of definitive endoderm from embryonic stem cells (ESCs) and subsequent differentiation into pancreatic progenitors and glucose-responsive pancreatic β cells have been reported1–8. The biology of pancreas development might be instrumental in providing information to optimize current differentiation protocols. In this regard, the transcription factor pancreatic and duodenal homeobox 1 (Pdx1) stands out as a relevant regulator of pancreatic development and differentiation toward β cells9,10. Pdx1 gene expression is controlled by the interaction of a set of transcription factors with highly conserved sequences of its promoter 11 . Additional regulatory mechanisms such as DNA methylation and histone covalent modifications have been reported to be relevant in the repression of Pdx1 in a model of type 2 diabetes 12 .
On the other hand, polycomb repressive complex 2 (PRC2) plays a role in the regulation of key developmental genes in ESCs13,14. PRC2 catalyzes di- and trimethylation of histone H3 Lys 27 residue (H3K27me2/3), which has been associated with the silencing of target genes13–16. PRC2 recruitment to target genes is dependent on jumonji, AT rich interactive domain 2 (JARID-2), whose expression is regulated by stemness factors octamer-binding transcription factor 4 (OCT-4), (sex-determining region Y)-box 2 (SOX2), and NANOG17–22. Indeed, PRC2 activity represses Pdx1 gene expression 17 , and epigenetic changes of the Pdx1 gene have been reported in ESCs during generation of pancreatic endoderm (PE) 23 . On the other hand, persistence of both acetyl-histone H3 (AcH3) and trimethylated histone H3 lysine 27 (H3K27me3) marks on the silent Pdx1 gene in hepatoblasts has been reported 24 . In addition, histone acetyltransferase P300 activity has been reported to be involved in the selection of liver over pancreas fate 24 . P300 also acts as a repressor independently of its acetyltransferase activity, since sumoylation of cell cycle regulatory domain 1 (CRD1), a repressor domain of P300, induces the recruitment of histone deacetylase 6 (HDAC6) to promoters susceptible to P300-mediated repression such as p21 and survivin25,26.
Nitric oxide (NO) is a regulator of stem cell fate, and successful generation of definitive endoderm from ESCs has been achieved by exposure to chemical NO donors in a differentiation protocol with transient expression of Pdx1 during the process6,27. In the present study, we sought to explore the mechanisms involved in the regulation of Pdx1 by NO and found that this action entails the release of PRC2 and P300 from its promoter region. These events are accompanied by changes in bivalent marks of histone H3K27me3 and H3K4me3 and in the methylation status of specific CpG islands. Given the role of P300 in the regulation of Pdx1, we optimized a differentiation protocol for generating insulin-producing cells from ESCs by the addition of P300 inhibitor C646 (P300i) followed by culture in suspension. This protocol succeeds in obtaining cell clusters with sustained expression of pancreatic β-cell markers such as Pdx1, insulin-1 (Ins1), glucokinase (Gck), Kir6.2, and glucose transporter, member 2 (Glut2) and that are responsive to conventional secretagogues such as glucose and KCl.
Materials and Methods
Cell Culture and Treatments
Mouse ESC (mESC) lines D3 and R1/E [American Type Culture Collection (ATCC), Manassas, VA, USA] were used. INS-1E cells were provided by Dr. P. Maechler (Geneva University, Geneva, Switzerland). D3 and R1/E mESCs were maintained in feeder free culture at 37°C with 5% CO2 in Dulbecco's modified Eagle's medium (DMEM) (Gibco, Grand Island, NY, USA), supplemented with 15% fetal bovine serum (FBS) (Hyclone, Logan, UT, USA), 0.1 mM β-mercaptoethanol (Gibco, Paisley, Scotland, UK), 2 mM L-glutamine (Gibco, Paisley, Scotland, UK), 1% minimum essential medium (MEM) nonessential amino acids (Gibco, Paisley, Scotland, UK), and 100 U/ml penicillin:100 μg/ml streptomycin (Gibco, Paisley, Scotland, UK). The undifferentiated state was maintained by addition of leukemia inhibitory factor (LIF) (1,000 U/ml) (ESGRO, Chemicon, Charlottesville, VA, USA). INS-1E cells were cultured in Roswell Park Memorial Institute (RPMI)-1640 medium (Lonza, Verviers, Belgium), supplemented with 10% FBS, 10 mM N-2-hydroxyethylpiperazine-N-2-ethane sulfonic acid (HEPES; Gibco, Paisley, Scotland, UK), 1 mM sodium pyruvate (Gibco, Paisley, Scotland, UK), 100 U/ml penicillin:100 μg/ml streptomycin, 2 mM L-glutamine, and 50 μM β-mercaptoethanol (Gibco, Paisley, Scotland, UK). R1/E cells, which were used to study the Pdx1 gene regulation, were cultured for 3 days in gelatinized dishes in the presence or absence of LIF and then exposed to 500 μM diethylenetriamine nitric oxide adduct (DETA-NO) (Sigma-Aldrich, St. Louis, MO, USA) for 19 h. Cultured cells were then disaggregated with trypsin solution (Gibco, Paisley, Scotland, UK) and collected by centrifugation at 230 × g. For differentiation protocols, D3 cells were cultured for 3 days without LIF, 19 h with 500 μM DETA-NO, 6 days with 100 μM valproic acid (Sigma-Aldrich), and 20 h with 50 μM P300 inhibitor C646 (Millipore, Darmstadt, Germany). Cell aggregates were then gently scraped and transferred to Falcon tubes (Thermo Fisher Scientific, Waltham, MA, USA) and allowed to sediment for 10 min. The resulting aggregates were then grown in suspension in 12- to 24-well plates for 3 days. On the fifth day of culture, FBS was reduced to 2% until the end of the protocol. Culture medium was changed daily.
RNA Isolation, Reverse Transcription PCR, and Real-Time PCR Analysis
Total RNA was extracted using Easy Blue reagent (Intron Biotechnology, Gyeonggi-do, South Korea) and chloroform/isopropanol purification procedure. cDNA synthesis was performed with 1 μg of total RNA using Moloney murine leukemia virus (M-MVL) reverse transcriptase (Promega, Madison, WI, USA) and random primers according to the manufacturer's instructions. Genes were analyzed by qualitative polymerase chain reaction (PCR). Primer melting temperature (Tm) for all genes was designed at 60°C using MyTaq Red DNA polymerase (Bioline Reagents Ltd, London, UK) with the following specifications: amplification for 35–40 cycles of denaturation at 95°C for 30 s, annealing at 60°C for 15 s and extension at 72°C for 30 s, and a final extension at 72°C for 10 min. PCR was performed in a MyCycler (Bio-Rad Laboratories, Hercules, CA, USA) thermal cycler. For real-time PCR (RT-PCR) analysis, endogenous mRNA levels were measured based on SYBR Green (Applied Biosystems, Foster City, CA, USA) detection with the ABI Prism 7500 machine (Applied Biosystems). Results were normalized with β-actin expression. PCR primers used are shown in Supplementary Table 1 (available at http://www.cabimer.es/web/docs/grupos/tcmr2/MaterialSuplementarioCellTrasplantation.zip).
Western Blotting
Cells were trypsinized, centrifuged at 230 × g, and washed once with cold phosphate-buffered saline (PBS) (Gibco, Paisley, Scotland, UK). Cell pellets were then resuspended and incubated in radioimmunoprecipitation assay (RIPA) buffer (Sigma-Aldrich) supplemented with protease inhibitors (Sigma-Aldrich) and phosphatase inhibitor cocktail (Sigma-Aldrich) for 45 min on ice and sonicated with four pulses (10 s each) at 10% amplitude in a Branson sonifier (Branson Ultrasonics Corporation, Danbury, CT, USA). After centrifugation at 9,300 × g, protein content in supernatants were quantified by Bradford assay. Proteins were denatured in Laemmli buffer containing 62.5 mM Tris-HCl (pH 6.8), 2% sodium dodecyl sulfate (SDS), 10% glycerol, 0.01% bromophenol blue, and 2.5 % β-mercaptoethanol (all Sigma-Aldrich) for 10 min at 96°C. Proteins were separated by SDS polyacrylamide gel electrophoresis (SDS-PAGE) and transferred to polyvinylidene difluoride (PVDF) membranes (GE Healthcare, Buckinghamshire, UK). Membranes were then blocked with Tris-buffered saline (Sigma-Aldrich) supplemented with 0.1% Tween 20 (TBST; Sigma-Aldrich) containing 5% skim milk (Becton Dickinson, Franklin Lakes, NJ, USA) for 1 h at room temperature (RT). Then membranes were probed with anti-Pdx1 (1:2,000; Abcam, Cambridge, UK), anti-P300 (1:1,000; Santa Cruz Biotechnology, Heidelberg, Germany), anti-Jarid-2 (1:1,000; Abcam), anti-Ezh2 (1:500; BD Biosciences, San Jose, CA, USA), and anti-β-actin (1:10,000; Sigma-Aldrich) in TBST with 5% skim milk overnight at 4°C. Membranes were subsequently washed three times with TBST. Secondary antibodies used were anti-rabbit immunoglobulin G (IgG) (1:20,000, Sigma-Aldrich) and anti-mouse IgG (1:40,000; Jackson ImmunoResearch, Suffolk, UK). Proteins were detected by chemiluminescence with WesternBright ECL HRP substrate (Advansta Inc., Menlo Park, CA, USA).
Immunocytochemistry
R1/E cells (1.5 × 10⁴) were cultured in wells containing Permanox slides (Thermo Fisher Scientific) and maintained at 37°C with 5% CO2. To analyze PDX1 expression, cells exposed to DETA-NO for 19 h were fixed with 4% paraformaldehyde (PFA) (Panreac AppliChem, Barcelona, Spain), permeabilized with cold methanol, and blocked with 4% bovine serum albumin (BSA) (Sigma-Aldrich). Cells were incubated overnight with anti-Pdx1 (1:100; Abcam) and anti-α-tubulin (1:300; Sigma-Aldrich). For immunofluorescence of islet-like clusters (D3 cells), clusters were fixed with 4% PFA in PBS overnight at 4°C, dehydrated with ethanol and xylene, and embedded in paraffin (Merk, Darmstadt, Germany). Sections were cut at a thickness of 5 μm with a Leica DM6000B microtome (Leica Microsystems Inc., Concord, ON, Canada). Sections were deparaffinized through a series of xylene and ethanol washes, incubated in PBS for 5 min, and the samples were autoclaved with a 0.01 M citrate buffer (Sigma-Aldrich) for antigen retrieval. Sections were blocked with 3% BSA and 0.2% Triton X-100 (Sigma-Aldrich) in PBS for 1 h at RT and incubated overnight at 4°C with anti-Pdx1 (1:100; Developmental Studies Hybridoma Bank, Iowa City, IA, USA), anti-C-peptide (1:100; Beta Cell Biology, Vanderbilt University, Nashville, TN, USA), and anti-Glut2 (1:100; Chemicon). Finally, cells were washed three times with PBS and 0.1% Tween (PBST), and detection of primary antibodies was carried out using anti-rabbit Alexa Fluor 594 (1:300; Invitrogen, Carlsbad, CA, USA) and anti-mouse Alexa Fluor 488 (1:300, Invitrogen). 4′,6-Diamidino-2-phenylindole (DAPI) (Sigma-Aldrich) counterstaining was also performed. Fluorescent images were visualized with a Leica DM 5500 microscope (Leica Microsystems, Wetzlar, Germany). Images were processed with Adobe Photoshop (Adobe Systems Incorporated, San Jose, CA, USA).
Flow Cytometry
Cultured cells were detached by trypsinization and collected following centrifugation at 230 × g. Cell pellets were fixed with 4% PFA for 10 min at RT, permeabilized with 0.5% Triton X-100 for 10 min on ice, and blocked with PBS 5% FBS at 4°C for 30 min. Cells were then incubated at 4°C for 1 h with anti-Pdx1 (1:600; Abcam) or anti-rabbit IgG-phycoerythrin (PE) goat isotype control (1:600; Abcam) in PBS 5% FBS. Cells were washed three times at 4°C with PBS and exposed to the secondary antibody, anti-rabbit IgG-PE (1:500; Abcam), for 30 min at RT. After three washes with PBS, cells were resuspended in 500 μl of PBS, and fluorescence readouts were carried out by flow cytometry (BD FACSCalibur; BD Biosciences).
Bisulfite Sequencing PCR (BSP)
A region of approximately 2,000 base pairs (bp) of the Pdx1 promoter was analyzed with the software Methyl Primer Express v1.0. (Applied Biosystems) to identify CpG-rich islands. Primers designed for these regions are listed in Supplementary Table 1 (available at http://www.cabimer.es/web/docs/grupos/tcmr2/MaterialSuplementarioCellTrasplantation.zip). Then genomic DNA from 7.5 × 10⁴ cells was converted with sodium bisulphite using the Cells-to-CpG Bisulphite Conversion Kit (Applied Biosystems). Converted DNA was amplified by PCR using MyTaq HS Red DNA Polymerase (Bioline Reagents), and then PCR products were purified and cloned into pGEM-T to obtain Escherichia coli (E. coli) colonies. Ten colonies per treatment were analyzed by PCR and later sequenced in a DNA analyzer 3730 (Applied Biosystems). The results were analyzed by the BiQ Analyzer Software (Max-PlanckInstitute and Saarland University, Saarbrücken, Germany).
Bisulfite Pyrosequencing
The results obtained by BSP were confirmed by pyrosequencing. Sodium bisulphite modification of genomic DNA of 7.5 × 10⁴ cells was carried out as described above. Converted DNA was eluted in 15 μl, and 2 μl was used for each PCR cycle. Primers used for PCR and sequencing were designed using PyroMark assay design software, version 2.0.01.15 (Qiagen, Hilden, Germany). Pyrosequencing primers are shown in Supplementary Table 1 (available at http://www.cabimer.es/web/docs/grupos/tcmr2/MaterialSuplementarioCellTrasplantation.zip). These primers were designed to hybridize with CpG-free sites to ensure methylation-independent amplification. PCR was performed with biotinylated primers to convert the PCR product to single-stranded DNA templates using the Vacuum Prep Tool (Biotage, Uppsala, Sweden) according to the manufacturer's instructions. Pyrosequencing reactions and methylation quantification were performed in a PyroMark Q24 System version 2.0.6 (Qiagen).
Chromatin Immunoprecipitation Assay (ChIP)
Cells were cross-linked with 1% (w/v) formaldehyde (Sigma-Aldrich) for 10 min at 37°C. Cells (3 × 10⁶) were resuspended in lysis buffer containing 10 mM NaCl, 10 mM Tris-HCl (pH 8), 3 mM Cl2Mg, and 0.5 mM DTT supplemented with protease inhibitors (Sigma-Aldrich) for 10 min on ice. Cells were then centrifuged for 5 min at 800 × g at 4°C. Supernatants were discarded, and the nuclei-containing fraction was washed by gentle inversion with buffer containing 10 mM Tris-HCl (pH 8), 15 mM NaCl, and 60 mM KCl (Sigma-Aldrich). Cell nuclei were subsequently centrifuged for 5 min at 800 × g at 4°C and incubated with washing buffer supplemented with 3 mM CaCl2, protease inhibitors, 0.5 mM 1,4-dithiothreitol (DTT; Sigma-Aldrich), and 5–10 μl of micrococcal nuclease (1:200 dilution) (New England BioLabs, Ipswich, MA, USA). Cell nuclei were incubated for 20 min at 37°C with orbital shaking. Nuclease activity was halted by the addition of 20 μl of 0.5 mM ethylenediaminetetraacetic acid (EDTA; Sigma-Aldrich). Cell nuclei were centrifuged for 5 min at 800 × g at 4°C and lysed with buffer containing 150 mM NaCl, 50 mM Tris-HCl (pH 7.5), 5 mM EDTA, 0.5% NP-40, 1% Triton, and 0.01% SDS and sonicated with three pulses for 10 s each at 10% amplitude in a Branson sonifier. Extracts were then centrifuged for 10 min at 9,300 × g at 4°C. Supernatants containing chromatin with an average size of 500 bp were immunoprecipitated with anti-P300 (4 μg; Santa Cruz Biotechnology), anti-Jarid-2 (3 μg; Abcam), anti-acetylated H3 (1 μg; Abcam), anti-H3K4me3 (1 μg; Abcam), and anti-H3K27me3 (1 μg; Cell Signaling Technology Inc.; Danvers, MA, USA). Rabbit control IgG (Abcam) and mouse IgG1 isotype control mAb (Cell Signaling Technology Inc.) were used as ChIP controls. Dynabeads (15 μl; Invitrogen Dynal AS, Oslo, Norway) was used to prepare Ab–bead complexes and incubated for 30 min at 4°C under rotation in dilution buffer [0.01% SDS, 1.1% Triton X-100, 1.2 mM EDTA, 16.7 mM Tris-HCl (pH 8.1), 167 mM NaCl]. Then chromatin was added and incubated for 1 h. Washes of the complex were once with low-salt buffer [0.1% SDS, 1% Triton X-100, 2 mM EDTA, 20 mM Tris-HCl (pH 8.1), 150 mM NaCl], once with high-salt buffer [0.1% SDS, 1% Triton X-100, 2 mM EDTA, 20 mM Tris-HCl (pH 8.1), 500 mM NaCl], once with LiCl buffer [0.25 M LiCl (Sigma-Aldrich), 1% Igepal CA-630 (Sigma-Aldrich), 1% deoxycholate (Sigma-Aldrich), 1 mM EDTA, 10 mM Tris-HCl (pH 8)], twice with TE buffer [10 mM Tris-HCl (pH 8.1), 1 mM EDTA], and finally eluted with 500 μl of 1% SDS, 0.1 M NaHCO3 (Sigma-Aldrich) solution. DNA was purified by phenol/chloroform procedure. In brief, 500 μl of phenol/chloroform (Panreac AppliChem) was added to the solution containing DNA and stirred vigorously. After centrifugation at 9,300 × g for 10 min, the upper aqueous phase was transferred to a new tube and washed twice with ethanol. Finally, DNA was eluted in 20 μl of water. ChIP analysis was performed by real time-PCR using SYBR Green (Bio-Rad). Promoter occupancy was determined by the percent input method normalized to the condition favoring pluripotency. Primers used are listed in Supplementary Table 1 (available at http://www.cabimer.es/web/docs/grupos/tcmr2/MaterialSuplementarioCellTrasplantation.zip).
Immunoprecipitation
Cells were trypsinized from culture dishes, centrifuged, and washed once with cold PBS. Cell pellets were then resuspended and incubated in nondenaturing lysis buffer containing 50 mM Tris-HCl (pH 7.4), 300 mM NaCl, 5 mM EDTA, 0.1 mM neocuproine (Sigma-Aldrich), and 1% Triton X-100, supplemented with protease inhibitor cocktail (Sigma-Aldrich) for 45 min on ice and subsequently sonicated with four pulses for 10 s each at 10% amplitude. Following centrifugation, supernatant proteins were quantified by Bradford assay. Samples containing 3 mg of protein were incubated with 3 μg of anti-Jarid-2 (Abcam) for 2 h with stirring at 4°C. Then 70 μl of Dynabeads protein A (Thermo Fisher Scientific) was attached to the complex antibody–proteins overnight at 4°C. The samples were washed three times with nondenaturing lysis buffer for 5 min with stirring at 4°C and washed one last time with 200 μl of 50 mM Tris (pH 8). Proteins were denatured with 50 μl of 1× Laemmli buffer supplemented with 2.5% β-mercaptoethanol, separated by gradient SDS-PAGE (Mini-Protean TGX Gels; 4–15% acrylamide; Bio-Rad), and transferred to PVDF membranes. Finally, membranes were blocked with TBST and 5% nonfat dried milk for 30 min at RT and probed with anti-Jarid-2 (1:1,000; Abcam), anti-P300 (1:1,000; Santa Cruz Biotechnology), and anti-Ezh2 (1:500; BD Biosciences). Secondary antibodies were anti-rabbit IgG (1:20,000; Sigma-Aldrich) and anti-mouse IgG (1:40,000; Jackson ImmunoResearch). Total protein (100 μg) was loaded as a control.
Glucose-Stimulated Insulin Secretion
Clusters were washed two times for 30 min at 37°C with homemade Krebs buffer (135 mM NaCl, 3.6 mM KCl, 5 mM NaHCO3, 10.5 mM MgCl2, 0.5 mM NaH2PO4, 2.5 mM CaCl2, 10 mM HEPES, and 0.1% BSA; all Sigma-Aldrich) and were exposed to Krebs buffer containing 3 mM glucose for 1 h, and supernatant was collected. Clusters were then incubated in Krebs buffer containing either 20 mM glucose or 25 mM KCl for 1 h, and supernatant was collected. Insulin release was measured with the Ultrasensitive Mouse Insulin Enzyme-linked Immunosorbent Assay (ELISA) kit (Mercodia, Uppsala, Sweden). DNA of cell clusters was extracted and quantified (Nanodrop ND1000 spectrophotometer; Thermo Fisher Scientific).
Statistical Analyses
Data are means ± standard error of mean (SEM), and comparisons between values were analyzed using one-tailed Student's t-test with SigmaPlot software (Systat Software Inc., San Jose, CA, USA). Values of p < 0.05 were considered statistically significant.
Results
NO Induces Pdx1 Expression
R1/E mESCs cultured for 3 days in the presence or absence of LIF and 500 μM DETA-NO (19 h) increase Pdx1 expression, both at the mRNA and protein levels (Fig. 1A and B). Dose response experiments show that PDX1 protein levels were significantly increased upon exposure of R1/E and D3 mESCs to 500 μM DETA-NO (supplementary Fig. 1, available at http://www.cabimer.es/web/docs/grupos/tcmr2/MaterialSuplementarioCellTrasplantation.zip). Moreover, immunofluorescence studies reveal that PDX1 is localized in the nuclei (Fig. 1C). The population of cells treated with DETA-NO displays a rightward shift in cytometry plots, thus suggesting an enhanced expression of PDX1 protein (Fig. 1D). Quantification of fluorescence intensity shows that PDX1-positive cells have significantly increased fluorescence following exposure to DETA-NO (Fig. 1E).

Nitric oxide effects on Pdx1 expression in R1/E mESCs. (A) Relative expression of Pdx1 by real-time polymerase chain reaction (PCR). These values are normalized to the expression values of β-actin, used as loading control and analyzed using the DDCt algorithm. It represents an average of three independent experiments. Data are presented as mean ± SEM. The y-axis corresponds to relative expression level of Pdx1 (fold change). (B) Western blot of PDX1. It shows the results of Western blot of PDX1 in the four culture conditions. β-Actin was used as loading control. The blot is representative of three independent experiments. (C) PDX1 immunofluorescence. Images show cells cultured in the four conditions and subsequently stained with DAPI (blue), PDX1 (red), and α-tubulin (green). Scale bars: 25 μM. The images shown are representative of three independent experiments. (D) Flow cytometry of PDX1. The green graph shows the +LIF conditions, and the blue graph shows the –LIF conditions. (E) Flow cytometry of PDX1. The graph represents the percentage of Pdx1-positive cells in the four culture conditions and negative controls, primary, and secondary antibodies. (A and E) *p < 0.05 statistically significant versus cells cultured in the presence of LIF, **p < 0.05 versus cells cultured in the presence and absence of LIF. +LIF: cells cultured in the presence of LIF; +LIFNO: cells cultured in the presence of LIF plus 500 μM DETA-NO; –LIF: cells cultured without LIF; –LIFNO: cells cultured without LIF plus 500 μM DETA-NO. In the four conditions, cells are cultured for 4 days and with DETA-NO for 19 h.
Impact of NO on the Epigenetic Changes of Pdx1 Promoter
To gain insight into the molecular processes involved in the effect of NO on Pdx1 expression, analysis of epigenetic changes occurring at the Pdx1 promoter region was undertaken. Three CpG islands were detected by Methyl Primer Express software (Thermo Fisher Scientific): (–2,000, −1,600), (–350, 650), (1,150, 1,650) bp from the translation start. We focused our study on islands dubbed distal CpG (–2,000, −1,600) and proximal CpG (–350, 650) since it has been reported that the three conserved and functionally important subdomains (areas I, II, and III) are localized between −2,800 and −1,600 11 , and it has been found that methylation of the Pdx1 proximal promoter (from −275 to +1 bp) is associated with Pdx1 silencing12,28 (Fig. 2A). Bisulfite sequencing PCR analysis shows methylation of 47 CpG sites, belonging to both proximal and distal CpG islands. DETA-NO treatment leads to enhanced methylation of CpG sites 8, 22, and 46, and demethylation of CpG site 40 in the presence or absence of LIF (Fig. 2B). The pyrosequencing study shows similar results, with the methylation level of the distal CpG island being higher than the methylation level of the proximal CpG island. The degree of distal CpG island methylation of cells cultured in the presence of LIF is lower than cells cultured in the absence of LIF. Exposure to DETA-NO leads to increased methylation that is similar to the methylation level of INS-1E cells. Regarding the methylation level of the proximal CpG island, cells cultured in the absence of LIF and with DETA-NO present a methylation pattern similar to that of INS-1E cells. This rat cell line was used as a positive control of Pdx1 expression 29 because they constitute a stable and glucose-responsive β-cell surrogate 30 . Twelve to 16 CpG sites were not analyzed in INS-1E cells because that region is not conserved between mice and rats (Fig. 2C).
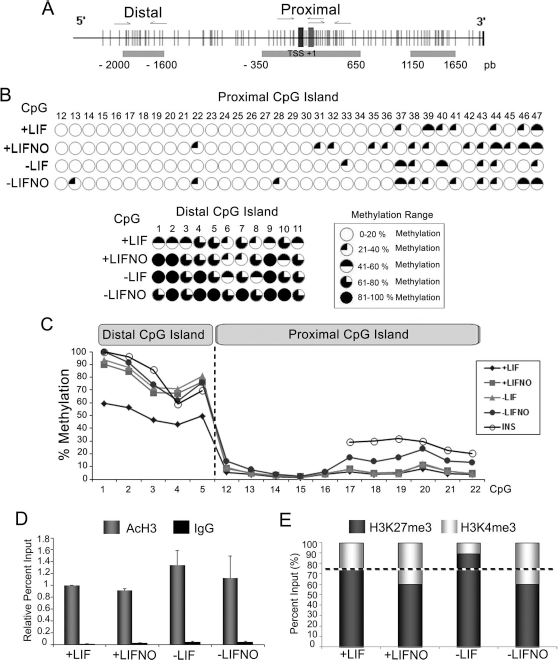
Analysis of epigenetic changes of Pdx1 promoter. (A) Pdx1 promoter scheme. This image shows the Pdx1 promoter and gene. Horizontal gray rectangles represent CpG islands, and vertical lines are the CpG sites. Vertical gray rectangles represent the transcription start (TSS) and the translation start (+1). The arrows represent the pairs of primers designed to amplify the regions of interest. (B) Methylation analysis of distal CpG island and proximal CpG island by BSP. It shows the CpG sites studied (distal CpG island and proximal CpG island). These sites are represented by circles: white circles, those CpG sites whose percentage of methylation is very low or even zero; black circles, those CpG sites whose methylation level is high or complete. Among them, there is a gradient of methylation that is shown in the inset of the image. (C) Methylation analysis of distal CpG islands and proximal CpG islands by bisulfite pyrosequencing. This graph represents the percentage of methylation of studied CpG sites. Diamonds: R1/E cells cultured in the presence of LIF. Squares: R1/E cells cultured in the presence of LIF plus 500 μM DETA-NO. Triangles: R1/E cells cultured in the absence of LIF. Full circles: R1/E cells cultured without LIF plus 500 μM DETA-NO. Open circles: INS-1E cells whose methylation level was used as control. (D) Analysis of acetylated H3 occupancy at Pdx1 by chromatin immunoprecipitation assay (ChIP). This graph represents ChIP analysis for acetylated H3 expressed as relative percent input (relativized to the condition favoring cell pluripotency) of three independent experiments. Data are mean ± SEM. (E) Stacked bars for bivalent mark dynamics of H3K27me3 and H3K4me3. They represent an average of three independent experiments. +LIF: cells cultured in the presence of LIF; +LIFNO: cells cultured in the presence of LIF plus 500 μM DETA-NO; –LIF: cells cultured in the absence of LIF; –LIFNO: cells cultured without LIF plus 500 μM DETA-NO. In the four conditions tested, cells are cultured for 4 days and with DETA-NO for 19 h.
On the other hand, histone marks in the proximal region of the Pdx1 promoter were studied by ChIP. Occupancy of acetylated H3 at the Pdx1 promoter was studied, and the results show that exposure to DETA-NO does not significantly affect acetylated H3 occupancy (Fig. 2D). By contrast, the occupancy ratio H3K27me3/H3K4me3 was affected by DETA-NO treatment, both in the presence or absence of LIF.
Role of PRC2 in the Regulation of Pdx1 Expression
To further investigate the mechanism underlying NO-induced decreases in H3K27me3 occupancy on the Pdx1 promoter, the expression and function of PRC2 proteins JARID-2 and EZH2 were studied. Results show that while EZH2 does not change its expression following NO treatment, JARID-2 expression is decreased, both at the mRNA and protein levels (Fig. 3A and B). To ascertain if PRC2 directly represses Pdx1 expression, JARID-2 occupancy at the Pdx1 proximal promoter was studied by ChIP. The result indicates that JARID-2 is released significantly from the Pdx1 promoter after DETA-NO treatment (Fig. 3C).

Studies on polycomb repressive complex (PRC2) in R1/E mESCs. (A) Study of PRC2 and P300 expression by real-time PCR. Values are normalized to the expression of β-actin and analyzed using the DDCt algorithm. It represents an average of three independent experiments. Data are mean ± SEM. The y-axis corresponds to relative expression level (fold change). (B) Study of PRC2 and P300 expression by Western Blotting. The image shown is representative of three independent experiments. β-Actin was used as a loading control. (C) Analysis of JARID-2 and P300 occupancy at Pdx1 proximal promoter by ChIP. Data are mean ± SEM of three independent experiments. The y-axis corresponds to relative percent input from undifferentiated cells. (D) Coimmunoprecipitation assay of JARID-2, EZH2, and P300. Three percent of total coimmunoprecipitated protein was loaded as input. Proteins not retained to complex agarose beads and Jarid-2 antibody were loaded as control of immunoprecipitation grade (Flow through). An immunoprecipitation with IgG antibody was developed as control of nonspecific binding (IgG control). (E) Pdx1 expression analysis by real-time PCR. Data are normalized to the expression values of β-actin, used as loading control and analyzed using the DDCt algorithm. Data are mean ± SEM of three independent experiments. The y-axis corresponds to relative expression level of Pdx1 (fold change). *p < 0.05 versus cells cultured in the presence of LIF, **p < 0.05 versus cells cultured in the presence and absence of LIF, ***p < 0.05 versus cells cultured in the presence of LIF plus 500 μM DETA-NO. +LIF: cells cultured in the presence of LIF; +LIFNO: cells cultured in the presence of LIF plus 500 μM DETA-NO; –LIF: cells cultured without LIF; –LIFNO: cells cultured without LIF plus 500 μM DETA-NO. In the four conditions cells were cultured for 4 days and with DETA-NO for 19 h.
Furthermore, we studied the contribution of histone acetyltransferase P300 to the regulation of Pdx1 expression. Thus, P300 expression was measured by qRT-PCR and Western blot, and the results indicate that P300 protein is decreased in cells treated with DETA-NO, although there is no change in its mRNA (Fig. 3A and B). In addition, P300 is also released significantly from the Pdx1 promoter after DETA-NO exposure and in the absence of LIF (Fig. 3C). In order to test the relevance of P300 in repressing Pdx1, DETA-NO-exposed cells were treated with the P300 inhibitor (P300i) and a synergistic effect of both molecules on Pdx1 expression was observed (Fig. 3E). Furthermore, ChIP studies corroborate that JARID-2 and P300 occupy the same region on the Pdx1 promoter. Finally, coimmunoprecipitation reveals that P300 interacts with PRC2 at the Pdx1 promoter region (Fig. 3D).
Optimized Protocol to Generate Insulin-Producing Cells
In view of the relevance of P300 on the regulation of Pdx1 expression, a modification of a protocol developed previously was implemented 6 . The modification consisted of the addition of P300i (C646) after treatment with valproic acid and before growth in suspension for 3 days (Fig. 4A). Cell morphology and fate were affected after every step of the protocol. Thus, exposure to DETA-NO led to substantial cell death, and the surviving cells acquired an epithelial morphology. Following exposure to valproic acid, groups of cells formed colonies with a round and shiny morphology, while others remained scattered and dull. Addition of P300i provoked considerable cell death, but surviving cells formed clusterlike structures. Finally, culture in suspension led to the formation of islet-like clusters (Fig. 4B). Analysis of expression markers revealed that DETA-NO treatment led to an increase in Pdx1, Nkx6.1, Nkx2.2, Ptf1a, and Glut2 mRNA (Fig. 4C and D). Interestingly, NO also increased pre-mRNA Ins1 levels (Fig. 4C). Valproic acid treatment enhanced the expression of definitive endoderm genes, including SRY (sex-determining region Y)-box 17 (Sox17), forkhead box A2 (FoxA2), HNF1 homeobox B (Hnf1b), and NK2 homeobox 2 (Nkx2.2). At day 10, there was a decrease in Pdx1 expression, which was recovered by exposure to P300i. Moreover, P300i also enhanced Pax4 expression. At the end of the differentiation protocol, markers of definitive endoderm (Sox17, Foxa2, and Hnf1b) and some markers of pancreatic progenitors (Pdx1, Pax4, Nkx6.1, Nkx2.2, Kir6.2, GcK, Ins1, and Glut2) were also upregulated (Fig. 4D). Cluster formation has been reported to improve long-term maintenance of human islets in vitro 31 and to increase the percentage of insulin-expressing cells in differentiation protocols 32 . Moreover, suspension culture enables uniformity of cellular composition, and pancreatic aggregates can be implanted without disrupting the maturing cellular architecture 33 . In our protocol, it is interesting to note that these cells were negative for Gcg, Amy2, and Sst (Fig. 4C). Immunofluorescence revealed that most cells expressed PDX1 and GLUT2, and some of them were positive for C-peptide (Fig. 5A).

Differentiation protocol to generate insulin-producing cells from mESCs. (A) Differentiation protocol scheme showing the culture conditions. (B) Bright-field images showing colony morphology of D3 mESCs during the differentiation protocol. Scale bars: 3,000 μm. (C) Qualitative analysis by RT-PCR for pancreatic markers for each step of differentiation protocol. Visc: embryo viscera, Panc: adult pancreas, Islets: mouse islets were used as a control. β-Actin was used as loading control cDNA. The image shown is representative of three to five independent experiments. (D) Quantitative analysis by real-time PCR for pancreatic markers. These values are normalized to the expression values ofβ-actin, used as loading control and analyzed using the DDCt algorithm. Data shown are mean ± SEM of three independent experiments. The y-axis corresponds to relative expression (fold change). *p < 0.05 statistically significant from the previous day of the differentiation protocol shown.
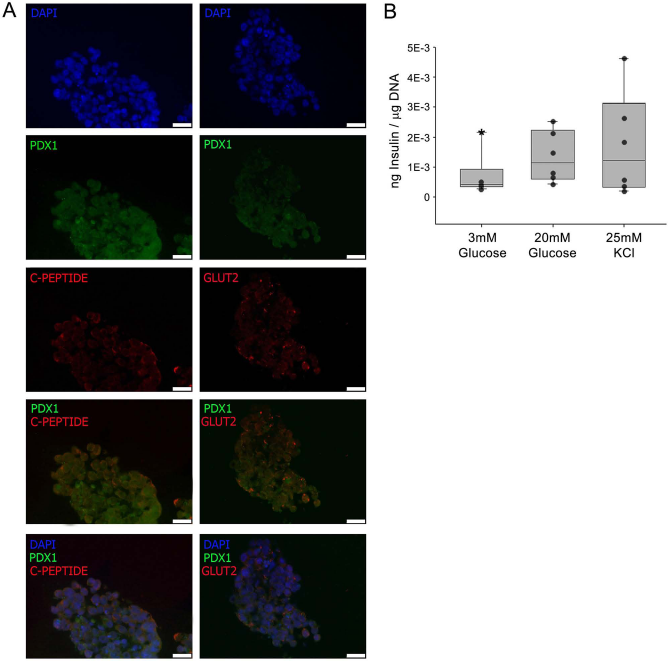
Islet-like clusters generated by differentiation protocol. (A) Immunofluorescence of islet-like clusters obtained by directed differentiation of D3 mESCs. Left: Immunofluorescence of DAPI (blue), PDX1 (green), and C-peptide (red). Right: Immunofluorescence of DAPI (blue), PDX1 (green), and GLUT2 (red). Scale bars: 25 μM. (B) Box and whiskers plot of secreted insulin from differentiated islet-like clusters from mESCs. Each black circle is the value for an experiment (n = 6). Insulin secretion (ng insulin/μg DNA) at 3 mM glucose ranged from 2.74E–4 to 2.15E–3 (*) and 4.31E–4 to 2.53E–3 at 20 mM glucose. At 25 mM KCl, the values ranged from 2.01E–4 to 4.61E–3. * denotes an outlier. The thick horizontal line denotes the median.
A key functional feature of β cells is the ability to release insulin in response to secretagogues. Cell clusters generated with the protocol reported here display responsiveness to both high glucose and KCl (Fig. 5B). A summary of the findings reported here on Pdx1 regulation and its contribution to the differentiation of mESCs into insulin-producing cells is shown in Figure 6.

Overview of Pdx1 regulation by NO and its contribution to the generation of insulin-producing cells from mESCs. (A) Pdx1 promoter in untreated mESCs and after NO treatment. In untreated mESCs, Pdx1 gene expression is repressed by PRC2, which leads to a high occupancy of H3K27me3. NO treatment causes the release of PRC2 and P300 from the Pdx1 promoter, thus allowing gene expression. Acetylation of H3 remains constant while minor changes in DNA methylation are produced. (B) NO treatment modifies the histone marks over the Pdx1 promoter. Exposure to DETA-NO (500 μM) decreases the ratio H3K27me3/H3K4me3. (C) Protocol for mESC differentiation into insulin-producing cells. NO treatment releases PRC2 from the Pdx1 promoter and Pdx1 is expressed. Expression of endoderm lineage genes (FoxA2, Sox17, and Hnf1β) is observed after valproic acid treatment. Thus, addition of valproic acid (HDAC-I inhibitor) allows that chromatin to remain open and helps to differentiate cells into pancreatic lineage cells. In a later stage, inhibition of P300 stimulates the expression of pancreatic progenitor markers such as Pdx1 and Pax4. Finally, culture in suspension allows the formation of islets-like clusters, thus enabling a stable expression of β-cell markers Pdx1, Nkx6.1, Glut2, and Ins1.
Discussion
Pdx1 is a transcription factor necessary for pancreatic development and β-cell maturation and exhibits a biphasic pattern of expression during pancreatic development 34 . An appropriate regulation of its expression might be instrumental for the generation of insulin-producing cells from pluripotent stem cells. The present study shows that exposure of mESCs to 500 μM DETA-NO leads to enhanced and transient expression of Pdx1. It has been previously reported that NO induces epigenetic changes such as DNA methylation 35 . In fact, methylation of the proximal CpG island of the Pdx1 promoter is associated with Pdx1 silencing in intrauterine growth retardation (IUGR)12,28. Therefore, we studied the methylation degree of the Pdx1 promoter by BSP and pyrosequencing. The studies show that the proximal CpG island represents less than 20% of overall methylation, while methylation of the distal island represents more than 60%. Methylation levels of both islands are slightly increased after NO treatment, despite the significantly increased expression of the gene. Thus, it is entirely possible that methylation of the Pdx1 promoter might represent a poised state of Pdx1 during differentiation of mESCs. On the other hand, methylation induced by NO treatment in mESCs is similar to the pattern observed in the glucose-responsive β-cell line (INS-1E). The fact that only conserved sequences in the promoter region undergo changes in the degree of methylation supports a possible role for this modification in the epigenetic regulation of Pdx1 gene expression. Furthermore, the level of methylation of the proximal promoter in undifferentiated mESCs reported here is in accordance with those reported in rodent models of IUGR, a condition associated with the onset of type 2 diabetes12,28. Factors other than methylation might control Pdx1 expression in ESCs. It has been reported that genes encoding key lineage-specific regulators are marked by both H3K4me3 and H3K27me3, creating a bivalent state in which genes are poised for future activation but remain inactive until the repressive mark is removed 36 . ChIP data reported here on H3K27me3 and H3K4me3 occupancy agree with studies on bivalency during pancreatic differentiation, in which H3K4me3 and H3K27me3 modifications were mapped in human embryonic stem cells (hESCs) at defined stages during pancreatic endocrine differentiation3,37. The balance in the occupancy of both marks at the Pdx1 promoter changes after treatment with NO. Thus, in the presence of LIF, NO increases H3K4me3 occupancy from 25% to 40%, and in the absence of LIF increases from 10% to 40%. These results are in agreement with other studies showing progressive decline in the H3K27me3/H3K4me3 occupancy ratio at the Pdx1 promoter during pancreatic development 23 . In the same light, acetylated H3 occupancy at the proximal Pdx1 promoter is not altered by NO treatment. The persistence of both AcH3 and H3K27me3 marks on the silent Pdx1 has been previously described in hepatoblasts24,38,39. It is possible that the presence of acetylated H3 at the Pdx1 promoter could also contribute to the poised state of this gene during early stages of pancreatic development.
It has been reported that removal of the polycomb group (PcG)-mediated repression on stage-specific genes is the key regulator during development 23 . PcG proteins have an important role in controlling the expression of genes essential for development, differentiation, and maintenance of cell fates14,31,40. In the present work, we studied the role of components of PRC2 on Pdx1 expression in mESCs. NO treatment decreases JARID-2 expression, which is essential for binding of the PRC2 to target genes in ESCs 18 . We report here that JARID-2 is found on the Pdx1 promoter in the presence of LIF and is released from the promoter after LIF withdrawal and NO treatment. mESCs contain high levels of JARID-2 protein that interact with and stabilize PRC2 at target genes17,18. We detected JARID-2/EZH2 complexes under conditions favoring cell pluripotency, thus suggesting that binding of the PRC2 complex on the Pdx1 promoter is involved in its repression. This finding is consistent with studies showing that JARID-2 and EZH2 are bound at the Pdx1 promoter in ESCs and that JARID-2 silencing allows higher Pdx1 expression and lower EZH2 occupancy17,24. It has also been reported that PRC2 regulates transcriptional repression by catalyzing the di- and trimethylation of lysine 27 on histone H3 (H3K27me2/3)20,41. In this regard, the studies shown here indicate that NO-driven release of JARID-2 is linked to changes in the H3K27me3/H3K4me3 balance at the Pdx1 promoter.
Moreover, it has been shown that P300 is necessary for acetylation of liver-specific regulatory elements and full liver-specific gene activation and that P300 modulates the specification of liver progenitors instead of pancreas progenitors 24 . Here we show that P300 occupancy represses Pdx1 expression in undifferentiated mESCs, and that during cell differentiation P300 is released from the Pdx1 promoter. Likewise, chemical inhibition of P300 leads to higher expression of PDX1 in cells cultured with LIF and DETA-NO when compared with cells cultured with LIF and DETA-NO. Moreover, pull-down experiments with JARID-2 and EZH2 show that P300 interacts with PRC2 complex in undifferentiated conditions. These results are in agreement with those from previous studies that showed that P300 can act as a repressor independently of its acetyltransferase activity25,26,42,43. Possible posttranslational modifications such as a SUMO-dependent repression 25 or recruitment of other repressive components such as HDAC6 or HDAC1 26 remain to be studied.
On the basis of the knowledge that P300 is a repressor of the Pdx1 gene and the mechanisms controlling the expression of Pdx1 in mESCs, a differentiation protocol was designed to generate insulin-producing cells. Previously, we reported the generation of definitive endoderm cells with a protocol consisting of sequential exposure to DETA-NO, serum withdrawal, and treatment with valproic acid 6 . The novel small molecule-based protocol presented here consists of five steps in which cells are differentiated toward functional insulin-producing cells in a full in vitro system. The expression of Pdx1 by removal of P300 repression is instrumental for the development of β-cell surrogates, and the combined use of small molecules such NO and valproic acid leads to sequential activation of signals relevant for induction of pancreatic lineage cells. The generation of cell aggregates with pancreatic progenitor cells at 11 days expressing Pdx1 and Pax4 prepared the cells for a consistent maturation step. At the end of the protocol (14 days), cells expressingβ-cell markers such as Pdx1, Nkx6.1, GcK, Kir6.2, Glut2, and Ins1 were capable of responding to secretagogues such as high glucose and KCl.
β-Catenin, activin/nodal, and bone morphogenetic protein (BMP) signaling pathways are known to have an important role during endoderm generation. Thus, activin A is used to activate nodal signaling, and Wnt activators or a BMP antagonist such as noggin is commonly used for definitive endoderm induction from human pluripotent stem cells44–46. Another key step is generation of functional hormone-secreting cells. A considerable number of molecules have been proven to be “maturation factors” such insulin-like growth factor 1 (IGF-1), exendin-4, hepatocyte growth factor (HGF), B27 supplement, betacellulin, or nicotinamide3,47,48. Relevant progress in the field has been reported by Rezania et al. 48 . They have generated in vitro functional β-like cells, which permanently reverse hyperglycemia when transplanted into diabetic mice. Alternatively, Pagliuca et al. have reported a strategy for large-scale production of functional human β cells from human pluripotent stem cells generating glucose-responsive and monohormonal insulin-producing cells 8 . The increasing number of protocols to generate β-cell surrogates from ESCs underscores the collective effort made over the past 10 years to generate efficient and reproducible methods to obtain fully responsive β cells in vitro. The findings reported here indicate that promoting the expression of Pdx1 by removal of PRC2 and P300 repression is instrumental for the development of β-cell surrogates. The combined use of small molecules such as DETA-NO, valproic acid, and P300 inhibitor leads to sequential activation of signals important for pancreatic lineage specification. Subsequent formation of cell aggregates enables the generation of glucose-responsive monohormonal insulin-producing cells. This protocol is a promising tool for efficient generation of β cells from pluripotent stem cells, but further testing is needed to determine whether these findings are also applicable for human stem cells.
Footnotes
Acknowledgments
This study was supported by grants from Consejería de Igualdad, Salud y Políticas Sociales, Junta de Andalucía (PI105/2010), and Consejería de Economía, Innovación, Ciencia y Empleo, Junta de Andalucía (CTS-7127/2011) to F. J. Bedoya; from Consejería de Igualdad, Salud y Políticas Sociales, Junta de Andalucía, ISCIII cofunded by Fondos FEDER (RED-TERCEL; Nos. RD06/0010/0025, RD12/0019/0028, and PI10/00964), Consejería de Economía, Innovación, Ciencia y Empleo (P10.CTS.6505), and the Ministry of Health and Consumer Affairs (Advanced Therapies Program Grant TRA-120) to B. Soria; from Consejería de Igualdad, Salud y Políticas Sociales (PI0022/2008) and from Consejería de Economía, Innovación, Ciencia y Empleo, Junta de Andalucía (PAI, BIO311) to F. Martín; and from Servicio Andaluz de Salud (SAS 11245) and Ministerio de Economía y Competitividad-Secretaría de Estado de Investigación Desarrollo e Innovación (IPT-2011-1615-900000) to J. R. Tejedo. The authors declare no conflicts of interest.