
Abstract
Islet transplantation is an effective therapy that allows the achievement of insulin independence in patients with type 1 diabetes (T1D). To ensure successful transplantation, islet viability and function are of great importance. Viability assessments most often use fluorescein diacetate (FDA)/propidium iodide (PI) staining. However, results using this method often do not correlate well with graft function. Because FDA nonspecifically penetrates all cells present in the islet preparation, including islets and contaminating acinar cells, its use often complicates viability assessments of the overall cell population. Furthermore, the manual method for determining viability percentages is highly subjective. Shortcomings of the conventional islet viability assay can be potentially improved by staining cells with Newport Green (NG). NG, is a zinc-specific fluorescent dye that specifically reacts with zinc-rich β cells. Two kinds of NG dyes, NG-DCF and NG-PDX, are currently available. We examined the zinc specificity of these NG dyes and compared NG staining with traditional FDA staining to explore the potential of NG dyes to improve islet viability assessment. Of the two NGs tested, NG-DCF showed the higher specificity toward a β-cell line as well as human islets. NG-DCF accurately identified the islet area, even in low-purity islets, while neither FDA nor NG-PDX did. Although NG-DCF staining required a longer incubation time, the addition of poloxamer F127 and incubation at 37°C allowed viability assessment to take place within 30 min. Unlike FDA/PI staining, NG-DCF/PI staining allowed for islet-specific assessment. We also introduced a semiautomated measurement to determine NG-DCF/PI staining results, which enabled us to obtain objective and reproducible results. NG-DCF/PI staining is easy and reliable, and this method permits highly objective islet-specific viability assessments.
Keywords
Introduction
Islet transplantation is an effective therapy to achieve insulin independence in type 1 diabetes (T1D) patients1,2. Islets are isolated from the pancreata of cadaveric organ donors and infused into the recipient liver through the portal vein2–4. A large islet number, high viability, and good functionality are important for achieving transplant success. The currently accepted method of assessing islet viability uses fluorescein diacetate (FDA), a cell-permeable esterase substrate, in combination with propidium iodide (PI), a viability probe that penetrates unhealthy/dead cells, to determine the percentage of live cells in an islet preparation 5 . However, several articles have demonstrated that the FDA/PI viability assay does not correlate well with posttransplantation graft function5–7. Although early islet damage, caused by inflammation and microenvironmental changes, may contribute to the poor correlation, the method used for determining islet viability is likely the major contributor. For example, FDA staining indicates intracellular esterase activity, but the stain cannot specifically label β cells. Because islet preparations contain substantial numbers of non-islet cells, such as acinar cells, the cell viability determined by the conventional FDA/PI method cannot accurately represent the viability of the islet cell population.
Newport Green (NG) is an uncharged fluorescent indicator of zinc and is currently available in a water-soluble and a cell-permeable ester form, which is hydrolyzed and remains in the cytoplasm after being taken into cells. Hydrolyzed NG has a specific binding capacity to zinc, but it is insensitive to Ca2+ or Mg2+, which are abundant in all cells. Thus, NG can be used to specifically detect changes in intracellular zinc concentrations8,9, especially in β cells, which have high zinc concentrations because zinc is required for insulin biosythnesis and maturation, as well as storage of insulin granules10,11. Therefore, NG is a particularly suitable β-cell/islet-specific detector that can be useful for evaluating islet purity and viability. Several fluorescent zinc detectors are commercially available that have various binding affinities to zinc. Among these zinc detectors, we selected two NG dyes with differing zinc binding capacities to evaluate as islet detectors in a modified viability assay. The performances of the NG dyes were compared to that of FDA.
Materials and Methods
Cell Culture
A human pancreatic cancer cell line, PANC-1, derived from pancreatic ductal cells, and a mouse β-cell line, nitrilase 1 (NIT-1), derived from mouse β-cell adenoma, were obtained from American Type Culture Collection (ATCC; Manassas, VA, USA) and cultured in Dulbecco's modified Eagle's medium (DMEM) (Gibco, Life Technologies, Grand Island, NY, USA) with 10% fetal bovine serum (FBS; Atlanta Biologicals, Lawrenceville, GA, USA) at 37°C in a tissue culture incubator under air plus 5% CO212,13. Cells (1 × 10⁵ per well) were seeded in a 96-well plate (Sarstedt, Newton, NC, USA) and maintained in culture until cells grew to 70% confluency, after which the cells were used for experiments.
Human Pancreatic Islets
Isolations of human islets were performed by the islet manufacturing team of the Southern California Islet Cell Resources Center (SC-ICRC) using their standard operating procedures and a modified automated method as previously described3,4. Briefly, the collagenase solution was injected through the pancreatic duct. The pancreas was loaded into the isolator to acquire the islet preparation, followed by the purification of islets. Islets approved for basic research were provided through the SC-ICRC distribution team. The use of all tissues in this study was approved by the Institutional Review Board (IRB) of Beckman Research Institute of City of Hope.
Culture of Human Islets and Non-Islet Tissues
Islets were cultured in Roswell Park Memorial Institute (RPMI)-1640 medium containing 5 mmol/L glucose (Hospira, Lake Forest, IL, USA) and 10% FBS at 37°C in an oxygen plus 5% CO2 incubator. The same culture condition was used for non-islet tissues.
Preparation of Hydrolyzed Fluorescent Dyes and Evaluation of Their Zinc-Binding Affinities
We obtained a zinc-free, pancreatic duct cell line, PANC-1, which we used to hydrolyze fluorescent dyes. PANC-1 cells were dissociated by 0.25% trypsin–ethylenediaminetetraacetic acid (EDTA; Life Technologies), and 2 × 10⁶ cells were placed in a 1.5-ml tube (USA Scientific Inc., Orlando, FL, USA) and incubated with NG-PDX (Life Technologies), NG-DCF (Life Technologies), or FDA (Life Technologies) solution for 1.5 h at 37°C to hydrolyze dyes. Concentrations of each fluorescent dye were 10 μmol/L, 20 μmol/L, and 250 nmol/L in phosphate-buffered saline (PBS; Mediatech, Manassas, VA, USA), respectively. To isolate hydrolyzed dyes from PANC-1 cell cytosol, 1 ml of radioimmunoprecipitation assay (RIPA) buffer (Sigma-Aldrich, St. Louis, MO, USA) was added; the mixture was then vortexed to lyse the cellular membrane, and clarified by centrifugation at 12,000 × g for 10 min to collect the supernatant containing the hydrolyzed dye. Hydrolyzed fluorescent extract (100 μl) was placed into each well of a 96-well plate containing ZnSO4 (Sigma-Aldrich) ranging from 0 to 100 μmol/L. The fluorescence intensity of each well was measured using a cellSens 1.12 platform (Olympus, Tokyo, Japan) under a fluorescence microscope (Olympus IX50). Fluorescence intensities were measured for each ZnSO4 concentration and used to calculate the zinc binding affinities for NG-PDX, NG-DCF, and FDA.
DTZ Staining
To evaluate the purity of human islets, dithizone (DTZ; Sigma-Aldrich) was added to a well of cells at a concentration of 3.12 mmol/L in PBS and incubated for 5 min. The cells were washed three times with PBS prior to imaging. Human islets [100 islet equivalent (IEQ)] were prepared for each staining. The DTZ-stained area was detected by a semiautomated method using cellSens to identify DTZ-positive structures. The total DTZ-stained cell cluster area was divided by the total cell cluster to determine the percentage of purity.
Staining by Fluorescent Dyes
To determine the optimal concentration of each dye, human islets were stained with three concentrations of NG and FDA dyes: 5, 10, and 20 μM for NG-DCF and NG-PDX, and 125, 250, and 500 nM for FDA. Five islets measuring 100-200 μm in diameter were placed in a 96-well plate and incubated with dye at room temperature (RT). The fluorescence intensity was measured at five time points between 5 and 60 min. The mean intensity was calculated by the cellSens software at each time point.
For other experiments, FDA solution was used at 250 nmol/L in PBS. NG-PDX and NG-DCF were reconstituted in PBS to final concentrations of 10 and 20 μmol/L, respectively. Incubation time varied depending on experimental objectives. Three washes with PBS were routinely performed before microscopic imaging. Micrographs were taken (IX50; Olympus) and analyzed by the cellSens software using the same setting for all studies. Objective lenses (20× and 4×) were used to image cell lines and islets, respectively. For evaluation, we captured multiple images of a total well, assembled a single image covering the entire well using the software, and then measured the area that was positively stained as indicated by green fluorescence (NG-PDX, NG-DCF, and FDA).
Preparation of Human Islets
We obtained high-purity islets and non-islet tissues from the same pancreas. Non-islet tissue was obtained from the bottom of the COBE cell processor bag (Terumo BCT, Lakewood, CO, USA) after the islet layers were removed. Islets were combined with non-islet tissues to give final purities of 30 and 80%. The purity of the sample was measured by DTZ staining, as described above. Cell clusters (50–100) containing islets and non-islet tissues were placed in wells of a 96-well plate and exposed to an NG dye. The NG-DCF or NG-PDX positively stained area was measured first, and then FDA was added to the same well to measure the FDA-positive area. This procedure allowed for assessing the ratio of NG to FDA-positive staining within the same islet preparation. The NG-positive area was expressed as the relative value (%) to the FDA area (Area_NG/Area_FDA × 100).
Optimization of NG-DCF Staining Using Poloxamer F127 and Warm Incubation
A longer incubation time is generally used for NG-DCF staining than for FDA. To reduce the incubation time, human islets were incubated under two different temperatures (RT or 37°C) with and without poloxamer F127 (Life Technologies). The concentration was 20 μmol/L for NG-DCF and 0.2% (v/v) for F127 in PBS. Five islets measuring 100–200 μm in diameter were selected and placed in each well of a 96-well plate and imaged to assess the fluorescence intensity. The mean intensity was calculated using cellSens software at each time point during the 10- to 90-min incubation. The mean fluorescence intensity of the control group (RT without F127) at 60 min was defined as baseline, and the intensity measured for each time point was expressed as a normalized value to the control intensity.
In addition, we performed an independent experiment to compare the fluorescence intensities between islets and non-islets exposed to 0.2% F127 and incubated at 37°C. After 30 min of incubation, the intensity of 10 islets and non-islet structures was measured by cellSens. A boxplot was used to demonstrate the distribution of measured intensities, including the interquartile range (IQR) and median.
Assessment of Islet Viability
Islet cell viability of the same test sample was assessed by FDA/PI and NG-DCF/PI staining. Islet suspensions containing 100 IEQ were plated in wells of a 96-well plate. Islet purity was determined by DTZ staining as described above. NG-DCF and PI were added to each well in the following sequence: islets were first incubated in NG-DCF (20 μmol/L) containing 0.2% (v/v) F127 for 30 min at 37°C, followed by PI (15 μmol/L) for 5 min, and finally washed three times with PBS before the microscopy analyses. The analysis was performed using the software (cellSens) to capture multiple images covering the entire area of the well. Images were assembled, and the software was used to automatically recognize the NG-DCF-positive area. The software also automatically measured the PI-positive area within the NG-DCF-positive area to calculate the percent viability of the entire islet sample. The percent viability of the islet sample was calculated as follows: Viability (%) = 100 – [(Area_PI in Area_NG/_Area_NG) × 100]. The islet viability measured by FDA/PI was determined as follows: Viability (%) = 100 – [(Area_PI in Area_FDA/Area_FDA) × 100]. Experiments were performed in triplicate using the same batch of human islets and repeated with five independent batches.
Statistical Analysis
Data are reported as median ± IQR. Statistical analysis was performed using JMP 9 (SAS Institute, Cary, NC, USA). A nonparametric Wilcoxon test was performed for statistical comparison. A value of p < 0.05 denotes statistical significance.
Results
The Fluorescence Intensity of NG, But Not FDA, Specifically Reports Zinc Concentration
To determine if there was a difference in the zinc binding properties of NG and FDA, their fluorescence intensities in response to concentrations of ZnSO4 ranging from 0 to 100 μmol/L were examined (Fig. 1). NG fluorescence intensified as the zinc concentration increased, whereas FDA fluorescence intensity was not altered in response to varying ZnSO4 concentrations. These results clearly indicate that NG can specifically detect cells containing zinc.

Fluorescence intensity of Newport Green (NG) correlates with the zinc concentration. (A) Representative images showing the fluorescence staining of wells containing three different doses of zinc (ZnSO4). The fluorescence of hydrolyzed NGs gradually increased as zinc concentration increased, but that of fluorescein diacetate (FDA) remained unchanged. (B) Increased fluorescence intensity displays a positive correlation to the zinc concentration for NG, but not FDA. Values were obtained from independent experiments done in triplicate. Error bars indicate one standard error.
Slow But Concentration-Dependent Response of NG-DCF to Human Islets
The islet fluorescence intensity–time curve revealed the distinct properties of each dye (Fig. 2A). All three dyes elicited stronger fluorescence as their concentration increased. However, the time required to reach the maximum intensity was significantly different among the three. NG-DCF responded slowly and did not reach the plateau within 60 min. In contrast, the intensities of NG-PDX and FDA rapidly increased and plateaued within 20 min. FDA showed stronger fluorescence intensities, even at lower concentrations, as compared to the NGs. The intensity of islets stained by 20 μM NG-DCF after 60 min was lower than that of NG-PDX or FDA. However, the intensity was sufficient to detect and measure the positive area by cellSens (Fig. 2B, upper). We noted that the cellSens software tended to overestimate the area marked by fluorescence. As a result, the area used for analysis (Fig. 2B, right panel) was larger than the actual islet area (demarcated by a broken line in Fig. 2B, lower), leading to a misinterpretation of the positive area. A strict incubation time can ensure a consistent measurement by minimizing variability in fluorescence intensity changes, which depend partially on the incubation time.

Slow but concentration-dependent response of NG-DCF to human islets. (A) Human islets were incubated with different concentrations of dyes. Fluorescence intensity was measured four times over 60 min and plotted. Fluorescence intensity correlated with the concentration of dyes. Intensity of NG-DCF slowly increased and plateaued within 60 min, while NG-PDX and FDA intensities rapidly increased and plateaued within 20 min. The intensities were normalized to the intensity obtained with 20 μM NG-DCF after a 60-min incubation. Error bars indicate one standard error calculated from five independent experiments using human islets isolated from the same pancreas. (B, upper row) After a 60-min incubation, the fluorescence intensity of islets stained by 20 μM NG-DCF was sufficient to be detected by cellSens. (B, lower row) The cellSens software tended to overestimate the fluorescent area when fluorescence was brighter. The area analyzed by software was larger than the actual area demarcated by a broken line (right panel). Scale bar: 100 μm.
NG-DCF Has Greater Specificity Than NG-PDX for Staining Zinc-Containing Cells as Well as Human Islets
To show that NG specifically stains zinc-containing cells, we used two types of cell lines (NIT-1 and PANC-1). NIT-1 cells, derived from pancreatic β cells, are abundant with zinc and insulin granules 12 . On the other hand, PANC-1 cells, derived from pancreatic duct epithelial cells, are zinc free 13 . As expected from the previous results (Fig. 1), FDA stained both NIT-1 and PANC-1 cells (Fig. 3A). In contrast, NG-DCF only stained NIT-1 cells; we did not observe any positively stained PANC-1 cells. However, some positively stained PANC-1 cells were found after NG-PDX treatment.

High specificity of NG-DCF for a cell line containing zinc and human islets. (A) NIT-1 and PANC-1 cells stained by FDA, NG-DCF, and NG-PDX. FDA detected all cells from both the NIT-1 (zinc-containing) and PANC-1 (non-zinc-containing) lines. In contrast, NG-DCF clearly distinguished between NIT-1 and PANC-1. NG-PDX showed some positive staining in PANC-1. Fluorescence intensity was analyzed using the same threshold for each dye. Scale bars: 50 μm. (B) Human islets and non-islet tissues were stained with NG-DCF, NG-PDX, FDA, and DTZ. DTZ stain (bottom row) confirmed positive (red) versus negative stain. FDA did not discriminate islets from non-islet structures. The fluorescence intensity of NG-DCF showed a clear difference between islets and non-islet structures. NG-PDX detected false-positive structures in the non-islet tissues. Scale bars: 200 μm.
Next, we examined the staining characteristics of NG-DCF and NG-PDX in human islets and non-islet pancreatic cell clusters (Fig. 3B). Human islets were confirmed to have positive staining by DTZ, while non-islet cell clusters did not. FDA stained all cell clusters in the islet samples and did not discriminate between islet and non-islet cells. The fluorescence intensity of NG-DCF staining showed a clear difference between islets and non-islet cells. Similar to the results obtained with the cell lines (Fig. 3A), NG-PDX detected many false-positive structures in non-islet tissues, although the staining was ambiguous and had relatively low intensity. These results indicate that NG-DCF is a more appropriate and reliable fluorescent dye than NG-PDX for detecting β cells and islets because of a very low false-positive rate.
NG-DCF Accurately Detects the Islet Area Irrespective of Islet Purity
To confirm that the NG dyes can specifically identify islets regardless of their purity, we prepared low- (30%) and high-purity (80%) islet samples based on DTZ staining (Fig. 4A). The area positively stained by the NG dyes was significantly smaller in the low-purity islets as compared to that stained by FDA, again indicating that FDA detects islets as well as non-islet tissues (Fig. 4B). More importantly, the percentage of NG-DCF staining was nearly identical to DTZ staining, demonstrating that NG-DCF accurately identifies zinc-positive structures, specifically islets. In contrast, the percentage of NG-PDX staining did not closely reflect the staining measured by DTZ. However, the NG-PDX-stained area was smaller than that stained with FDA in low-purity islet preparations.
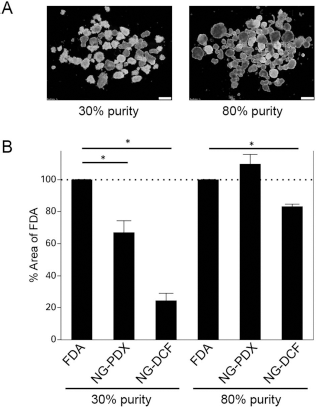
NG-DCF-positive area accurately corresponds to the islet area. (A) Low- (30%) and high-purified (80%) islets were prepared from the same islet lot and stained with DTZ. Scale bars: 200 μm. (B) Both islet preparations were stained with FDA, NG-PDX, or NG-DCF, and the stained area was measured. For the low-purity islets, the positive areas detected by NGs were significantly smaller than those detected by FDA. The positive area detected by NG-DCF was nearly identical to that measured by DTZ staining. Error bars indicate one standard error from three independent experiments using samples isolated from the same pancreas.
Addition of F127 and Incubation at 37°C Curtail the Evaluation Time
Compared to FDA, NG staining requires a longer incubation time to obtain sufficient fluorescence intensity for analysis 14 . In addition, NG-DCF stains human islets slower than NG-PDX (Fig. 2A). This may lead to misinterpretation if the fluorescence response is read prematurely. The fluorescence intensity analyzed in Figure 2, obtained after a 60-min incubation at RT, was defined as 100% in this study (Fig. 5A). The fluorescence of human islets was measured at RT and 37°C with or without poloxamer F127, which enhances the penetration of dye into the cells. The fluorescence intensity of islets incubated at 37°C was significantly higher throughout the experimental period as compared to those incubated at RT. The addition of F127 further increased the intensity, especially after a 90-min incubation. Furthermore, we observed a synergistic effect of 37°C incubation and the inclusion of F127, which increased the fluorescence intensity to twice the level of the controls (Fig. 5A). Human islets incubated with F127 at 37°C developed a fluorescence intensity strong enough for assessment by microscopy in less than 30 min, whereas the control islets incubated at RT without F127 required a 60-min incubation before we could perform an accurate examination. Incubation with F127 at 37°C provided clearer images, allowing us to more accurately evaluate the positive islet area (Fig. 5B). This also allowed us to accurately distinguish the islets from non-islet structures. Representative examples are shown in Fig. 5C (fluorescence intensity) and 5D. The boxplot shows the distribution and intensity differences among 10 randomly selected islets and 10 non-islet clusters (Fig. 5D). The threshold between the lower fence of the islets (I) and the upper fence of the non-islets (N) clearly separates islets from non-islet structures (Fig. 5D).

Addition of F127 and incubation at 37°C curtail the time required for evaluation. Fluorescence intensity of NG-DCF/PI-stained human islets was measured after incubation periods between 10 and 90 min at different temperatures with or without F127. Each test used five human islets measuring 100–200 μm in diameter. (A) Incubation at 37°C with F127 showed a synergistic effect that increased the fluorescence intensity of islets, resulting in a shorter time required for before examination. Error bars indicate one standard error (*p < 0.05 vs. RT control). Fluorescence intensity of the control (RT without F127) at 60 min was defined as 100% intensity. (B) Representative photographs of islets after a 90 min-incubation with or without F127. Scale bars: 200 μm. (C) Representative images of islets and non-islet tissues with their absolute intensities measured by cellSens. Scale bars: 100 μm. (D) Ten islets and 10 non-islets were randomly selected, and the absolute intensity was analyzed. The boxplot shows the distribution and difference of absolute intensities between islet and non-islet tissues. The gray box shows the interquartile range (IQR). The white horizontal line indicates the median. The threshold between the lower fence of islet (I) and the upper fence of non-islet (N) can separate islets from non-islet structures.
Islet Viability Assessment Using the Optimized NG-DCF/PI Staining
Representative images of FDA/PI and NG-DCF/PI staining are shown in Figure 6C–F and Figure 6G–J, respectively. Prior to the viability assay, we used DTZ staining and light microscopy to confirm islet purity (Fig. 6A). DTZ-positive structures were labeled purple after analysis by cellSens (Fig. 6B), and the purity was determined to be 72.0%. The percent viability was analyzed by identifying the FDA-positive area (Fig. 6D, blue), NG-DCF-positive area (Fig. 6H, blue), and PI-positive area (Fig. 6E and I, pink). For the NG-DCF/PI sample, PI-positive structures were also found in the unstained area outside of the islets (Fig. 6G–J, solid arrows), indicating the presence of dead cells in the non-islet tissues, which should not be included in “islet viability.” Because the NG-DCF-positive area contained an islet-specific area (Fig. 6H), we were able to measure the PI-positive area in only that region to obtain a true “islet viability” (Fig. 6J). In Figure 6J, the PI-positive area outside the islets was eliminated from the measurement (solid arrows). On the other hand, FDA/PI measured the viability of all structures present, including non-islet clusters (Fig. 6F).

Representative images of NG-DCF/PI and FDA/PI staining. (A) Fifty IEQ were stained by DTZ to assess purity prior to the viability assays (light microscopy). (B) Analysis by cellSens to detect the DTZ-positive area was used to calculate purity (cellSens image under light microscopy). (C) An islet suspension containing 100 IEQ was placed in wells of a 96-well plate, stained with FDA/PI, and the image of the entire well was captured and assembled. The image was processed to determine the (D) FDA-positive area and the (E) PI-positive area. (F) The PI-positive area inside the FDA-positive area was calculated to assess viability. (G) Islet suspension containing 100 IEQ in a single 96-well stained with NG-DCF/PI. The image was processed to measure the NG-DCF-positive area (H) and the PI-positive area (I). (J) The PI-positive area inside the NG-DCF-positive area was calculated to assess viability to calculate “islet viability.” PI-positive cells in non-islet tissues (solid arrows) were eliminated in this process. Scale bars: 1 mm.
Discussion
Islet transplantation has been recognized as a safe and effective treatment for T1D 1 . To achieve success, it is critical that highly viable islets in sufficient numbers be available for transplantation. Islet viability has been assessed using several fluorescent viability methods1,15.
A membrane-permeable ester form of NG is commercially available and can serve as a molecular probe to specifically detect zinc-containing cells. An acetoxymethyl (AM) group is chemically added to assist in NG penetration through the cell membrane. A water-soluble form of NG is also commercially available. Similar to PI, it cannot permeate intact cells because it lacks a lipophilic component. Therefore, it can only be used to detect damaged cells 16 , which release zinc from their cytosol during cell death. Because of this, a membrane-permeant ester form of NG must be used to detect viable β cells.
We have confirmed that FDA does not detect zinc, whereas both NG-PDX and NG-DCF do (Fig. 1). The shapes of the NG curves produced in response to different concentrations of ZnSO4 indicated the suitability of NG dyes for islet detection, in particular NG-DCF, which can detect lower concentrations of zinc than NG-PDX. NG-PDX showed a more pronounced linear increase of fluorescence intensities to zinc concentrations than did NG-DCF (Fig. 1B); however, NG-DCF produced fewer false positives when used to detect zinc-positive structures. These results may indicate that factors other than zinc concentration may be involved, such as differing affinities to zinc, although possible additional mechanisms were not investigated in this study.
We analyzed the fluorescence intensity and incubation duration for each dye at different concentrations (Fig. 2A). In the conventional assay, viability is manually assessed. This is a highly subjective process and may produce great variability depending on the technician. We believe that a standard procedure should be established to assess islet viability using an optimal dose of NG-DCF, incubation conditions, and appropriate software for objective determination of live and dead islets and cells. For example, without a standardized procedure, complications occur if the fluorescence intensity is too strong because of a longer incubation time and/or higher concentration of dyes (Fig. 2B). On the other hand, if the incubation time is insufficient, the fluorescence intensity may be too weak in the central portion of the islet (specifically with NG-DCF), leading to misinterpretation of the islet area and miscalculation of viability (data not shown). We found that 20 μM NG-DCF is optimal for islet detection and provides sufficient fluorescence after a 60-min incubation at RT (Fig. 2). However, this incubation time may be too long and not suitable for all cases.
To confirm the ability of NG dyes to detect islets, we prepared high- and low-purity islet samples using the same islet lot (Fig. 4A). Because FDA detects all viable islets and non-islet tissues (Fig. 3B), we calculated the ratio of the NG-positive area to the FDA-positive area by staining the same islet sample using both dyes. By comparing the results to those obtained from DTZ staining, we found that only NG-DCF accurately identifies islets in both low- and high-purity islet preparations (Fig. 4B). These results suggest that assessing viability using FDA/PI or NG-PDX/PI does not show the true islet viability. Because cell survival and metabolism during pancreas procurement differ between islets and non-islet cells 17 , cell viability obtained from the whole islet sample, a mixture of islets and non-islet cell clusters, is not a measure of true islet viability.
One drawback to NG-DCF is that it requires a longer incubation time than FDA and NG-PDX (Fig. 2A). However, the use of poloxamer F127 and incubation at 37°C can shorten the evaluation time to 30 min (Fig. 5A), possibly by reducing the time required to hydrolyze NG. F127 is a nonionic surfactant that assists penetration of AM esters into cells. A low dose of F127 [0.1–0.15% (v/v)] was safely added to islets, as well as a β-cell line14,18, but in these studies, the effect on fluorescence was not quantified. We showed that 0.2% F127 enhances fluorescence intensity. With regard to toxicity, F127 has been added to cell encapsulation materials in amounts as high as 5% (w/w) of the concentration and did not influence cell viability for incubation times up to 5 days 19 . Therefore, the use of 0.2% F127 should be acceptable in the viability assay. We also recognized that the incubation time should be identical between assays to ensure consistent data collection and a fair analysis. This is because (1) the NG-positive area can increase as the incubation time is prolonged, and (2) the evaluation is performed before the fluorescence intensity reaches a plateau, which takes more than 90 min. Thus, a longer incubation time increases the intensity of NG staining (Figs. 2B and 5A).
Assessment of islet viability using NG-DCF/PI uses a microscopic photography software to assemble an entire 96-well image so that all the cell structures are evaluated using the same intensity threshold (Fig. 6). Islet viability is determined by relying on an automated measurement, thereby avoiding any subjective decisions. Detection of “double-positive” areas stained by NG-DCF and PI is also possible using the same software. Accurate viability is often difficult to measure by manually examining a small number of islets, but we found that the automated method can assess the viability with high accuracy and reproducibility regardless of sample volumes. A similar automated procedure can be applied to evaluate islet purity using DTZ staining 20 .
An important feature of the current NG-DCF/PI viability assessment is that we can measure islet-specific viability (not overall cell sample viability) by measuring the PI-positive area within the NG-DCF-positive area, excluding the PI-stained area of non-islet tissues. If all β cells in an islet are dead, the NG stain does not show any green color. In theory, dead or injured non-β cells in the islet show red fluorescence for PI but not green fluorescence under NG/PI staining. NG staining is used to identify islets, which are an assembly of β cells and many other cells. This is because we rarely see islets with any green fluorescence under the normal viability testing. On the other hand, it is not unusual to find islets in the central lesion that weakly respond to FDA or NG staining. This perhaps indicates either islet central necrosis or insufficient time for the dye to penetrate into the islet core. However, even with weaker staining at the core, the islets are identified by the fluorescence from viable β cells located close to the islet surface (Fig. 5D). A previous report showed the importance of β-cell-specific viability as assessed by NG-PDX, in which the rate of successful islet transplantation is related to the β-cell content and fractional viability in a mouse model 15 . The investigators used NG-PDX to fractionate β cells through a flow cytometry-based method. Relatively large numbers of islets (1,000–1,500 IEQ) were needed. These islets required special sample preparation to make single cell suspensions, and fixation by paraformaldehyde was also needed prior to sorting. On the other hand, our method is quite simple; we just add NG-DCF instead of traditional FDA. The number of islets needed for this method is also quite flexible.
The combined NG-DCF/PI staining, together with the automated counting method, minimizes the ambiguity of conventional islet viability assessment. Because of its objectivity, the NG-DCF/PI method is suitable for cross-sectional studies and the accumulation and comparison of data without bias. This assay may provide an opportunity to reevaluate the correlation between islet viability and islet transplantation outcome5–7. Further analysis to compare the FDA/PI and NG-DCF/PI approaches is ongoing and will clarify the relationship between islet-specific viability and islet transplant outcome.
The fluorescence intensity measured in the method described herein is not quantitative, but qualitative. Therefore, an intensity threshold for the NG and PI stain must be established to distinguish positive versus negative staining. Because the NG staining intensity reflects the zinc concentration in β cells, NG-DCF staining may also reflect islet function10,11,21.
Footnotes
Acknowledgments
This work was supported by a grant from the Nora Eccles Treadwell Foundation. Supplying of human islets was supported by the Integrated Islet Distribution Program (IIDP). We acknowledge the Manufacturing Team led by Dr. Ismail Al-Abdullah at the Southern California Islet Cell Resources Center, Beckman Research Institute of City of Hope for the preparation of islets and non-islet pancreatic cells. We also thank Dr. Chia-Hao Wang for assistance with statistical analyses, and Chris Gandhi, Ph.D., and Keely Walker, Ph.D., for critical reading and editing of the manuscript. The authors declare no conflicts of interest.