
Abstract
Induced pluripotent stem cells (iPSCs) are pivotal to the advancement of regenerative medicine. However, the low efficacy of iPSC generation and insufficient knowledge about the reprogramming mechanisms involved in somatic cell/adult stem cell reversion to a pluripotent phenotype remain critical hurdles to the therapeutic application of iPSCs. The present study investigated whether the concentration of fetal bovine serum (FBS), a widely employed cell culture additive, can influence the cellular reprogramming efficacy (RE) of human adipose-derived stem cells (hADSCs) to generate iPSCs. Compared with the typically employed concentration of FBS (10%), high concentrations (20% and 30%) increased the RE of hADSCs by approximately twofold, whereas a low concentration (5%) decreased the RE by the same extent. Furthermore, cell counting kit-8 (CCK-8), bromodeoxyuridine (BrdU) incorporation, and fluorescence-activated cell sorting (FACS) assays showed that hADSC proliferation during reprogramming was significantly enhanced by FBS at 20% and 30%, whereas quantitative polymerase chain reaction (qPCR) and Western blotting assays revealed a concomitant decrease in p53, p51, and p21 expression. In addition, the efficacy of retrovirus-mediated transduction into hADSCs was increased by approximately 10% at high concentrations of FBS. It was confirmed that platelet-derived growth factor in the FBS enhanced proliferation and reprogramming efficacy. Finally, the generated iPSCs showed a normal karyotype, the same fingerprinting pattern as parental hADSCs, a genome-wide transcriptome pattern similar to that of human embryonic stem cells (hESCs), and in vivo pluripotency. In conclusion, the current investigation demonstrated that high concentrations of FBS can modulate molecular and cellular mechanisms underlying the reprogramming process in hADSCs, thereby augmenting the cellular RE for iPSC generation.
Keywords
Introduction
Induced pluripotent stem cells (iPSCs) display similar properties as embryonic stem cells (ESCs) (38,39,44), including the ability to propagate indefinitely and to give rise to multiple cell types. However, iPSCs are established from adult rather than embryonic tissues by introducing pluripotency-related/reprogramming genes into adult somatic cells or partially differentiated stem cells. These genes correspond to factors such as octamer-binding transcription factor 4 (Oct-4), sex-determining region Y (SRY)-box 2 (Sox-2), Kruppel-like factor 4 (Klf-4), and c-Myc. Together, these four factors are known as the OSKM quartet.
Diverse methodologies have been developed for the generation of iPSCs, including the introduction of various combinations of reprogramming genes into parental cells (16,23), as well as selected nucleic acids (4,26,41), proteins (15,46), and small-molecule compounds (11). The introduction of proteins and small-molecule compounds versus pluripotency-related genes is considered preferable in terms of safety, mass production, and standardization. However, the production of iPSCs using proteins shows extremely low reprogramming efficacy (RE) because proteins cannot sufficiently activate inflammatory pathways (such as that mediated by toll-like receptor 3) to initiate reprogramming (18). Moreover, the use of small-molecule compounds to replace transcription factors is currently limited to mouse cells and is further hindered by low reproducibility (11).
Together with safety issues, a high RE is crucial to the success of future therapeutic applications employing iPSCs. Therefore, researchers have undertaken a number of approaches to overcome the low efficacy of reprogramming. These approaches encompass the reprogramming of amenable cells, such as human umbilical vein endothelial cells (HUVECs) and keratinocytes (1,29,35,36); the genetic control of tumor-suppressor genes, including phosphatase and tensin homolog (PTEN) and p53 genes (5,10,14,21,22,25); the genetic control of cell–cell interactions involving E-cadherin (8) and other cell adhesion molecules; the reprogramming of parental cells under hypoxic conditions (7,43); and the sorting of reprogramming-prone cells [e.g., stage-specific embryonic antigen (SSEA)-3-positive cells] prior to induction (6). Furthermore, Rais et al. (30) reported that mouse blood and skin cells can be reprogrammed into iPSCs with approximately 100% efficacy following the silencing of the Mbdp gene, which apparently represses pluripotency. However, the investigators used mouse cells that were already genetically modified with OSKM, and the results have not yet been confirmed in human cells.
Various easy, straightforward, and feasible approaches have been carried out to increase the RE in both mouse and human cells by utilizing a combination of pluripotency-related/reprogramming genes together with small-molecule reprogramming enhancers [e.g., vitamin C (9), the histone deacetylase inhibitors, trichostatin A and valproic acid (12,13), butyrate (24), and the putative DNA methyltransferase inhibitor, RSC-133 (19)]. These reprogramming enhancers mainly correspond to synthetic small molecules that are selected on the basis of high throughput screening of chemical libraries (19). However, many of the so-identified small molecules are associated with potential health concerns. For example, trichostatin A reportedly increases the risk of teratogenicity in vertebrate embryos (37). Therefore, adequate time and sufficient testing are required to guarantee the safety of the synthetic compounds used for reprogramming and the generated iPSCs prior to clinical applications.
Significant correlations were recently demonstrated between cellular RE and 1) the cell proliferation rate, 2) the activity of p53 and p21 tumor-suppressor genes in the parental cells, and 3) the retrovirus-mediated transduction efficacy of genes used for reprogramming (7,10,31). For example, blockade of G1/S cell cycle transition via inhibition of the cyclin D2 and cyclin E1 genes resulted in a significantly decreased cellular RE (31), signifying that the G1/S cell cycle transition decisively participates in cell reprogramming. On the other hand, cellular RE was appreciably increased by short hairpin RNA (shRNA)-mediated inhibition of p53 gene expression (10), and high RE was also achieved by high transduction efficacy of reprogramming genes (7).
Fetal bovine serum (FBS) is widely used as a universal and representative additive for the culture of countless types of primary and immortalized cells. The precise composition of FBS is unknown because this additive comprises various unidentified, naturally occurring small molecules and proteins in fluctuating proportions (45). Nevertheless, cell culture medium containing FBS has been approved for the safe expansion of human ESCs (hESCs) and iPSCs for eventual use in human clinical trials (34). The current study therefore explored the impact of FBS concentration on the RE of human adipose-derived stem cells (hADSCs) to generate iPSCs. We found that specific molecular and cellular mechanisms underlying the reprogramming process (i.e., hADSC proliferation, tumor-suppressor and apoptotic-regulator expression, and reprogramming gene transduction efficacy) could be controlled by adjusting the concentration of FBS in the culture medium.
Materials and Methods
Culture of hADSCs and Oct-4-GFP Mouse Embryonic Fibroblasts (MEFs)
hADSCs were isolated from adipose tissues of participants, who provided written informed consent for this study, under GMP conditions in the CHA Stem Cell Institute with approval from Institutional Review Board (IRB) of the CHA University Hospital Ethics Committee. hASDCs were isolated from adipose tissue according to a previously described method with minor modifications (17). In brief, adipose tissues [#1: age 73, male (osteoarthritis patient); #2: age 50, female (abdomen liposuction)] were washed with Dulbecco's phosphate-buffered saline (DPBS) (HyClone, Logan, UT, USA) and minced with scissor. Minced adipose tissues were treated with 2 mg/ml type II collagenase (Life Technologies, Grand Island, NY, USA) during 1 h at room temperature (RT). Dissociated cells were cultured with Dulbecco's modified Eagle medium (DMEM; Life Technologies) supplemented with 10% fetal bovine serum (FBS; Wisent, St-Jean-Baptiste, Quebec, CA), 1× penicillin/streptomycin (Life Technologies), and 1× β-mercaptoethanol (Life Technologies) under 37°C, 5% CO2, and 20% O2 conditions. Original male and female Oct-4-green fluorescent protein (GFP) mice were purchased from Jackson Laboratory (Bar Harbor, ME, USA). Oct-4-GFP mouse embryonic fibroblasts (MEFs) were prepared by primary culture of day 13.5 embryos in the uterus without separation between embryos. Primary cultured Oct-4-GFP MEFs were kindly provided by Dr. K. S. Park (CHA University, Gyeonggi-do, Korea). The cells were maintained using the same methods as hADSCs.
Retrovirus Production and Concentration
GP2-293 packaging cells (Clontech Lab, Palo Alto, CA, USA) were plated 1 day before transfection. When cells were 70–80% confluent, pMXs-hOCT3/4 (Addgene, Cambridge, MA, USA), pMXs-hSOX2 (Addgene), pMXs-hKLF4 (Addgene), and pMXs-hc-MYC (Addgene) (OSKM) and VSV-G vector (Invitrogen, Carlsbad, CA, USA) were cotransfected using Convoy transfection reagent (ACTGene Inc., Piscataway, NJ, USA). Seventy-two hours after transfection, culture supernatant was collected and filtered through a 0.45-μm filter (Millipore, Billerica, MA, USA). Filtered supernatant was ultra-centrifuged (70,000 × g, 4°C, and 150 min) (Beckman Coulter Inc., Fullerton, CA, USA) for concentration. The concentrated pellet was resuspended with hADSC culture medium and then 8 μg/ml polybrene (Sigma-Aldrich, St. Louis, MO, USA) was added.
Induction of Reprogramming
The 5 × 10³/cm2 hADSCs or Oct-4-GFP MEFs were plated 1 day before transduction using DMEM supplemented with 10% FBS. The medium was changed to four different concentrations of FBS-supplemented (5%, 10%, 20%, and 30%) medium before transduction. The cells were transduced with the OSKM retrovirus at a total multiplicity of infection (MOI) 40 and incubated for 24 h. Infection medium was removed, and subsequently virus-transduced cells were washed two times with culture medium. On the fifth day following transduction, transduced cells were detached from the culture plate using 0.05% trypsin/EDTA (HyClone) and passaged to mouse feeder cells. DMEM/F12 (Life Technologies) supplemented with 20% serum replacement (Life Technologies), 1× penicillin/streptomycin (Life technologies), 1× β-mercaptoethanol (Life Technologies), and 4 ng/ml basic fibroblast growth factor (bFGF; R&D Systems, Minneapolis, MN, USA) was used from day 6 to 14.
Culture of iPSC Colonies
Reprogrammed colonies that had morphologies resembling that of human embryonic stem cells (hESCs) were mechanically picked at day 14 using a glass pipette (27). Picked colonies were maintained on mouse feeder cells and mechanically passaged to the fresh feeder cells every 7 days. hADSC-derived iPSCs (hADSC-iPSCs) generated with 20% FBS were used for further characterization.
Alkaline Phosphatase Staining and Analysis of Reprogramming Efficacy
Reprogrammed cells were stained with an alkaline phosphatase (AP) kit (Sigma-Aldrich) at day 14 to evaluate RE. The manufacturer's protocol was followed except for the washing step for which we used DPBS (HyClone) instead of distilled water. The RE (%) for day 0 and day 5 was calculated as (number of AP-positive colonies/number of initial cells at day 0) × 100 and (number of AP-positive colonies/number of cells at day 5) × 100 (Fig. 3F).
Immunostaining Using Tra-1-60 Antibody and Analysis of Reprogramming Efficacy
For the immunocytochemical analysis of TRA-1-60, reprogrammed cells were stained with TRA-1-60 antibody at day 14 to evaluate RE. The cells were washed twice in DPBS and then fixed in 4% paraformaldehyde (Yakuri, Kyoto, Japan) for 30 min at RT. Subsequently, cells were incubated in primary Tra-1-60 antibody (1:100; Millipore) at 4°C overnight. Extra primary antibody was washed three times with 0.2% bovine serum albumin (BSA; Sigma-Aldrich) in DPBS. Streptavidin-HRP secondary antibody (1:500) was applied for 2 h at RT. Extra secondary antibody was washed three times with 0.2% BSA in DPBS. Subsequently, secondary antibody-treated cells were stained using 3,3′-diaminobenzidine (DAB) substrate kit according to the manufacturer's instructions (Vector Laboratories, Burlingame, CA, USA). The RE (%) was calculated as (number of TRA-1-60-positive colonies/number of initial cells at day 0) × 100 (Fig. 3D).
Cell Proliferation Analysis
Cell proliferation of hADSCs was quantified using cell counting kit-8 (CCK-8; Dojindo Molecular Technologies, Inc., Kumamoto, Japan) according to the manufacturer's protocol. Optical density (OD) was measured at 450 nm with a microplate reader (Molecular Devices, Sunnyvale, CA, USA).
BrdU Incorporation Assay
A bromodeoxyuridine (BrdU) incorporation assay was done using a BrdU Cell Proliferation Assay kit (Millipore) according to the manufacturer's protocol. The hADSCs were plated using 10% FBS-supplemented medium (day –1), and the media were changed at 5%, 10%, 20%, and 30% FBS-supplemented medium (day 0), respectively. The BrdU incorporation assay was carried out before confluency. BrdU incorporation into DNA was done for 24 h at 37°C. The relative quantity of incorporated BrdU was analyzed using an anti-BrdU antibody (1:100), HRP-conjugated secondary antibody (1:100), and TMB solution. OD was measured at 450 nm using a microplate reader.
Cell Cycle Measurement
Cell cycle measurement of hADSCs at 5%, 10%, 20%, and 30% FBS was carried out with the propidium iodide (PI) staining method. Cells were detached from the culture plate using 0.05% trypsin/EDTA. Detached cells were fixed with cold 70% ethyl alcohol for 1 h at −20°C. Fixed cells were washed with DPBS and stained with 50 μg/ml PI (Sigma-Aldrich), 0.1% Triton X-100 (Sigma-Aldrich), and 0.2 mg/ml RNase A (Sigma-Aldrich) for 1 h at 37°C. PI-stained, fixed cells were resuspended in DPBS and analyzed using FL-2 laser of Accuri C6 flow cytometer (BD Biosciences, San Jose, CA, USA).
PCR, RT-PCR, and qRT-PCR
Genomic DNA of hADSC-iPSCs was extracted using genomic DNA extraction kit (iNtRON, Seoul, Korea) according to the manufacturer's protocol. Extracted genomic DNA was amplified via polymerase chain reaction (PCR) using Hotstart PCR premix (Bioneer, Daejeon, Korea) and retroviral vector-specific primer (38) (Table 1) to analyze stable genomic DNA integration of OSKM retroviral vectors. Amplified product was confirmed by electrophoresis (Advance Co., Tokyo, Japan) using agarose gel (DPBS; Life Technologies). Total RNA of cells was extracted using the conventional TRIzol (Life Technologies) method. Reverse transcription was achieved using 1 μg of total RNA and the TOPscript cDNA synthesis kit (Enzynomics, Daejeon, Korea) according to the manufacturer's protocol. PCR was carried out using Hotstart PCR premix and MyGenie96 Thermal Block (Bioneer). qPCR was done using greenstar qPCR premix (Bioneer) and ExicyclerTM96 Real-Time Quantitative Thermal Block (Bioneer). Target gene expression was normalized to the β-actin gene for quantification. The primers used in PCR, RT-PCR, and qRT-PCR are listed in Table 1.
Human Primers Used for PCR, RT-PCR, and qRT-PCR

Western Blot Analysis
Denatured protein (50 μg) was loaded onto SDS-PAGE gels (Bio-Rad, Hercules, CA, USA) and run at 80 V for 2 h. Protein was transferred to polyvinylidene fluoride membranes (PVDF; Bio-Rad) at 20 V for 50 min. After blocking using 1% skim milk (BD Biosciences) in Trisbuffered saline (Biosesang, Gyeonggi-do, Korea) and Tween 20 (Sigma-Aldrich) (TBS-T), membranes were treated with anti-cyclin D2 (1:1,000; Millipore), anti-cyclin E1 (1:1,000; Millipore), anti-cyclin A2 (1:1,000; Millipore), anti-cyclin B1 (1:1,000; Millipore), anti-p53 (1:200; Santa Cruz Biotechnology, Dallas, TX, USA), and anti-glyceraldehyde-3-phosphate dehydrogenase (GAPDH) antibody (1:1,000; abm, Milton, ON, Canada) for 1 h at RT. Extra primary antibody was washed three times with TBS-T. Subsequently, membranes were treated with HRP-conjugated secondary antibody (1:10,000; Santa Cruz Biotechnology, Santa Cruz, CA, USA) for 1 h at RT. Extra secondary antibody was washed three times by TBS-T. Membranes were developed using ECL solution (iNTRON).
Karyotyping and DNA Fingerprinting
A karyotype analysis of hADSC-iPSCs was performed in the Samkwang Medical Laboratories (Smlab, Seoul, Korea). DNA fingerprinting analysis of ADSCs, hADSC-iPSCs, and nonrelated ADSCs was performed by the Korea Gene Information Center (Seoul, Korea).
Immunofluorescence Staining
The cells were fixed with 4% paraformaldehyde (Yakuri) for 30 min at RT. Subsequently, permeabilization was done using 0.1% Triton X-100 in DPBS for 20 min at RT. Permeabilized cells were blocked using 2% BSA (Sigma-Aldrich) in DPBS for 1 h at RT. Blocked cells were treated with primary antibody [tubulin (1:500; abm), Oct-4 (1:100; Abcam), Sox-2 (1:100; Abcam), Nanog (1:100; Abcam), SSEA-4 (1:100: Abcam), Tra-1-60 (1:100; Abcam)] for 1 h at RT. Extra primary antibody was washed three times with 0.2% BSA in DPBS. Subsequently, Cy-3 or FITC-conjugated secondary (1:500) antibodies were used to treat cells for 1 h at RT. Extra secondary antibody was washed three times with 0.2% BSA in DPBS. The fluorescence image was observed under fluorescence microscopy (Nikon, Kanagawa, Japan) using a 490-nm (FITC) or 554-nm (Cy3) excitation wavelength.
Microarray Analysis
Microarray analysis was done using Human Expression 4×44K (Agilent Technologies Inc., Santa Clara, CA, USA). Total RNA of H9 ESCs (female; WiCell, Madision, WI, USA), iPS(foreskin)-2 (male; WiCell), hADSC-iPSCs, and ADSCs was extracted using the conventional TRIzol method. cDNA was synthesized from extracted RNA and used for microarray. Microarray analysis was performed in the Reference Biolabs (Seoul, Korea) and Macrogen (Seoul, Korea).
Confirmation of Multipotency of hADSCs
Adipogenic, chondrogenic, and osteogenic differentiation of hADSCs was conducted using a previously described method (20). Briefly, differentiation was carried out for 2 weeks (for adipogenic) or 3 weeks (for chondrogenic and osteogenic lineage). The components of differentiation medium were DMEM-HG (Life Technologies), FBS (Wisent), insulin (Sigma-Aldrich), insulin–transferrin–selenium (Life Technologies), ascorbic acid (Sigma-Aldrich), glycerol-2-phosphate (Sigma-Aldrich), 3-isobutyl-1-methyl xanthine (Sigma-Aldrich), indomethacin (Sigma-Aldrich), dexamethasone (Sigma-Aldrich), Glutamax (Life Technologies), penicillin/streptomycin (Life technologies), and transforming growth factor- β1 (TGF-β; R&D Systems) (Table 2). The differentiation into adipogenic, chondrogenic, and osteogenic lineages was confirmed by Alizarin red O (Sigma-Aldrich), Alcian blue (Sigma-Aldrich), and Von Kossa (using silver nitrate; Sigma-Aldrich) staining, respectively.
Components of Differentiation Medium of Human Adipose-Derived Stem Cells (hADSCs)

Embryoid Body (EB) Formation
hADSC-iPSCs were mechanically detached from the feeder cells, and floating culture was done for 7 days. The medium was DMEM/F12 supplemented with 20% serum replacement, 1× penicillin/streptomycin, and 1× β-mercaptoethanol.
Teratoma Formation and Histological Analysis
All procedures carried out on mice were subject to the guidelines of an approved protocol from CHA University Institutional Animal Care and Use Committee. Approximately 1 × 10⁶ hADSC-iPSCs with 100 μl Matrigel (BD Biosciences) were injected into the dorsal skin of Balb/c nude mice (Orient Bio Inc., Gyeonggi-do, Korea). After 10 weeks, teratomas were retrieved at the injection site and fixed with 4% formaldehyde in PBS. Paraffin-embedded tissue sections were prepared and analyzed with hematoxylin and eosin (both Sigma-Aldrich) staining.
Statistical Analysis
All statistical analyses were performed using Prism 4.0 software (Graphpad Software Inc., La Jolla, CA, USA). One-way ANOVA was used to determine significant differences in data levels. Tukey's post hoc tests were conducted following ANOVA to determine statistical differences between groups. Values of p < 0.05 were considered statistically significant.
Results
hADSCs Have Multipotency and Some Characteristics of Pluripotency
Human ADSCs (hADSCs) could differentiate into adipocytes, chondrocytes, and osteocytes (Fig. 1A). This demonstrated that hADSCs have multipotency. Relative expression of Oct-4, Sox-2, and Nanog of hADSCs was about a hundred times lower than hESCs. However, relative expression of c-Myc and Klf-4 of hADSCs was comparable to hESCs. (Fig.1B). Pluripotency-related Oct-4, Sox-2, Nanog, SSEA-4, and Tra-1-60 proteins were not detected in hADSCs (Fig. 1C). hADSCs had partial alkaline phosphatase activity (Fig. 1D). These findings indicate that hADSCs have some characteristics of pluripotency such as oncogene expression and alkaline phosphatase activity.

Characterization of human ADSCs. (A) Human ADSCs (hADSCs) have multipotency that enable them to differentiate into adipocytes, chondrocytes, and osteocytes. Scale bars: 100 μm. (B) hADSCs from two different donors (hADSCs #1, #2) expressed Klf-4 and c-Myc comparable to hESCs, but not Oct-4, Sox-2, and Nanog. (C) Pluripotency-related Oct-4, Sox-2, Nanog, SSEA-4, and Tra-1-60 proteins were not expressed by hADSCs. Scale bars: 100 μm. (D) hADSCs have partial alkaline phosphatase activity. Scale bar: 100 μm. The error bars in (B) indicate the standard error derived from quantification of at least three independent experiments. *p < 0.05.
Concentration of FBS Affects hADSC Proliferation in Normal Culture Condition
The proliferation of hADSCs was higher at high concentrations of FBS (20% and 30%). hADSCs from two different donors (one male and one female) showed similar proliferation patterns under different concentrations of FBS (Fig. 2A). The ratio of proliferating S + G2/M phase cells was also proportional to the concentration of FBS. The ratio was 17.267 ± 0.425%, 25.333 ± 2.206%, 30.633 ± 1.970%, and 33.800 ± 2.163% at 5%, 10%, 20%, and 30% concentrations of FBS, respectively (Fig. 2B). The ratio of S phase cells (BrdU-positive cells) was also higher at high concentrations of FBS (20% and 30%). The OD was 0.683 ± 0.042, 1.077 ± 0.042, 1.590 ± 0.061, and 1.598 ± 0.022 at 5%, 10%, 20%, and 30% FBS, respectively (Fig. 2C). The relative quantity of cyclin D2, E1, A2, and B1 proteins was higher at high concentration of FBS (20% and 30%) (Fig. 2D). These demonstrated that high concentrations of FBS (20% and 30%) enhance proliferation of hADSCs more than low or standard concentrations of FBS (5% and 10%) in normal culture conditions.

Control of cell proliferation by high concentrations of FBS in normal culture conditions. (A) The proliferation of hADSCs from two different donors was dependent on concentration of FBS. Proliferation was increased with an increasing concentration of FBS. (B) The ratio of cell cycle-progressing cells (sum of S and G2/M phase cells) was increased by a high concentration of FBS (20% and 30%). (C) The relative S phase cells (BrdU-positive cells) were increased at high concentrations of FBS (20% and 30%). (D) The relative quantity of cyclin D2, E1, A2, and B1 proteins was higher at high concentrations of FBS (20% and 30%). The error bars in (B) and (C) indicate the standard error derived from quantification of at least three independent experiments. *p < 0.05.
FBS Enhances the Cellular RE of Human ADSCs at High Concentrations (20% and 30%)
Figure 3A shows a reprogramming schematic of the adult hADSCs employed in the present study. In this schematic, DMEM was supplemented with OKSM and four different concentrations of FBS (5%, 10%, 20%, and 30%). The DMEM/FBS media were used from day 0 to day 6, while traditional iPSC culture medium was used from day 6 to day 14 (Fig. 3A). The morphology of the reprogrammed cells was similar to that of hESCs, yielding cell colonies with a characteristic rounded shape and a specific borderline surrounded by mouse feeder cells (Fig. 3B). The RE of the hADSCs was calculated as the number of alkaline phosphatase-positive colonies divided by the total number of seeded hADSCs at day 0 and was found to be significantly correlated with the concentration of FBS. The RE was 0.203 ± 0.013% at 5% FBS, 0.350 ± 0.010% at 10% FBS, 0.717 ± 0.033% at 20% FBS, and 0.773 ± 0.040% at 30% FBS (Fig. 3C). In addition, the RE of the hADSCs was calculated as the number of Tra-1-60-positive colonies divided by the total number of seeded hADSCs at day 0. It was found to be significantly correlated with the concentration of FBS. The RE was 0.140 ± 0.010% at 5% FBS, 0.273 ± 0.021% at 10% FBS, 0.493 ± 0.016% at 20% FBS, and 0.520 ± 0.020% at 30% FBS (Fig. 3D). Therefore, high concentrations of FBS (20% and 30%) increased the RE by approximately twofold and fourfold relative to standard (10%) and low (5%) concentrations, respectively. This result demonstrates that FBS at high concentrations can stimulate the generation hADSC-iPSCs.

Reprogramming efficacy of human adipose-derived stem cells is dependent on the concentration of FBS. (A) Representative schematic illustrating reprogramming procedure and conditions as follows. Transduction of OSKM retrovirus [day 0 (d0)], passaging of transduced cells onto feeder cells (day 5), change of medium (day 6), and picking and AP staining of reprogrammed cells (day 14). Media supplemented with various concentrations of FBS (5%, 10%, 20%, and 30%) were used from day 0 to day 6 and general iPSC culture medium from day 6 to day 14. (B) The representative morphology of reprogrammed colony at 5%, 10%, 20%, and 30% FBS conditions, respectively. Scale bars: 100 μm. (C) The reprogramming efficacy of hADSCs was calculated by the equation [(number of AP-positive colonies at day 14/number of cells at day 0) × 100] exhibiting significantly higher reprogramming efficacy at high concentrations (20% and 30%) of FBS. (D) The reprogramming efficacy of hADSCs was calculated by the equation [(number of Tra-1-60-positive colonies at day 14/number of cells at day 0) × 100] exhibiting significantly higher reprogramming efficacy at high concentrations (20% and 30%) of FBS. (E) The reprogramming efficacy was dependent on duration of exposure to a high concentration of FBS (20%) [calculated by the same equation in (C)] (none; only 10% FBS treatment). (F) The reprogramming efficacy of hADSCs was calculated by the equation [(number of AP-positive colonies at day 14/number of cells at day 5) × 100] using the number of cells seeded onto feeders at day 5. The reprogramming efficacy of hADSCs from day 5 was also higher at high concentration of FBS (20% and 30%) than at 5% and 10% FBS. (G) The reprogramming efficacy of hADSCs showed similar patterns by different lots of FBS. The error bars in (C–F) indicate the standard error derived from quantification of at least three independent experiments. *p < 0.05.
The effect of the duration of FBS exposure on reprogramming was next investigated by subjecting hADSCs to 20% FBS for different periods of time. Compared with continuous exposure from day 0 to day 6, lower durations of exposure yielded lower RE values. Interestingly, early stages of FBS exposure (day 0 to day 4, day 0 to day 2) led to higher RE values than late stages (day 2 to day 6, day 4 to day 6). This finding implies that RE is critically determined at early rather than late stages of reprogramming (Fig. 3E).
To differentiate between the influence of FBS concentration on hADSC proliferation (see below) and reprogramming itself, the number of hADSCs present on mouse feeder layers was next counted on day 5. The RE was then recalculated based on the same number of hADSCs seeded onto new mouse feeder layers at day 5 rather than at day 0. The RE values under these conditions were 0.036 ± 0.007%, 0.083 ± 0.009%, 0.149 ± 0.039%, and 0.132 ± 0.015% at 5%, 10%, 20%, and 30% FBS, respectively (Fig. 3F). The effect of FBS lots on reprogramming was investigated using two kinds of different lots of FBS. The RE values of FBS lot 1 were 0.107 ± 0.008%, 0.200 ± 0.005%, 0.417 ± 0.010%, and 0.423 ± 0.006% at 5%, 10%, 20%, and 30% FBS, respectively (Fig. 3G). The RE values of FBS lot 2 were 0.110 ± 0.005%, 0.210 ± 0.010%, 0.410 ± 0.013%, and 0.417 ± 0.015% at 5%, 10%, 20%, and 30% FBS, respectively (Fig. 3G).
Therefore, a different batch of FBS showed similar pattern of RE of hADSCs. Hence, high FBS concentrations (20% and 30%) notably enhanced the RE of hADSCs, irrespective of any impact on cell proliferation.
High Concentrations (20% and 30%) of FBS Enhance the Cellular RE of Mouse Somatic Cells
RE of mouse cells was increased by high concentrations of FBS (20% and 30%). The relative RE of Oct-4-GFP MEFs was 0.023 ± 0.020, 0.213 ± 0.122, 1.000, and 0.893 ± 0.109 at 5%, 10%, 20%, and 30% concentrations of FBS, respectively (Fig. 4A). The full reprogramming was confirmed by endogenous Oct-4-GFP expression in reprogrammed iPSC colonies (Fig. 4B). This demonstrated that mechanisms of FBS-mediated reprogramming enhancement is conserved between human and mouse species.

Enhancement of reprogramming efficacy of mouse cells by high concentrations of FBS (20% and 30%). (A) High concentrations of FBS (20% and 30%) enhanced reprogramming efficacy of Oct-4-GFP MEFs. (B) The full reprogramming of Oct-4-GFP MEFs was confirmed by endogenous Oct-4-GFP expression in iPSC colonies. Scale bars: 100 μm. The error bars in (A) indicate the standard error derived from quantification of at least three independent experiments. *p < 0.05.
FBS Concentration Affects hADSC Proliferation During Reprogramming
The proliferation of hADSCs during reprogramming was measured by CCK-8, bromodeoxyuridine (BrdU) incorporation, and fluorescence-activated cell sorting (FACS) assays. The CCK-8 assay measures the reduction of a water-soluble tetrazolium salt to a yellow formazan dye by cellular dehydrogenases, where the amount of dye produced is directly proportional to the number of viable cells. The optical density (OD) stemming from production of the formazan dye by viable hADSCs gradually increased as the concentration of FBS increased. The OD values at day 6 were 0.376 ± 0.023 at 5% FBS, 0.426 ± 0.025 at 10% FBS, 0.462 ± 0.041 at 20% FBS, and 0.475 ± 0.037 at 30% FBS (Fig. 5A). Accordingly, high concentrations of FBS (20% and 30%) increased the proliferation of hADSCs relative to low (5%) and standard (10%) concentrations.

During reprogramming of ADSCs, cell proliferation was dependent on the concentration of FBS. (A) Proliferation of OSKM-transduced hADSCs was evaluated by CCK-8 analysis resulting in higher proliferation at high concentrations of FBS (20% and 30%). (B) The relative S phase cells (BrdU-positive cells) were measured by a BrdU incorporation assay resulting in a higher number of proliferating cells at high concentrations of FBS (20% and 30%). (C) According to FACS analysis, the ratio of cell cycle-progressing cells (sum of S and G2/M phase cells) was increased by high concentrations of FBS (20% and 30%). The error bars in (A) and (B) indicate the standard error derived from quantification of at least three independent experiments. *p < 0.05.
The BrdU assay detects BrdU incorporated into cellular DNA during cell proliferation via spectrophotometric detection of an anti-BrdU antibody. The OD value attributed to the antibody also increased with increasing concentrations of FBS. The OD values at day 4 were 0.069 ± 0.002, 0.080 ± 0.001, 0.108 ± 0.002, and 0.103 ± 0.002 at 5%, 10%, 20%, and 30% FBS, respectively (Fig. 5B). Hence, FBS at concentrations of 20% and 30% increased the number of BrdU-positive cells in the DNA synthesis (S) phase of the cell cycle relative to standard and low concentrations (Fig. 5B).
Finally, FACS analysis showed that the percentage of S + G2/M (gap phase 2/mitotic phase) cells (representing proliferating cells) was 25.8%, 28.7%, 32.5%, and 35.3% at 5%, 10%, 20%, and 30% FBS, respectively (Fig. 5C). Taken together, the results of Figure 5A–C indicate that FBS concentration plays an important role in regulating the proliferation of hADSCs during reprogramming.
FBS Concentration Modulates the Expression of p53-Related Genes [p51, p21, Bcl-2-associated X protein (Bax), and Fas] in hADSCs During Reprogramming
The mRNA and protein expression levels of the p53 tumor-suppressor gene were evaluated at day 4 by quantitative polymerase chain reaction (qPCR) and Western blotting assays, respectively. Relative p53 mRNA expression levels in the 10%, 20%, and 30% FBS groups were normalized to that in the 5% FBS group, where the culture conditions consisted of DMEM plus 5% FBS with OSKM transduction. Culture of hADSCs in medium containing 20% or 30% FBS yielded expression levels of p53 mRNA that were approximately twofold lower than those for cells cultured in medium containing 10% or 5% FBS (Fig. 6A). These observations demonstrate that high concentrations of FBS can reduce the cellular content of p53 mRNA while enhancing the RE of hADSCs. The expression levels of the p53 protein were also inversely dependent on the concentration of FBS (Fig. 6B) and paralleled the trends shown for the expression levels of p53 mRNA (Fig. 6A).

During reprogramming of ADSCs, the expression of p53-related genes and proteins was determined at various concentrations of FBS (5%, 10%, 20%, and 30%) by qPCR and Western blot. (A, B) The relative expressions of p53 mRNA and protein, (C) p51 mRNA, (D) p21 mRNA, and (E) apoptosis-related Bax, and (F) Fas mRNA were lower at high concentrations of FBS (20% and 30%) compared to those at low and standard FBS concentrations (5% and 10%). The error bars indicate the standard error derived from quantification of at least three (A) or two (C–F) independent experiments. *p < 0.05.
The influence of FBS concentration on the mRNA expression levels of several p53-related genes (p51, p21, Bax, and Fas) was next investigated. The p51 tumor-suppressor protein structurally and functionally resembles the p53 tumor-suppressor protein and upregulates p21, a potent cyclin-dependent kinase inhibitor. The p51 protein exerts its actions by interacting with p53-binding sites within the regulatory element of the p21 promoter, thereby inducing apoptosis (28,40). We found that FBS at concentrations of 20% and 30% decreased the mRNA expression levels of p51 and p21 (Fig. 6C,D), along with the mRNA expression levels of the proapoptotic regulators, Bax and Fas (Fig. 6E,F). Therefore, high concentrations of FBS apparently exert an antiapoptotic effect during reprogramming by attenuating the gene expression of p53, p51, p21, Bax, and Fas, presumably amplifying the RE of hADSCs.
Retrovirus-Mediated Transduction Efficacy During the Reprogramming of hADSCs Increases with Increasing Concentrations of FBS
To ascertain whether FBS concentration can affect the retrovirus-mediated transduction efficacy of reprogramming genes into hADSCs, we constructed an enhanced green fluorescent protein (EGFP)-expressing retrovirus, transduced it into the cells under various culture conditions, and monitored the ensuing number of EGFP-positive cells. For retrovirus-mediated transduction, polybrene, a cationic polymer that neutralizes the electrostatic repulsion imposed by negative charges in the cell membrane, was added to the medium together with 5%, 10%, 20%, or 30% FBS for 24 h. After the 24-h incubation, the medium was exchanged for each group of hADSCs with fresh medium containing 10% FBS. The hADSCs were then cultured for another 24 h, and FACS analysis was performed to quantify the number of EGFP-positive cells. EGFP-positive cells constituted 53.4 ± 1.5%, 62.0 ± 1.4%, 67.0 ± 1.3%, and 67.8 ± 1.6% of the total hADSC population at 5%, 10%, 20%, and 30% FBS, respectively (Fig. 7), demonstrating that retrovirus-mediated transduction efficacy increased with increasing concentrations of FBS.
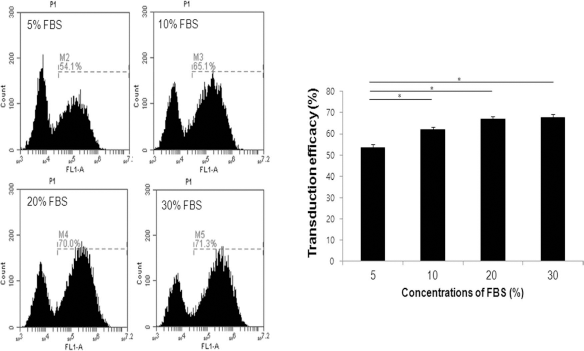
During reprogramming of ADSCs, transduction efficacy at various concentrations of FBS (5%, 10%, 20%, and 30%) were determined by FACS analysis. Retroviral transduction efficacy into hADSCs was increased with increasing concentrations of FBS. The error bars indicate the standard error derived from quantification of at least three independent experiments. *p < 0.05.
Biological Screening of Functional Molecules in FBS
The proliferation-inducing activity of functional molecules such as epidermal growth factor (EGF), insulin-like growth factor (IGF), insulin, and platelet-derived growth factor-BB (PDGF-BB) was evaluated. The increase in OD from day 2 to day 6 under low concentrations of FBS supplemented with 10 or 100 ng/ml PDGF-BB was comparable to high concentrations of FBS (Fig. 8A). However, the reprogramming efficacy did not show significant differences between low FBS (control) and low FBS supplemented with 10 or 100 ng/ml PDGF-BB (Fig. 8B).

Biological screening of functional molecules in FBS. (A) PDGF-BB (10 or 100 ng/ml) significantly enhanced proliferation of hADSCs compared to 20% or 30% FBS. However, EGF, IGF, and insulin did not significantly enhance proliferation of hADSCs. The error bars indicate the standard error derived from quantification of at least three independent experiments. (B) Reprogramming efficacy of hADSCs was increased at high FBS concentrations. However, the addition of 10 or 100 ng/ml PDGF-BB did not significantly enhance reprogramming efficacy of hADSCs. The error bars indicate the standard error derived from quantification of at least three independent experiments. *p < 0.05.
Characterization of hADSC-Generated iPSCs (hADSC-iPSCs)
The iPSCs that were reprogrammed from hADSCs under culture conditions incorporating 20% FBS were designated hADSC-iPSCs. These cells were characterized by fingerprinting, genomic DNA PCR, karyotyping, and transcriptome analyses, in addition to assessment of in vitro and in vivo pluripotency. We first demonstrated that the hADSC-iPSCs had the same fingerprinting pattern as the original hADSCs, confirming that they did in fact originate from the parental cells (Table 3). Stable genomic integration of retroviral OSKM vectors was confirmed by PCR using vector-specific primers (Fig. 9A). This means stable integration of OSKM retroviral vectors into the genome of hADSCs. The hADSC-iPSCs also exhibited a normal karyo type (46, XY) (Fig. 9B) and strong alkaline phosphatase (AP) expression/activity (Fig. 9C), indicative of pluripotency. Furthermore, the cells expressed a number of additional pluripotency-related proteins, such as Oct-4, SSEA-4, Tra-1-60, Sox-2, and Nanog (Fig. 9C), and showed in vitro embryoid bodies (Fig. 9D) and in vivo teratoma formation in immune-compromised mice (Fig. 9E). For instance, the hADSC-iPSCs induced the formation of disorganized tumoral structures containing tissues derived from all three germ layers (ectoderm: neural structure in Fig. 9E; mesoderm: cartilage, bone, and muscle; endoderm: gut-like structure and glandular structure), providing further evidence of their pluripotency.

Characterization of hADSC-iPSCs generated at a high concentration of FBS (20%). (A) Retroviral OSKM vectors were stably integrated into genomic DNA of hADSC-iPSCs. (B) hADSC-iPSCs contain 23 pairs of chromosomes (46, XY). (C) Alkaline phosphatase activity and the expressions of representative pluripotent proteins (Oct-4, SSEA-4, Tra-1-60, Sox-2, and Nanog). (D) hADSC-iPSCs could differentiate into three germ layers and formed EBs in vitro. (E) The pluripotency of hADSC-iPSCs by teratoma formation including three germ layers. (F) The expression of transcriptome in parental ADSCs, H9 ESCs, iPS(foreskin)-2 cells, and hADSC-iPSCs. Scale bars: 100 μm.
Fingerprinting of iPSCs (ADSCs)

Finally, the heat map image in Figure 9F revealed very similar transcriptome patterns among the iPS(ADSCs), iPS(foreskin)-2 cells, and the H9 hESC cell line. However, the transcriptome patterns of these three cell types differed widely from that of the parental hADSCs employed to generate the hADSC-iPSCs. Furthermore, Pearson's correlation coefficients (based on pairwise scatter plot data) between pairs of cell types were 0.802 (H9 hESCs vs. hADSCs), 0.966 [H9 ESCs vs. iPS(foreskin)-2 cells], 0.979 (H9 hESCs vs. hADSC-iPSCs), 0.801 [hADSCs vs. iPS(foreskin)-2 cells], 0.796 (hADSCs vs. hADSC-iPSCs), and 0.978 [iPS(foreskin)-2 cells vs. hADSC-iPSCs], demonstrating that the generated iPS(ADSC) cells were more similar to hESCs and other iPSCs than to the parental hADSCs.
Discussion
This study revealed that high concentrations of a commonly employed cell culture additive, FBS, increased the cellular RE of hADSCs. The enhancement of reprogramming by FBS at 20% and 30% was time dependent and accompanied by increases in cell proliferation, decreased expression of p53, p51, p21, Bax, and Fas, and elevated retrovirus-mediated transduction efficacy of an EGFP reporter gene.
Sugii et al. (35) and Sun et al. (36) reported that hADSCs might be a good candidate for reprogramming due to their capacity to generate multiple cell types (Fig. 1A) and their high mRNA expression of several pluripotency-related factors, such as Klf-4 and c-Myc (Fig. 1B, d C). In addition, hADSCs express AP, albeit at fairly low levels (Fig. 1D). Nonetheless, we found that the RE of hADSCs cultured with a typically employed concentration of FBS (10%) was relatively low (~0.2%), which is similar to the RE observed in previous studies of hADSCs (35,36). Because FBS contains a number of molecules with diverse biological effects, we reasoned that increasing its concentration in the culture medium might enhance the cellular RE of hADSCs.
FBS has long been used as a supplement for the in vitro culture of eukaryotic cells, as well as during the reprogramming of parental cells from the transduction stage at day 0 to the attachment of the transduced cells to the feeder layer at day 6 (Fig. 3A). Now FBS has been universally used for iPSC generation since Yamanaka et al. introduced their induction method (38). Furthermore, iPSC generation for clinical application by Yamanaka et al. was also carried out in the presence of FBS at an early stage of iPSC generation (3,33). However, the concentration of FBS has not previously been shown to regulate cellular RE. As indicated above, FBS contains a variety of growth factors and hormones that promote cell proliferation and survival, including EGF, PDGF, IGF, and insulin (37). Recent studies demonstrated that enhanced cell proliferation is indispensable for reprogramming success (5,31). For instance, the RE values of human keratinocytes and fibroblasts were significantly decreased when G1/S cell cycle transition was blocked by shRNA inhibition of cyclin D2 and E1 genes, effectively halting cell proliferation (31). Thus, we hypothesized that FBS could dose-dependently regulate cell reprogramming via actions on cell proliferation.
To test this hypothesis, cell culture media consisting of DMEM plus four different concentrations of FBS (5%, 10%, 20%, and 30%) were compared for their ability to influence the RE of hADSCs from day 0 through day 6. Based on previous research (10,14,21,25,42), we speculated that FBS could promote the growth and survival of the cells during reprogramming by reducing the expression of tumor-suppressor proteins and by preventing apoptosis.
In support of this idea, we found that the RE of hADSCs was significantly decreased at a low concentration of the additive (5%) relative to a standard concentration (10%), whereas the RE was significantly increased at high concentrations (20% and 30%) (Fig. 3C). Furthermore, high concentrations of FBS markedly increased the proliferation of hADSCs during reprogramming (Fig. 5). These results are consistent with an earlier investigation detailing augmented proliferation of chicken cells following exposure to 20% versus 10% FBS (32).
Interestingly, even though we recalculated the RE (colonies/cell number) of the parental hADSCs by using the number of cells plated onto the mouse feeder layers at day 5 rather than at day 0 (Fig. 3F), the efficacy of reprogramming continued to be higher at 20% and 30% FBS than at 5% and 10% FBS (Fig. 3F). Therefore, the initial proliferation of cells does not exclusively explain the enhancement of reprogramming by high FBS levels.
Parental cells enact self-defense mechanisms during reprogramming by overexpressing p53 and p21 tumor-suppressor proteins (10). The combination of p53 with p21 helps to protect the cells against external stimuli by substantially upregulating apoptotic pathways (28,40). Therefore, the p53–p21 axis represents a major hurdle to reprogramming. We found that the gene expression levels of p53, p21, and the proapoptotic factors, Bax and Fas, were more pronounced during the reprogramming of induced hADSCs compared with noninduced hADSCs, where the culture conditions for the noninduced cells corresponded to 10% FBS without OSKM transduction (data not shown). The induced hADSCs presumably switched on a p53/p21/Bax/Fas-mediated signaling pathway to maintain cellular homeostasis against reprogramming stimuli, in agreement with a previous report showing that p53- and p21-related signals were amplified by the induction of reprogramming (10). Compared with low (5%) and standard (10%) concentrations of FBS, high concentrations (20% and 30%) appreciably downregulated the mRNA expression levels of p53, p51, p21, Bax, and Fas in induced hADSCs (Fig. 6). We therefore suggest that high concentrations of FBS contribute to cell reprogramming after transduction by attenuating self-defense pathways.
Together with cell proliferation and downregulation of p53-related gene expression, retrovirus-mediated transduction efficacy of pluripotency-related genes into parental cells is another key requirement for reprogramming success. Indeed, high transduction efficacy increases the cellular RE (7). Importantly, FBS at 20% and 30% increased transduction efficacy in the current investigation, as assessed by the expression of a reporter gene, EGFP, in the transduced hADSCs (Fig. 7). This is in line with earlier work showing that retroviral infection efficacy is proportional to serum concentration (2). Taken together, our results indicate that the enhancement of RE at high concentrations of FBS occurs through a harmonized regulation of cell proliferation, p53 signaling, and transduction efficacy. High concentrations of FBS would be able to boost RE also at a nonviral method because it induces increase in cell proliferation, decrease in p53 expression, and increase in transduction efficacy in the same way irrespective of delivery vector system. In addition, the FBS-mediated enhancement of RE was observed for MEFs as well as hADSCs (Fig. 4), indicating that the effect of FBS on reprogramming is conserved between species.
While the use of FBS has been approved clinically, identifying the specific components that contribute to the effect is important and could lead to “cleaner” procedures. By using biological screening methods, we tried to find functional proliferation and reprogramming enhancing small molecules by adding some candidate growth factor and hormone. Among EGF, IGF, insulin, and PDGF-BB, PDGF-BB at 10 ng/ml and 100 ng/ml significantly enhanced the proliferation compared to the others (Fig. 8A). Because it is a main component of FBS, PDGF seems to be in charge of most proliferation enhancement of FBS. It was reported that PDGF is known to induce proliferation in pancreatic cancer cells. However, compared to a low concentration of FBS (control), the addition of 10 or 100 ng/ml PDGF-BB did not increase reprogramming efficacy significantly (Fig. 8B), implying that the combination of various components in FBS probably increases reprogramming efficacy rather than one specific component, such as PDFG-BB. Thus, it seems that reprogramming enhancement in a high concentration of FBS is the combined result of increased cell proliferation, decreased p53-related pathway activity, and increased transduction efficacy (Fig. 6). We believe this system using a high concentration of FBS would be a very useful and simple technique to increase efficacy of cellular reprogramming. Furthermore, it is possible to show a synergistic effect by combining this technique with other reprogramming enhancing factors such as vitamin C, hypoxia, and novel small molecule.
Our data also suggest that the utilization of FBS at a concentration of 10%, which is currently regarded as a “gold standard” practice in cell culture protocols, is not optimal for efficient reprogramming. Although FBS is derived from animals and demonstrates considerable batch-to-batch variation, the additive was approved for the expansion of cells for transplantation applications in human patients (34). Therefore, we propose that FBS could be readily employed at high concentrations (20% and 30%) as a reprogramming enhancer. Furthermore, we hypothesize that FBS will show synergistic effects when utilized in combination with other reprogramming enhancers (e.g., vitamin C or novel small-molecule compounds) and techniques (e.g., hypoxic culture conditions). As such, the identification of the active constituents of FBS that function during reprogramming is essential to elucidate the underlying mechanisms that promote cellular RE.
Compared with low (5%) and standard (10%) concentrations of FBS, high concentrations of the culture additive (20% and 30%) significantly enhanced the RE of hADSCs through combined effects on cell proliferation, p53-related gene expression, and retrovirus-mediated transduction efficacy during reprogramming. The iPSCs generated from hADSCs at high FBS concentrations showed a normal karyotype and intrinsic ESC-like characteristics, such as pluripotency and the capacity for self-renewal. FBS (20% and 30%) also enhanced the RE of MEFs, indicating that the influence of FBS levels on reprogramming are not restricted to human cells.
Footnotes
Acknowledgments
This research was supported by a grant of the National Research Foundation of Korea (NRF) funded by the Ministry of Science, ICT & Future Planning (NRF-2013R1A2A1A09013980). The authors declare no conflicts of interest.