
Abstract
Neuron-like cells derived from adipose tissue-derived stem cells (ADSCs) have been considered one of the most promising cells for the treatment of neurodegenerative diseases and neurotrauma in the central nervous system (CNS). Thus far, extensive efforts have been made to facilitate neuronal differentiation of ADSCs, but limited progress has been achieved. In the present study, we tested the possibility of using a combination of electrical stimulation (ES) with Nurr-1 gene transduction to promote neuronal differentiation of ADSCs. The tolerance of ADSCs to ES was first examined by a cell apoptosis assay. The proliferation of cells was characterized using a CCK-8 assay. The morphology of cells was examined by scanning electron microscopy (SEM). The differentiation of ADSCs into neuron-like cells was examined by immunocytochemistry (ICC)–immunofluorescence staining, quantitative real-time polymerase chain reaction (qRT-PCR), Western blotting, and enzyme linked immunosorbent assay (ELISA). The gene expression of microtubule-associated protein 2 (MAP-2), β-tubulin, neurofilament 200 (NF-200), octamer binding transcription factor 4 (OCT-4), and glial fibrillary acidic protein (GFAP) after stimulation was examined by qRT-PCR. We found that the optimal intensity of ES for neuronal differentiation of ADSCs was 1 V/cm. In addition, ES combined with Nurr-1 gene transduction increased the neuronal differentiation rate of ADSCs, the length of neurite-like processes, and the secretion of dopamine. Further studies showed that a combination of ES with Nurr-1 gene transduction was capable of promoting the expression of MAP-2, β-tubulin, and NF-200 but decreased the expression of OCT-4 and GFAP. All of these findings indicate that a combination of ES with Nurr-1 gene transduction could facilitate neuronal differentiation of ADSCs, which raises the possibility of its application in the treatment of neurodegenerative diseases and neurotrauma in the CNS.
Keywords
Introduction
Cerebral trauma and neurodegenerative diseases, such as Parkinson's disease, are devastating lesions in the central nervous system (CNS), which are characterized by loss of neuronal cell populations (15,36). Thus far, extensive efforts, such as medication, surgery, and gene delivery, have been tried to minimize the loss of neuronal cells and relieve the symptoms (16,17,30). However, restoring brain tissue and its functions remains to be resolved after nerve lesions in the CNS. Progress in stem cell research offers new avenues for stem cell therapy in the treatment of lesions in the CNS (8,29,31). Of the many varieties of stem cells, adipose tissue-derived stem cells (ADSCs) attract a lot of attention because of their abundance, easy harvesting, and excellent multipotent potential (32,38). Thus far, many strategies have been proposed, including neurotrophic factors, gene transduction, preinducer treatment, and subsonic vibration treatment, to promote neuronal differentiation of ADSCs (1,2,7,22). However, the differentiation rate of ADSCs into neuronal cells remains unsatisfactory, which significantly limits their application in the treatment of lesions in the CNS.
Nurr-1 is a transcription factor, which is essential in the generation, maturation, and migration, as well as differentiation, of midbrain dopaminergic cells (12,15, 34). It has been reported that Nurr-1 plays a critical role in mesencephalic dopaminergic neuronal development in association with the dopamine D2 receptor through the extracellular signal-regulated kinase signaling pathway (14). In addition, overexpression of the Nurr-1 gene in embryonic cortical precursor cells has been found to be able to promote neuron differentiation and inhibit astrocyte formation (5). In a recent study, Nurr-1 gene overexpression was shown to be capable of initiating neuronal differentiation of bone marrow mesenchymal stromal cells (BM-MSCs) (24). All of this evidence indicates the essential role of the Nurr-1 gene in initiation of neuronal differentiation in embryonic cortical precursor cells and BM-MSCs. However, whether Nurr-1 is capable of initiating neuronal differentiation in ADSCs remains unclear.
Neurons are excitable cells, which can respond quickly to electrical stimulation (ES) at higher frequencies (> 50 Hz) by instant depolarization (27). It has been reported that ES is able to promote neurite outgrowth (6,23), which is an early and essential process during neuronal differentiation. All of this evidence drives researchers to investigate the application of ES in facilitating neuronal differentiation in stem cells. It has been reported that mild ES (10 V) is capable of inducing embryonic stem cells into neuronal fate (37). In addition, ES has also been shown to promote neuronal differentiation of BM-MSCs (24). These findings suggest a beneficial role of ES in neuronal differentiation of stem cells. A recent study showed that ADSCs are able to respond to low-frequency alternating current electrical fields by elevating cytoplasmic calcium (20), highlighting the possibility of using ES to promote neuronal differentiation of ADSCs. Thus far, the possible role of ES in neuronal differentiation of ADSCs has not been investigated. In addition, the Nurr-1 gene has been shown to be able to initiate neuronal differentiation of many stem cells (3,5,24), but this has not yet been reported in ADSCs. Whether Nurr-1 gene overexpression is able to initiate neuronal differentiation of ADSCs and whether it is possible for ES to produce an additive effect when coupled with Nurr-1 gene overexpression needs to be clarified. The present study was designed to investigate the role of ES and Nurr-1 gene overexpression on neuronal differentiation of ADSCs.
Materials and Methods
Isolation, Culture, and Characterization of ADSCs
All procedures were conducted in accordance with a protocol reviewed and approved by the Institutional Ethical Committee of the Fourth Military Medical University. Adipose tissues were taken from the abdomens of 2- to 4-week-old male Sprague–Dawley (SD) rats (provided by the Experimental Animal Center of the Fourth Military Medical University, N = 4). They were digested with 0.1% type I collagenase (Sigma-Aldrich, St. Louis, MO, USA) for 1 h at 37°C on a shaker (200 rpm). They were washed twice by centrifugation at 225 × g for 8 min in phosphate-buffered saline (PBS; Gibco/Life Technologies, Carlsbad, CA, USA), and cells were plated in 25-cm2 tissue culture flasks (Corning Inc., Corning, NY, USA) in Dulbecco's modified Eagle medium (Gibco) supplemented with 10% fetal calf serum (FCS; Gibco) and antibiotics (penicillin and streptomycin solution; Sigma-Aldrich). Cells were kept in a humidified 5% CO2 incubator at 37°C, and medium was refreshed every 2 days. Cells of the third to the fifth passages were used in the experiment.
Flow cytometry was used to characterize the cultured cells and confirm their purity. Cells were detached using 0.25% trypsin/0.02% EDTA (Invitrogen, Grand Island, NY, USA) and were counted. Then 10% FCS was added to aliquots of about 2 × 10⁵ cells in amber-tinted 5-ml centrifuge tubes. The cells were incubated on ice for 30 min, resuspended in PBS, and pelleted by centrifugation for 10 min at 400 × g. The cells were stained with fluorescein isothiocyanate (FITC)-conjugated mouse anti-rat CD31 (1:250; BD Pharmingen™; Franklin Lakes, NJ, USA), allophycocyanin (APC)-conjugated mouse anti-rat CD29 (1:100; eBioscience; San Diego, CA, USA), PerCP-Cy5.5-conjugated mouse anti-rat CD90 (1:250; eBioscience), and phycoerythrin (PE)-conjugated mouse anti-rat CD45 (1:100; eBioscience) at 4°C for 30 min. The cells that were stained with FITC-, PerCP-Cy5.5-, APC-, or PE-labeled mouse anti-rat IgG were considered negative controls. The cells were pelleted, washed twice_with PBS, and fixed with 1% paraformaldehyde (PFA; Sigma-Aldrich). The samples were then analyzed by flow cytometry (BD Pharmingen™). Flow cytometric analysis demonstrated that 99.5% of the cells were positive for CD90 and 99.9% for CD29. Only 0.3% of the cells were positive for CD31, and 1.2% of the cells were positive for CD45, indicating that these cells possessed phenotypic characteristics of ADSCs. When the cells were cultured in osteogenic (DMEM supplemented with 10% FCS, 0.1 μM dexamethasone, 10 mM β-glycerophosphate, and 50 μg/ml L-ascorbic acid 2-phosphate; all Sigma-Aldrich)/adipogenic (DMEM with 10% FCS, 1.0 μM dexamethasone, 5.0 μg/ml insulin, 100 μM indomethacin, and 0.5 mM isobutyl-methylxanthine; all Sigma-Aldrich) differentiation medium, they also showed multipotent differentiation capability.
Electrical Cell Culture System
The conductive polypyrrole/chitosan membrane (thickness 0.4 mm), which was prepared as described in previous studies (10,11,26), was cut into rectangular sections (2.79 × 7.8 cm). The membrane sections were fixed to the bottom of the custom-built electrical cell culture plate (Fig. 1). In this custom-built electrical cell culture plate, two thin platinum electrodes were fixed at the opposite two ends of the rectangular conductive polymer by using a watertight seal to avoid the direct contact of electrodes and culture medium. The electrodes were connected to an ES power supply (stimulator) (220 V, 50 Hz), which is capable of supplying alternating currents. The surface of conductive polymer exposed to cell culture was 2.79 × 7.0 cm2. The electrodes did not come into contact with the culture medium directly to avoid a possible weak ionic current. When the ADSCs (passage 3) reached 95% confluence, they were digested with 0.25% trypsin (Invitrogen/Gibco) solution, washed, and resuspended in DMEM/F-12 (Gibco) with 10% FCS. The cells were seeded on the polypyrrole/chitosan membranes and cultured for 24 h to allow settling and adhesion. Then they were electrically stimulated for 3 days. We chose five groups of ES intensity (0 V/cm, 0.5 V/cm, 1 V/cm, 3 V/cm, and 5 V/cm; 10 Hz, 1 h).

Schematic diagram of neuronal induction using ADSCs subjected to ES and Nurr-1 gene transduction. (A) ADSCs adhered onto the custom-made electrical cell culture plate. (B) Nurr-1 genes transduced into ADSCs using lentivirus. (C) ES was applied to Nurr-1 gene-transduced ADSCs that adhered to the custom-made electrical cell culture plate.
CCK-8 Assay of Cell Viability
Cell Counting Kit-8 (CCK-8; Dojindo, Kumamoto, Japan) allows very convenient assays by utilizing Dojindo's highly water-soluble tetrazolium salt. Briefly, 24 h after ES, the membranes with cells attached were washed three times with PBS. Then ADSCs were detached from the conductive polymer using a 0.25% trypsin solution, washed, and resuspended in DMEM/F-12. Then the cell suspension was inoculated (100 ml/well) in a 96-well plate (Corning), which had wells containing known numbers of viable cells. The plate was preincubated in a humidified incubator (37°C, 5% CO2). The CCK-8 solution (10 μl) was then added to each well of the plate. The plate was then incubated for another 4 h in the incubator. The absorbance was measured at 492 nm by using a microplate reader (Wellscan MK3; Thermo Labsystems, Helsinki, Finland). A calibration curve was prepared using the data obtained from the wells that contained known numbers of viable cells.
Evaluation of Apoptotic Cells
Twenty-four hours after ES, the apoptosis rate of ADSCs in each group was detected and quantified with flow cytometry after staining with annexin V-FITC (Merck Millipore, Darmstadt, Germany) and propidium iodide (PI; Merck Millipore). In brief, ADSCs were trypsinized, resuspended in 200 μl binding buffer (106 cells per tube; Sigma-Aldrich), and then incubated with 10 μl annexin V-FITC and 5 μl PI for 15 min at room temperature. Samples were then diluted to 500 μl with binding buffer, and the number of viable cells was determined by flow cytometry (Beckman Coulter Inc., Brea, CA, USA) using emission filters of 530/30 nm (FITC) (1:50) and 585/42 nm (PI) (1:100). All samples were analyzed within 1 h after preparation.
Transduction of Nurr-1 and GFP Double Gene Into ADSCs
ADSCs (passage 2) grown in a flask for 1 week were detached with the use of trypsin-EDTA (Invitrogen/Gibco) and replated in six-well plates at a density of 5 × 10⁴ cells in 1 ml of DMEM/F-12 per well. The medium was aspirated when the cells reached subconfluence. The lentiviral-GFP- and lentiviral-GFP-Nurr-1-diluted media were then added to the cells to achieve a multiplicity of infection of 10 (lenti-GFP, lenti-GFP-Nurr-1). The viral vectors were constructed by a biotechnology company (Shanghai Genechem Co., Ltd., Shanghai, China). After incubation at 37°C for 12 h, we replaced the transduction medium with DMEM/F-12. The transduction efficiency of the Nurr-1 group increased gradually over time and reached 32.1 ± 4.8% at 24 h, 48.9 ± 5.1% at 48 h, 73.2 ± 3.8% at 72 h, and 75.6 ± 3.1% at 96 h.
Experimental Groupings
There were four groups: 1) cells cultured in normal medium, 2) cells that were electrically stimulated (1 V/cm, 10 Hz, 1 h), 3) cells that were transduced with the Nurr-1 gene, and 4) Nurr-1 gene transduced cells subjected to ES.
In Vitro Immunofluorescence Study
Twenty-four hours after ES and Nurr-1 gene transduction, the cells were fixed with 4% PFA (Sigma-Aldrich) for 15 min at room temperature, treated with 0.2% Triton X-100 (Sigma-Aldrich) for 10 min, and then incubated for 30 min with blocking solution (0.4% Triton X-100 and 4% normal goat serum in PBS), and then treated with primary antibodies overnight at 4°C. The primary antibodies included were rabbit anti-rat MAP-2 (1:200; Sigma-Aldrich) and mouse anti-rat β-tubulin (1:200; Sigma-Aldrich). The samples were then incubated with secondary antibodies for 1 h at room temperature. FITC-conjugated goat anti-mouse IgG (1:200; Abcam Inc., Cambridge, UK) and tetramethylrhodamine isothiocyanate (TRITC)-conjugated goat anti-rabbit IgG (1:200; Abcam) were used as secondary antibodies. Thereafter, the cell nucleus was stained with 4′,6-diamidino-2-phenylindole (DAPI) solution (1:500; Invitrogen) for 5 min at room temperature. Between each step, the cells were rinsed extensively with PBS, three times for 5 min each. Finally, the results of immunostaining were examined and photographed with a fluorescence microscope (FV1000; Olympus, Tokyo, Japan). The individual pustute for each cell was measured using the ImageJ software (version 1.44; NIH, Bethesda, MD, USA). The “pustute” actually means “neurite.” Since the differentiated cells are not completely native neurons, we think it is proper to use the word “pustute” instead of “neurite.” Length was defined as the distance from the tip of the pustute to the junction between the cell body and the pustute base. For quantification of β-tubulin- and MAP-2-immunopositive cells from different groups, the total cell number (DAPI-stained nuclei) and the number of immunostained cells were counted in four randomly chosen view fields from each well, with four wells counted per staining. The percentage of positive cells was calculated as the number of immunostained cells/total cell number × 100%. All experiments were repeated three times.
Scanning Electron Microscopy (SEM)
Twenty-four hours after ES and Nurr-1 gene transduction, the adhesion of ADSCs in each group was detected with SEM. Briefly, ADSCs were fixed with 4% PFA at room temperature for 30 min, washed three times with distilled water, and dehydrated with serial ethanol solutions. The specimens were then dried under vacuum at room temperature, sputter-coated with gold, and subjected to SEM at an accelerating voltage of 5 kV (S-4800; Hitachi, Tokyo, Japan) to examine the surface morphology of the cells.
Quantitative Real-Time Polymerase Chain Reaction (qRT-PCR)
Twenty-four hours after ES and Nurr-1 gene transduction, cells in each group were homogenized in TRIzol reagent (Sigma-Aldrich). Total RNA isolation was performed using the RNeasy Mini Prep kit (Qiagen, Hilden, Germany). cDNA was synthesized using Superscript III reagents according to the manufacturer's instructions (Invitrogen). qRT-PCR analysis was then performed. The sequences of primers for MAP-2, NF-200, β-tubulin, OCT-4, GFAP, and glyceraldehyde-3-phosphate dehydrogenase (GAPDH) (internal control) are shown in Table 1. qRT-PCR conditions were as follows: denaturation at 95°C, 30 s; primer annealing at 59°C, 30 s; and elongation at 72°C, 40 s. Quantification of PCR products was performed using the 2–ΔΔCt method. Quantities of messenger RNA (mRNA) were normalized to the housekeeping gene GAPDH. Assays were done three times using triplicate wells.
Primer Sequences Used for the Quantitative Real-Time PCR
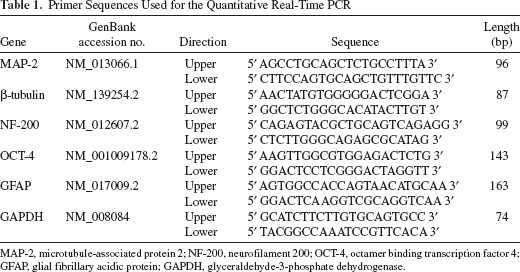
MAP-2, microtubule-associated protein 2; NF-200, neurofilament 200; OCT-4, octamer binding transcription factor 4; GFAP, glial fibrillary acidic protein; GAPDH, glyceraldehyde-3-phosphate dehydrogenase.
Western Blotting Analysis
Twenty-four hours after ES, the cells in each group were washed with PBS and lysed with lysis buffer containing protease inhibitors (Promega Corporation, Madison, WI, USA). The total protein concentration was determined by the bicinchoninic acid (BCA) assay (Thermo Scientific Inc., Waltham, MA, USA). Protein extracts were denatured by heat at 100°C for 5 min, electrophoretically separated on a 12% SDS-PAGE (Bio-Rad Laboratories, Hercules, CA, USA), and then transferred to a PVDF membrane (Bio-Rad Laboratories). The membrane was blocked with 5% nonfat dry milk (Shanghai BioSun Sci & Tech Co., Shanghai, China) in TBST buffer (50 mM Tris-HCl, 100 mM NaCl, and 0.1% Tween-20, pH 7.4; all Sigma-Aldrich) and incubated with rabbit anti-rat MAP-2 antibody (1:1,000; Abcam) and mouse anti-rat β-tubulin (1:1,000; Abcam) in TBST buffer at 4°C overnight. The membrane was washed with TBST buffer (3 × 5 min), and incubated with HRP-conjugated goat anti-rabbit or goat anti-mouse IgG (1:12,000; Sigma-Aldrich) at room temperature for 2 h. The membrane was then washed with PBS, and the HRP activity was determined using an enhanced luminol-based chemiluminescence (ECL) kit (Merck Millipore). The image was scanned with a GS 800 Densitometer Scanner (Bio-Rad Laboratories), and the optical density was determined using PDQuest 7.2.0 software (Bio-Rad Laboratories). Rabbit anti-rat GAPDH polyclonal antibody (1:10,000; Sigma-Aldrich) was used as an internal control.
Dopamine Estimation Through Enzyme Linked Immunosorbent Assay (ELISA)
Twenty-four hours after ES, the number of cells was counted, and the culture mediums were collected to determine the amount of dopamine secreted by the cultured cells. Cell culture supernatants were centrifuged and assayed using ELISA kits following the manufacturer instructions (Antibodies Online, Aachen, Germany). The plates were read at 450 nm and analyzed using a microELISA reader (Multiscan MK3, Thermo Labsystems). Then the amount of dopamine secreted by cells was normalized to cell number in each group.
Statistical Analysis
All tests were performed at least three times. All data presented here were the mean ± standard error of mean. The data were analyzed using one-way analysis of variance with SPSS 11.0 software (SPSS, IBM, Armonk, NY, USA). Significant results were followed by Bonferroni's post hoc testing. A value of p < 0.05 was considered statistically significant.
Results
The Effect of ES on Neuronal Differentiation of ADSCs
After adherence of cells to the culture plate, an alternating current with different intensities (0 V/cm, 0.5 V/cm, 1 V/cm, 3 V/cm, and 5 V/cm; 10 Hz, 1 h) was used to stimulate ADSCs successively for 3 days with 1 h for each day. A cell apoptosis assay was performed to evaluate the tolerance of ADSCs to ES (Fig. 2A–E). At 24 h after ES, the percentage of apoptotic cells was 1.34 ± 1.13% in the control group, 2.63 ± 1.24% at 0.5 V/cm, and 2.71 ± 1.52% at 1 V/cm, respectively (Fig. 2F). When the potential gradient increased to 3 V/cm and 5 V/cm, the percentages of apoptotic cells increased significantly to 60.92 ± 7.93% (p < 0.01) and 84.71 ± 11.20% (p < 0.01).

The tolerance and proliferation of ADSCs subjected to ES. Flow cytometry results for each group were as follows: (A) Control; (B) 0.5 V/cm; (C) 1 V/cm; (D) 3 V/cm; (E) 5 V/cm. (F) The percentage of apoptotic cells in each group was obtained by averaging the results of four flow cytometry assays in each group. The CCK-8 results in each group were as follows: (G) the CCK-8 values in 24 h; (H) the CCK-8 values in 48 h; (I) the CCK-8 values in 72 h. Values shown are mean ± SEM; *p < 0.05, **p < 0.01, one-way ANOVA when compared with control group.
The effect of ES on ADSC viability was examined by CCK-8 viability assays (Fig. 2G–I). At 24 h after ES, the CCK-8 values increased by 32.1% at 1 V/cm (p < 0.05) but decreased by 57.2% at 3 V/cm and 78.6% at 5 V/cm compared to that in the control group (p < 0.01) (Fig. 2G). At 48 h after ES, the CCK-8 values increased by 35.2% at 1 V/cm (p < 0.05) but decreased by 70.6% at 3 V/cm and 88.2% at 5 V/cm compared to that in the control group (p < 0.01, Fig. 2H). At 72 h after ES, the CCK-8 values increased by 18.2% at 1 V/cm (p < 0.05) but decreased by 86.4% at 3 V/cm and 91.8% at 5 V/cm (p < 0.01) (Fig. 2I). Since 0.5 V/cm and 1 V/cm did not result in significant apoptosis, ES at 0.5 V/cm and 1 V/cm were applied to ADSCs to investigate their effect on neuronal differentiation of ADSCs.
To examine the neuronal differentiation of ADSCs, the stimulated cells were double-stained with MAP-2 (TRITC) and β-tubulin (FITC), with nuclei counterstained with DAPI in each group. After stimulation at 0.5 V/cm, weak staining of MAP-2 and β-tubulin was found in stimulated cells. When stimulation increased to 1 V/cm, the staining intensity of MAP-2 and β-tubulin dramatically increased (Fig. 3A). The percentage of MAP-2- and β-tubulin-positive cells was then calculated in each group (Fig. 3B). We found that the percentage of MAP-2-positive cells was 1.21 ± 0.84% in the control group, 10.71 ± 2.73% at 0.5 V/cm, and increased to 21.86 ± 2.94% at 1 V/cm (p < 0.01) (Fig. 3B). The percentage of β-tubulin-positive cells was 1.53 ± 0.98% in the control group, 12.47 ± 2.45% at 0.5 V/cm, and increased to 25.84 ± 3.12% at 1 V/cm (p < 0.01) (Fig. 3B). The protein profile showed that ES at 1 V/cm achieved the highest protein levels of MAP-2 and β-tubulin, compared to that in the control and 0.5 V/cm groups (Fig. 3C). In addition, the length of pustute in β-tubulin-positive cells was traced and measured, which showed 13.2 ± 5.2 μm in the control group, 30.5 ± 6.1 μm at 0.5 V/cm, and 74.3 ± 8.3 μm at 1 V/cm (p < 0.01) (Fig. 3D).

The effect of different intensities of ES on neuronal differentiation of ADSCs. (A) Localization of neurogenic markers in ADSCs by confocal microscopy, TRITC-labeled MAP-2 and FITC-labeled β-tubulin were used for immunocytochemistry analysis. Nuclei were stained with DAPI. Scale bar: 100 μm. (B) The number of neural marker-positive cells was counted. (C) The protein levels of MAP-2 and β-tubulin were determined for the control group, 0.5 V/cm, and 1 V/cm. Each test was repeated three times. (D) The pustute length of β-tubulin was examined. *p < 0.05, **p < 0.01.
To examine the gene expression profile in ADSCs that have been stimulated by ES at different intensities, the mRNA levels of MAP-2, β-tubulin, NF-200, OCT-4, and GFAP were examined by qRT-PCR (Fig. 4). The mRNA levels of MAP-2 in the 0.5 V/cm and 1 V/cm groups increased by 2.71-fold and 4.60-fold, respectively, when compared to that in the control group (p < 0.01) (Fig. 4A). The mRNA levels of β-tubulin in the 0.5 V/cm and 1 V/cm groups increased by 3.58- and 6.84-fold, respectively, when compared to that in the control group (p < 0.01) (Fig. 4B). The mRNA levels of NF-200 in the 1 V/cm group increased by 4.28-fold when compared to that in the control group (p < 0.01) (Fig. 4C). In contrast, the mRNA levels of OCT-4 and GFAP decreased after ES. The mRNA levels of OCT-4 and GFAP in the 1 V/cm group decreased by 32.1% and 43.7%, respectively, when compared to that in the control group (p < 0.01) (Fig. 4D,E). No statistically significant change was found in the gene expression of NF-200, OCT-4, and GFAP between the 0.5 V/cm and control groups (p > 0.05) (Fig. 4C–E). Since ES at 1 V/cm showed stronger capability in inducing neuronal differentiation of ADSCs, ES at 1 V/cm was used in combination with Nurr-1 transduction in the remainder of the present study.

The mRNA levels of MAP-2, β-tubulin, NF-200, OCT-4, and GFAP in the control group, 0.5 V/cm group, and 1 V/cm group. *p < 0.05, **p < 0.01.
The Effect of Nurr-1 Gene on Neuronal Differentiation of ADSCs
After 48 h of transduction, green fluorescence was observed in both the Nurr-1 group and GFP group (Fig. 5A). A small decrease in the number of cells was found in the Nurr-1 group compared to the GFP group. Compared to the control group, the CCK-8 values of the Nurr-1 group were significantly lower and reached 33.2% (p < 0.01) at 12 h, 43.6% (p < 0.01) at 24 h, and 63.6% (p < 0.05) at 48 h. However, the CCK-8 values were in the similar range between the Nurr-1 group and the control group at 72 h (Fig. 5B). In addition (Fig. 5C,D), through the immunofluorescence assay, we found that the percentage of MAP-2-positive cells was 1.78 ± 0.92% in the control group and 35.42 ± 3.21% in the Nurr-1 group (p < 0.01). The percentage of β-tubulin-positive cells was 1.64 ± 0.93% in the control group and 38.21 ± 3.97% in the Nurr-1 group (p < 0.01).
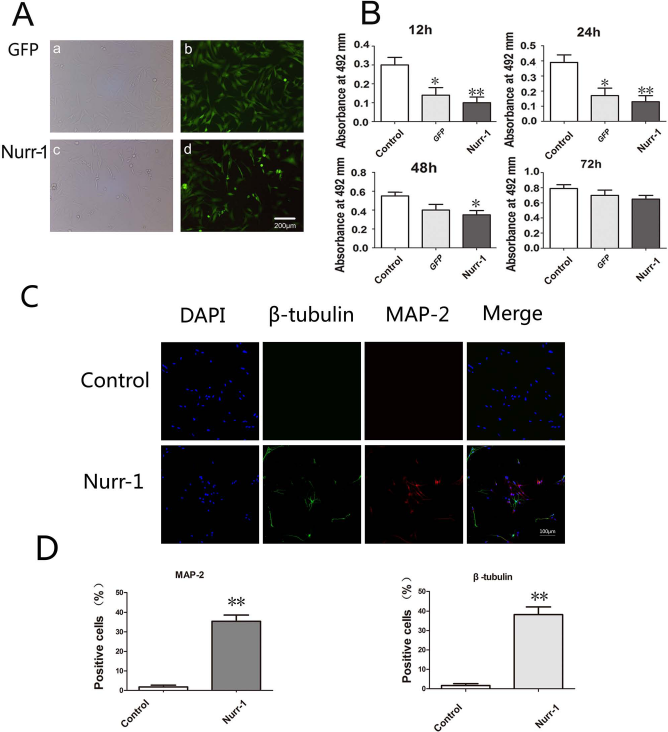
The effect of the Nurr-1 gene on neuronal differentiation of ADSCs. (A) ADSCs were transduced with GFP (a, b) or Nurr-1/GFP gene (c, d) at 72 h. The images showed transduced cells as viewed by fluorescence (a, c) and phase contrast microscopy (b, d). Scale bar: 200 μm. (B) The CCK-8 values were obtained by averaging the results of four samples in each group. *p < 0.05, **p < 0.01, one-way ANOVA when compared to the control group. (C) Localization of neurogenic markers in ADSCs by confocal microscopy, TRITC-labeled MAP-2, and FITC-labeled β-tubulin was used for immunocytochemistry analysis. Nuclei were stained with DAPI. Scale bar: 100 μm. (D) The number of neural marker-positive cells was counted.
Beneficial Effect of ES and Nurr-1 Gene Overexpression on Neuronal Differentiation of ADSCs
To examine the effect of ES and Nurr-1 gene expression on neuronal differentiation of ADSCs, we first evaluated the morphological appearance of cells in each group by SEM. As shown in Figure 6A, the cells in the control group attached, expanded, and showed polygonal appearance with multiple processes. When ADSCs were subjected to ES (1 V/cm), the cells became spindle shaped with bipolar extended processes (Fig. 6B). After Nurr-1 gene transduction, cells showed a spherical shape and refractile appearance with multiple processes or bipolar processes (Fig. 6C). When the Nurr-1-transduced cells were subjected to ES, the cells became spindle or triangle shaped, with long extended processes, showing a neuronlike appearance (Fig. 6D).

SEM photomicrographs of ADSCs cultured in differentiation groups. (A) Control. Scale bar: 15 μm. (B) ES at 1 V/cm. Scale bar: 20 μm. (C) Nurr-1 gene transduction. Scale bar: 20 μm. (D) ES and Nurr-1 gene transduction. Scale bar: 40 μm.
To further investigate the neuronal differentiation of ADSCs in each group, the stimulated cells were double-stained with MAP-2 (TRITC) and β-tubulin (FITC), with nuclei counterstained with DAPI in each group. As shown in Figure 7A, there were no or just a few positive cells for MAP-2 or β-tubulin in the control group, with MAP-2 positivity in 1.45 ± 0.92% of cells and β-tubulin positivity in 1.82 ± 1.07% of cells, indicating spontaneous differentiation of ADSCs into neuron-like cells. After Nurr-1 gene overexpression in ADSCs, weak staining of MAP-2 and β-tubulin was found in the Nurr-1 group, indicating that overexpression of Nurr-1 was capable of initiating neuronal differentiation of ADSCs. When Nurr-1-overexpressed ADSCs were electrically stimulated at 1 V/cm (ES + Nurr-1 group), the staining intensity of MAP-2 and β-tubulin was dramatically increased. As shown in Figure 7B, the percentage of MAP-2-positive cells was 54.23 ± 3.31% (p < 0.01) in the ES + Nurr-1 group, which was significantly higher than that in the control group (1.45 ± 0.92%), Nurr-1 group (31.68 ± 2.17%), and ES group (21.87 ± 1.93%). The percentage of β-tubulin-positive cells was 65.87 ± 5.42% (p < 0.01) in the ES + Nurr-1 group, which was significantly higher than that in the control group (1.82 ± 1.07%), Nurr-1 group (38.92 ± 4.27%), and ES group (27.42 ± 2.96%). To examine the functionality of the differentiated cells in vitro, we also examined the secretion of dopamine by ELISA. Dopamine was detected at a concentration of 60.21 ± 6.78 pg/ml in the ES + Nurr-1 group, 40.26 ± 5.17 pg/ml Nurr-1 group, 13.14 ± 4.12 pg/ml in the ES group, and 3.82 ± 2.31 pg/ml in the control group (Fig. 7C). Further studies showed that the length of pustute in β-tubulin-positive cells was 174.2 ± 8.7 μm (p < 0.01) in the ES + Nurr-1 group, 74.1 ± 7.8 μm (p < 0.05) in the ES group, 61.2 ± 7.1 μm (p < 0.05) in the Nurr-1 group, and 11.8 ± 5.3 μm in the control group. All these findings suggest that ES at 1 V/cm is capable of further promoting neuronal differentiation of ADSCs, which was initiated by Nurr-1 gene overexpression (Fig. 7D).

The effect of ES combined with Nurr-1 gene overexpression on neuronal differentiation of ADSCs. (A) Localization of neurogenic markers in ADSCs by confocal microscopy, TRITC-labeled MAP-2, and FITC-labeled β-tubulin were used for immunocytochemistry analysis. Nuclei were stained with DAPI. Scale bar: 100 μm. (B) The number of neural marker-positive cells was counted. (C) The dopamine secretion was detected in the control group, ES group, Nurr-1 transduction group, and ES + Nurr-1 transduction group. Each test was repeated three times. (D) The pustute length of β-tubulin was examined. Values shown are mean ± SEM; *p < 0.05, **p < 0.01.
The mRNA levels of MAP-2, β-tubulin, NF-200, OCT-4, and GFAP were examined in the present study to further evaluate the neuronal differentiation of ADSCs, which were subjected to Nurr-1 transduction and ES (Fig. 8). The mRNA levels of MAP-2 increased by 4.51-fold (p < 0.05), 5.09-fold (p < 0.01), and 9.58-fold (p < 0.01) in the ES group, Nurr-1 group, and ES + Nurr-1 group, respectively, when compared to that in the control group (Fig. 8A). The mRNA levels of β-tubulin increased by 5.76-fold (p < 0.01), 6.81-fold (p < 0.01), and 13.47-fold (p < 0.01) in the ES group, Nurr-1 group and ES + Nurr-1 group, respectively, when compared to that in the control group (Fig. 8B). The mRNA levels of NF-200 increased by 3.67-fold (p < 0.05) in the ES group, 4.03-fold (p < 0.01) in the Nurr-1 group, and 6.95-fold (p < 0.01) in the ES + Nurr-1 group when compared to that in the control group (Fig. 8C). In contrast, the mRNA levels of OCT-4 and GFAP in ADSCs dramatically decreased when transduced with Nurr-1 gene or/and electrically stimulated. The mRNA levels of OCT-4 in the ES group, Nurr-1 group, and ES + Nurr-1 group decreased by 41.2% (p < 0.05), 43.6% (p < 0.01), and 55.2% (p < 0.01) when compared to that in the control group (Fig. 8D). The mRNA levels of GFAP in the ES group, Nurr-1 group, and ES + Nurr-1 group decreased by 35.6% (p < 0.01), 30.5% (p < 0.05), and 47.8% (p < 0.01), respectively, when compared to that in the control group (Fig. 8E).

The mRNA levels of MAP-2, β-tubulin, NF-200, OCT-4, and GFAP in the control group, ES group, Nurr-1 transduction group, and ES and Nurr-1 transduction group; *p < 0.05, **p < 0.01.
Discussion
The present study investigated the possibility of promoting neuronal differentiation of ADSCs by ES and Nurr-1 gene transduction. We found that ES at high intensity (> 3 V/cm) resulted in ADSC apoptosis, while ES at 1 V/cm was beneficial for proliferation of ADSCs and increased their expression of neuron-associated genes, including MAP-2, NF-200, and β-tubulin. In addition, overexpression of the Nurr-1 gene was found to increase the neuronal differentiation rate of ADSCs, as well as the length of neurite-like processes, indicating that the Nurr-1 gene was capable of initiating neuronal differentiation in ADSCs. When ADSCs were first transduced with the Nurr-1 gene and then subjected to ES at 1 V/cm, the neuronal differentiation rate of ADSCs and the secretion of dopamine were further enhanced, suggesting that a combination of ES with Nurr-1 gene transduction could synergistically facilitate neuronal differentiation of ADSCs, especially the differentiation into dopaminergic neurons. All of these findings suggest the efficacy of ES and Nurr-1 gene transduction in promoting neuronal differentiation of ADSCs and highlight their potential application in the treatment of neurodegenerative diseases and neurotrauma.
As ES influences neuronal behavior, it is speculated that ES also plays a role in the epigenetic regulation that determines neuronal cell fate decisions. In this study, the conductive polypyrrole/chitosan membrane was used as a substrate to electrically stimulate ADSCs. In order to detect the optimal intensity of ES on ADSCs, flow cytometric analysis and CCK-8 analysis were carried out to verify it. Through the comparison in different groups, we confirmed that 1 V/cm was the optimal intensity of ES on ADSCs. However, some other researchers used different ES intensities in their studies (9,21,25,33). It is possible that the use of different cell types (NSCs, BM-MSCs, and so on) and different purposes (osteogenic, cardiomyogenic, neuronal differentiation) necessitate different ES intensities. Previous studies have shown that ES not only accelerates the speed of neurite outgrowth, but also guides the growth directions of regenerating nerve fibers (35,39). In addition, it has been shown that mild ES strongly influences embryonic stem cells to assume a neuronal fate. The electrically stimulated embryonic stem cells have the potential to differentiate into various types of neurons in vivo and contribute to the injured spinal cord as neuronal cells in adult mice (37). ES has also been shown to promote survival and differentiation of BM-MSCs (19). All these findings indicate that ES is effective in driving neuronal differentiation of stem cells. We also found that ES at 1 V/cm enhanced neuron-specific markers (MAP-2, NF-200, and β-tubulin) expression, as well as increased the length of neurite-like processes, suggesting that ES was also capable of promoting neuronal differentiation of ADSCs. In a recent report, ES has also been shown to induce the osteoblastic-like differentiation of ADSCs in osteoblast-inducing conditioned media (20), having little impact on neuronal differentiation in their report. Since the pattern and intensity of ES in the present study are similar to those in their report, it is possible that osteoblast-inducing conditioned media and long-term exposure to ES (> 13 days) result in a different phenomenon. In addition, when the intensity of ES increased to 3 V/cm or higher in the present study, the ratio of apoptosis cells significantly increased, suggesting that ES at higher voltage gradients would result in apoptosis. Therefore, ES at 1 V/cm was used in the differentiation study since it not only promoted the neuronal differentiation of ADSCs, but also had little effect on apoptosis.
Nurr-1 (NR4A2) is a transcription factor in the orphan nuclear receptor family. Previous studies in cell cultures in vitro have revealed the role of Nurr-1 in differentiation and morphological maturation of dopaminergic neurons (5,12,15,34). In many previous studies, the Nurr-1 gene has been used as a marker for dopaminergic neurons (4,18). It has been reported that mesencephalic dopaminergic neurons of Nurr-1-deficient mice differentiate and migrate abnormally at embryonic day (E15.5). These mice are hypoactive and die within 24 h of birth. It suggests that Nurr-1 plays an important role in differentiation and maturation of dopaminergic neurons (15). Most recently, overexpression of the Nurr-1 gene has been attempted to promote neuronal differentiation in BM-MSCs, and cells display neuron-like morphology and increased expression of neuronal markers after Nurr-1 gene transduction (24). It has also been reported that Nurr-1 upregulates the expressions of the neurogenic neurotrophins brain-derived neurotrophic factor (BDNF), glial cell line-derived neurotrophic factor (GDNF), neurotrophin-3 (NT-3), and neurotrophin-4/5 (NT4/5), and downregulates those of the gliogenic factors GFAP, leukemia inhibitory factor (LIF), and ciliary neurotrophic factor (CNTF), which creates a milieu that promotes neuron differentiation and inhibits astrocyte formation from embryonic cortical precursor cells (5). All those studies show the great potential of the Nurr-1 gene in promoting neuronal differentiation of stem cells. In the present study, we first tested the possible role of Nurr-1 gene transduction in neuronal differentiation of ADSCs. The transduction efficiency was up to 75.6% by using a lentiviral vector. We found that cells displayed neuron-like morphology and elevated expression of neuron-specific markers, including MAP-2, β-tubulin, and NF-200, suggesting that Nurr-1 gene is capable of initiating neuronal differentiation in ADSCs.
ES and Nurr-1 transduction are capable of promoting neuronal differentiation in ADSCs, respectively. We further tested if a synergistic effect existed when ES and Nurr-1 gene transduction were used in combination. The ADSCs were first transduced with the Nurr-1 gene to initiate neuronal differentiation and then subjected to ES at 1 V/cm. We found that the cells produced cell surface protrusions like filopodia, and the morphology closely resembled that of neurons (Fig. 5). However, even though these morphological differences suggest differentiation into a neuron-like phenotype, they were insufficient to predict the exact cellular state. Hence, traditional endpoint assays for lineage marker expression, like immunocytochemistry, were adopted to determine whether the change in morphology had indeed committed ADSCs to adopt neural-like phenotype. The fluorescence intensity of MAP-2- and β-tubulin-labeled cells was strongly detectable in Nurr-1-transduced ADSCs after ES. It is well known that MAP-2 is a family of heat-stable phosphoproteins. The functions of MAP-2 are mainly to reduce the critical concentration of tubulin required to polymerize microtubules and to maintain neuronal morphology by regulating the spacing of microtubules. It has been shown that MAP-2 is not restricted to expression in neurites, but is also expressed in the cell body (13,28). The results of the present study were in accord with these earlier findings, as we found that MAP-2 was mainly expressed in the neurites, and some were found in the cell body in the differentiated ADSCs (Figs. 3, 5, and 7). In addition, immunofluorescence was detected in few cells in the control group, which might have been due to spontaneous differentiation of ADSCs into neuronal fate. We also found that ES at 1 V/cm significantly increased the percentage of MAP-2- and β-tubulin-positive cells, as well as their expression level in differentiated cells, suggesting that ES further enhanced neuronal differentiation in Nurr-1-transduced ADSCs. In this study, the length of neurite-like processes in β-tubulin-positive cells was 174.2 ± 8.7 μm, which were longer than the neurite-like processes in a study by Pires et al. (25), similar to those in a study by Park et al. (24), and shorter than those in a study by Thrivikraman et al. (33). In addition, it was also found that the Nurr-1-transduced cells could secret dopamine, which was consistent with a previous study that demonstrated that Nurr-1 plays critical roles in midbrain dopamine neuron development (5). Furthermore, the dopamine secretion function was enhanced when the Nurr-1-transduced cells were subjected to ES, suggesting a synergistic role of ES and Nurr-1 gene transduction on dopaminergic neuronal differentiation.
Optimal ES and Nurr-1 gene transduction synergistically promote neuronal differentiation of ADSCs, which is of great significance in the treatment of neurodegenerative diseases in the CNS. Nurr-1 gene transduction is capable of initiating neuronal differentiation of ADSCs. The Nurr-1-transduced ADSCs may be subjected to in vitro or in vivo ES to further promote their differentiation into neuron lineage but not into glial lineage cells, which is beneficial for the repair of damaged tissues in the CNS and offers hope for achieving better functional recovery. Despite such a possibility in vivo, it should be pointed out that the cells differentiated from ADSCs might be mainly dopaminergic neurons due to the critical role of the Nurr-1 gene in differentiation and maturation of dopaminergic neurons and dopamine secretion in differentiated ADSCs. With increasing identification of critical genes governing differentiation and maturation of different types of neurons, differentiation of stem cells into specific neurons may become possible by using differentiation protocols involving transduction of different critical genes and ES, which may offer a new avenue for the treatment of various neurodegenerative disorders in the future.
In conclusion, ES at 1 V/cm and Nurr-1 transduction are both capable of promoting neuronal differentiation in ADSCs. In addition, a combination of ES with Nurr-1 gene transduction is able to facilitate neuronal differentiation of ADSCs synergistically. All of these findings highlight their potential application in the treatment of neurodegenerative diseases and neurotrauma.
Footnotes
Acknowledgments
This work was supported by grants from the National Natural Science Foundation of China (81201389 and 30973052), the National Basic Research Program of China (973 Program No. 2014CB542206), the Program for Changjiang Scholar and Innovative Research Team in University (IRT1053 and IRT13051), and A Foundation for the Author of National Excellent Doctoral Dissertation of PR China (201480). We thank technicians Ms. Jing Fan, Ms. Lifeng Lan, Ms. Ying Hao, and Ms. Ping Qu for their excellent technical assistance. The authors declare no conflicts of interest.