
Abstract
The corneal endothelium plays a primary role in maintaining corneal homeostasis and clarity and must be surgically replaced with allogenic donor corneal endothelium in the event of visually significant dysfunction. However, a worldwide shortage of donor corneal tissue has led to a search for alternative sources of transplantable tissue. Cultured human corneal endothelial cells (HCEnC) have been shown to restore corneal clarity in experimental models of corneal endothelial dysfunction in animal models, but characterization of cultured HCEnC remains incomplete. To this end, we utilized next-generation RNA sequencing technology to compare the transcriptomic profile of ex vivo human corneal endothelial cells (evHCEnC) with that of primary HCEnC (pHCEnC) and HCEnC lines and to determine the utility of cultured and immortalized corneal endothelial cells as models of in vivo corneal endothelium. Multidimensional analyses of the transcriptome data sets demonstrated that primary HCEnC have a closer relationship to evHCEnC than do immortalized HCEnC. Subsequent analyses showed that the majority of the genes specifically expressed in HCEnC (not expressed in ex vivo corneal epithelium or fibroblasts) demonstrated a marked variability of expression in cultured cells compared with evHCEnC. In addition, genes associated with either corneal endothelial cell function or corneal endothelial dystrophies were investigated. Significant differences in gene expression and protein levels were observed in the cultured cells compared with evHCEnC for each of the genes tested except for AGBL1 and LOXHD1, which were not detected by RNA-seq or qPCR. Our transcriptomic analysis suggests that at a molecular level pHCEnC most closely resemble evHCEnC and thus represent the most viable cell culture-based therapeutic option for managing corneal endothelial cell dysfunction. Our findings also suggest that investigators should perform an assessment of the entire transcriptome of cultured HCEnC prior to determination of their potential clinical utility for the management of corneal endothelial cell failure.
Keywords
Introduction
The human cornea comprises several anatomically distinct layers. The most posterior layer is the corneal endothelium, a monolayer of endothelial cells that separates the fibrous structure of the cornea from the aqueous humor. The endothelium is a mosaic of mitotically inactive endothelial cells (23,47) that demonstrate hexagonal morphology and strong basal–apical polarity, features conserved in various vertebrate species (8,56). The hexagonal morphology is an optimal cell geometry that maximizes cell packing (i.e., cell density), minimizes light scatter, and is an outcome of the interplay between distinct biomechanical forces and cellular processes (e.g., cell adhesion and proliferation) that may confer the most favorable physical properties to the endothelium (29). Functionally, the endothelium plays an important role in maintaining hydration of the corneal stroma by selective transport of solutes and water (3,20). Together, these characteristics enable the corneal endothelium to maintain the optical clarity of the cornea.
Corneal endothelial dysfunction secondary to inherited disorders of the endothelium is the most common indication for corneal transplantation in the US (12). Several clinically distinct corneal endothelial dystrophies have been described, but all are characterized by varying degrees of reduced endothelial cell density (1,55). The most severe cases demonstrate an inability of the endothelium to compensate for the loss of endothelial cell function, resulting in corneal edema and a significant reduction in vision. Surgical management is then required and is performed via selective replacement of the corneal endothelium with the posterior lamellar keratoplasty techniques Descemet stripping endothelial keratoplasty (DSEK) and Descemet membrane endothelial keratoplasty (DMEK). While it is generally agreed that these techniques provide superior outcomes when compared to full-thickness penetrating keratoplasty (PK) (10,30), a recent study demonstrated poorer endothelial cell survival for DSEK compared to PK (9). Additionally, surgical intervention carries inherent risks, and accelerated postoperative endothelial cell loss compared to normal corneas limits the survival of all corneal transplants. Moreover, there remains a significant worldwide shortage of suitable donor corneal tissue due to a myriad of cultural, social, religious, and legislative barriers to donation. Thus, there is great interest in alternative approaches to the management of corneal endothelial failure that would obviate the need to recover, process, and transplant a donor cornea with good endothelial viability for each individual with endothelial compromise. The isolation and establishment of donor cornea-derived primary human corneal endothelial cell (pHCEnC) cultures offers the potential for endothelial cells from a single donor to be transplanted into multiple recipients, which could significantly increase the number of both primary and repeat corneal transplants worldwide (21,28,39,44).
Prior to the use of cultured HCEnC for transplantation, these cells will need to be shown to possess similar morphologic and functional characteristics as in vivo HCEnC [with ex vivo HCEnC (evHCEnC) being used as a proxy]. Several HCEnC lines have been established with the expectation that their use in cell replacement therapy would be realized (2,17,26,46,50). These cell lines were reported to show prototypical HCEnC morphology and the expression of a limited number of genes believed to be functional biomarkers of corneal endothelium. Similarly, protocols for the isolation and maintenance of pHCEnC cultures have been established, and characterization of these cells (34,37,41,43,59), including their suitability for use in cell replacement therapy (44), has been performed. While several whole-genome expression studies of evHCEnC have been published (4–6,14–16,24), only limited transcriptomic analyses for pHCEnC (6) and HCEnC lines (19) have been reported. Therefore, we performed a comprehensive transcriptomic analysis of several HCEnC lines and pHCEnC to determine the validity of using cultured HCEnC as a model for in vivo endothelial cell gene expression and to determine the suitability of using cultured HCEnC for management of endothelial cell dysfunction.
Materials and Methods
Primary and Cell Line Cultures
Primary cultures of human corneal endothelial cells were isolated from six corneas (from both eyes of three donors) obtained from various eye banks affiliated with the Vision Share consortium of eye banks (Vision Share, Apex, NC, USA) (Table 1) using a technique that we have adapted for ex vivo donor tissue (14,45). Stripped Descemet membrane with attached endothelium was transferred into complete F99 medium [1:1 ratio of Ham's F-12 nutrient mixture and M199 medium (Life Technologies, Carlsbad, CA, USA), 5% (v/v) fetal bovine serum (Atlanta Biologicals, Flowery Branch, GA, USA), 20 μg/ml ascorbic acid (Sigma-Aldrich, St. Louis, MO, USA), 20 μg/ml insulin (Life Technologies), 10 ng/ml basic fibroblast growth factor (bFGF; PeproTech, Inc., Rocky Hill, NJ, USA), 100 U/ml penicillin, and 100 μg/ml streptomycin (Life Technologies)] and allowed to acclimate to the new growth conditions overnight. The endothelial cells were subsequently detached from Descemet membrane with 0.25% trypsin-EDTA (Life Technologies) for 5 min followed by trituration via gentle passing through a 1-ml pipette tip 10 times. Single cell suspensions of pHCEnC and the corneal endothelial cell lines HCEnC-21T, HCEC-12 (German Collection of Microorganisms and Cell Cultures GmbH, Braunschweig, Lower Saxony, Germany), and HCEC-B4G12 (German Collection of Microorganisms and Cell Cultures) were grown on tissue culture-treated, nonpyrogenic polystyrene plastic coated with 40 μg/cm2 chondroitin sulfate A (Sigma-Aldrich) and 40 ng/cm2 laminin (Sigma-Aldrich) in phosphate-buffered saline (PBS) for 2 h (2,46,52). The pHCEnC, HCEnC-21T, and HCEC-12 were grown in F99 medium, while the HCEC-B4G12 was maintained in human endothelial-SFM (Life Technologies) supplemented with 10 ng/ml bFGF. All cells were maintained at 37°C in 5% CO2. When the cells achieved an intact and confluent monolayer, they were incubated overnight in serum-free F99 medium containing only ascorbic acid and antibiotics (pHCEnC, HCEnC-21T, and HCEC-12) or in human endothelial-SFM containing antibiotics (HCEC-B4G12). Cultures of pHCEnC were collected for experiments at passage one.
Donor Tissue Information

OU, oculus uterque; sx, surgery; N.D., neurodegenerative disease; N/A, not applicable.
Number of days postmortem before RNA was extracted, protein lysates were prepared, or primary cells were cultured.
Total RNA Isolation
Ten corneas from seven donors were obtained from various eye banks affiliated with the Vision Share consortium of eye banks (Table 1). Descemet membrane (with the attached endothelial cells) was stripped from the donor corneas in preparation for RNA isolation. Where applicable, donor corneas from a single donor were combined into a single tube. Homogenization and total RNA isolation from evHCEnC and cultured cells were performed using TRI Reagent (Life Technologies). TRI Reagent RNA preparations were subsequently purified with the RNeasy Clean-Up Kit (Qiagen, Valencia, CA, USA). The integrity of the isolated RNA was analyzed using the Agilent 2100 Electrophoresis Bioanalyzer System (Agilent Technologies, Inc., Santa Clara, CA, USA), with RNA integrity numbers of 8.1, 8.6, and 9.1 obtained for the three evHCEnC samples.
Next-Generation RNA Sequencing (RNA-seq)
Total RNA was submitted to the UCLA Clinical Microarray Core for processing and sequencing. Briefly, enrichment for poly(A) RNAs was performed using the NEBNext Poly(A) mRNA Magnetic Isolation Module (New England BioLabs, Inc., Ipswich, MA, USA), followed by library preparation using the PrepX Complete ILM DNA Library Kit (WaferGen Biosystems, Inc., Fremont, CA, USA). High-throughput sequencing was performed on the Illumina Hi-seq 2500 (Illumina, Inc., San Diego, CA, USA). Single-end 50-bp reads were obtained and compiled in FASTQ files. A mean of 12,330,531 reads per sample (range 9,497,109–15,392,285 reads) was obtained, which is sufficient for gene expression analysis (31). The FASTQ files and quantitative results are available from the GEO DataSets database [accession number GSE65991; National Center for Biotechnology Information (NCBI), Bethesda, MD, USA].
Next-Generation Sequencing Data Analyses
The FASTQ files containing the RNA-sequencing data were uploaded to the Partek Flow servers (Partek Incorporated, Chesterfield, MO, USA) for alignment to the hg38 genome using the TopHat aligner, which output the results in BAM files. The BAM files were uploaded to the Partek Genomics Suite software, and the reads and read-depth were transformed to reads per kilobase per million (RPKM) values, a normalized quantity that accounts for gene size. These data were annotated using the Ensemble 77 transcript database. Principle component analysis (PCA) and hierarchical clustering were performed in the Partek Genomics Suite software. The gene expression threshold level for positive detection of a transcript was set to a value of 1 RPKM. Differential expression analysis was performed and p values calculated with a one-way ANOVA model using method of moments. Genes expressed specifically in evHCEnC were identified by their absence in ex vivo human corneal epithelial cells (evHCEpC) and ex vivo human corneal fibroblasts cells (evHCFC) and meeting the following statistical criteria: fold-change ≥ 5 and a false discovery rate (step-up) adjusted value of p ≤ 0.05.
Quantitative Polymerase Chain Reaction
Quantitative polymerase chain reaction (qPCR) was used to validate the level of expression as determined by RNA-seq for genes associated with corneal endothelial cell function (AQP1, ATP1A1, CD200, CDH2, GPC4, and ZO1) and the corneal endothelial dystrophies (AGBL1, COL8A2, LOXHD1, SLC4A11, TCF4, and ZEB1). Complementary DNA (cDNA) was synthesized from 100 ng of total RNA isolated from evHCEnC, pHCEnC, and the HCEnC-21T, HCEC-12, and HCEC-B4G12 cell lines using the SuperScript III First-Strand kit (Life Technologies). Subsequently, qPCR was performed on the LightCycler 480 System (Roche, Basel, Switzerland) using the KAPA SYBR FAST qPCR Kit (Kapa Biosystems, Wilmington, MA, USA) and transcript-specific oligonucleotide primers that were obtained from the Harvard Primer Bank database (http://pga.mgh.harvard.edu/primerbank/index.html) (Table 2) (48,49,54). Reaction conditions were as previously described (27). Relative expression was obtained by comparison to the housekeeping gene RAB7A and calculated using the comparative Ct (2–ΔΔCt) method (32). Relative expression levels were plotted as 2–ΔCt values.
Quantitative PCR Oligonucleotides

Western Blotting
Four corneas from three donors were used for Western blotting (Table 1). Protein lysates from the five different HCEnC sources were prepared by homogenizing tissue in radioimmunoprecipitation assay (RIPA) buffer [100 mM Tris pH 7.6 (Sigma-Aldrich), 150 mM NaCl (Sigma-Aldrich), 1 mM EDTA (Sigma-Aldrich), 1% deoxycholic acid (Sigma-Aldrich), 1% Triton X-100 (Sigma-Aldrich), 0.1% SDS (Sigma-Aldrich)] and supplemented with fresh 20 mM phenylmethylsulfonyl fluoride (PMSF), 50 mM sodium fluoride (NaF), and protease and phosphatase inhibitors (Life Technologies). A total of 5 μg of whole cell lysate was resolved on a precast NuPAGE Novex 4–12% gradient gel (Life Technologies) by electrophoresis at 40 mA per gel. Following overnight electrotransfer to Immobilon-P (Millipore, Billerica, MA, USA) polyvinylidene fluoride (PVDF) membranes, the membranes were then blocked with 5% milk in TBS-T [100 mM Tris-HCl (Sigma-Aldrich), pH 7.5, 90 g/L NaCl (Sigma-Aldrich), and 1% Tween 20 (Sigma-Aldrich)] for 1 h at room temperature (RT). Incubation with primary antibodies (Table 3) was performed overnight at 4°C in 0.1% milk in TBS-T followed by three washes in TBS-T, then 1-h incubation at RT with peroxidase-coupled secondary antibody. The immunocomplex was detected using Luminata Forte Western HRP Substrate (Millipore) and visualized on Amersham Hyperfilm ECL (GE Healthcare Bio-Sciences Corp., Piscataway, NJ, USA). Detection of the RAB7 protein, a housekeeping gene that regulates vesicular transport, was used as a loading control (11).
Antibodies Used for Immunoblotting

Statistical Analyses
The mean and standard error of the mean (SEM) were graphed for each of the transcript abundance values determined by RNA-seq (RPKM) and qPCR (2–ΔCt). Statistical testing was performed using one-way ANOVA followed by a post hoc Dunnett's multiple comparison test. Dunnett's multiple comparison test was used to detect a significant (p ≤ 0.05) difference in the mean expression level for each gene in the cultured HCEnC groups versus the mean expression level in evHCEnC. All statistical analyses were performed using a minimum of n = 3, unless otherwise stated. GraphPad Prism version 5.0f (GraphPad Inc., La Jolla, CA, USA) for Mac was used for generating graphs and for statistical analysis.
Results
Cultured HCEnC Demonstrate Prototypical Morphology
The cultured HCEnC were imaged by phase-contrast microscopy before being collected for RNA and protein isolation (Fig. 1). While in vivo corneal endothelium is comprised of flat cells with primarily hexagonal morphology, the pHCEnC and cell lines demonstrated fewer hexagonal cells and flat (pHCEnC) or cobblestone (HCEC-12 and HCEC-B4G12) morphology. These results are consistent with published reports for the pHCEnC and the two HCEnC cell lines (2,46,52).

Morphology of cultured HCEnC visualized using phase-contrast microscopy. (A) Specular microscopic imaging of human corneal endothelium demonstrates a uniform mosaic of hexagonal cells. (B) pHCEnC demonstrated primarily polygonal rather than hexagonal morphology (representative of 11 primary cultures). The cell lines, (C) HCEnC-21T, (D) HCEC-12, and (E) HCEC-B4G12, also demonstrated a polygonal morphology.
Multidimensional Analyses of Transcriptome Data Sets
PCA and hierarchical clustering (HC) were performed on RNA-seq data sets from HCEnC (Fig. 2). Gene expression data obtained by RNA-seq technology demonstrated a strong association among replicates of the same RNA source by PCA. The samples clustered into distinct groups, which is illustrated along the first three principle component axes [PC #1 (26.3%), PC #2 (16.7%), and PC #3 (11.2%)] and represent the majority of the variation (54.1%) in the samples (Fig. 2A). pHCEnC samples showed a close relationship with evHCEnC samples, while the immortalized cells demonstrated a more distant relationship. Similarly, hierarchical clustering of the HCEnC groups also demonstrated a strong association among replicates of the same RNA source (Fig. 2B). Because the HCEC-B4G12 cell line is a clone of the HCEC-12 cell line, they showed a close relationship by both PCA and HC.

Multidimensional analysis shows distinct clustering of the five HCEnC groups by RNA source. PCA and HC were used to determine the relationships between the transcriptome data sets from the different HCEnC groups. (A) PCA of the transcriptomic data sets demonstrated that samples clustered into distinct groups defined by their RNA source. (B) HC of the HCEnC groups using the transcriptome data sets demonstrated a similar association pattern observed with PCA.
Comparative Analysis of Whole-Genome Gene Expression in evHCEnC Versus Cultured HCEnC
To determine the genes that are shared and unique between evHCEnC and the cultured HCEnC groups, we defined any gene across the genome with a mean RPKM value ≥ 1 as being expressed. These expressed genes were compiled into gene lists for each of the HCEnC groups (data not shown). Subsequently, the gene lists for the cultured HCEnC were each compared separately to the gene list for the evHCEnC (Fig. 3 and Table 4). Compared with evHCEnC, pHCEnC demonstrated the greatest percentage of commonly expressed genes (88.3%; 11,684/13,234), followed by HCEnC-21T (86.3%; 11,424/13,234), HCEC-12 (84.1%; 11,133/13,234), and HCEC-B4G12 (83.5%; 11,053/13,234) (Fig. 3). Analysis of unique genes in the cultured cells showed that in pHCEnC de novo gene expression or the change in total genes expressed was 12.0% (1,583/13,234) compared with the total genes expressed in evHCEnC, while a de novo gene expression of 24.0% (3,172/13,234), 19.8% (2,620/13,234), and 19.4% (2,571/13,234) was observed for HCEnC-21T, HCEC-12, and HCEC-B4G12, respectively (Table 4). In addition, the total number of unique genes (unique to either evHCEnC or to each HCEnC group) is lowest in pHCEnC (21.1%; 3,133/14,817) and about the same (approximately 30%) for each of the HCEnC lines.

Gene expression comparison between evHCEnC and cultured HCEnC identifies common and distinct gene expression patterns. Genes were compiled in a list for each of the HCEnC groups that met the criterion of being expressed at a level ≥ 1 RPKM. Comparisons were made between the genes expressed in evHCEnC and in each of the cultured HCEnC groups: (A) pHCEnC, (B) HCEnC-21T, (C) HCEC-12, and (D) HCEC-B4G12. Percentage = (number of common genes)/(number of evHCEnC expressed genes) × 100.
Comparative Analysis of Genes Expressed in the HCEnC Groups

Gene expression is defined as the genes whose transcript levels were at or above 1 RPKM.
Percentage = (genes unique to HCEnC group)/(genes expressed in evHCEnC) × 100.
Percentage = (genes unique to evHCEnC)/(genes unique to evHCEnC + total genes expressed in HCEnC group) × 100.
Percentage = (genes unique to HCEnC group)/(genes unique to HCEnC group + total genes expressed in evHCEnC) × 100.
Identification of evHCEnC-Specific Genes by Absence of Expression in evHCEpC and evHCFC
Endothelium-specific gene expression was determined for evHCEnC (Table 5). All three main corneal cell types (epithelial, fibroblast, and endothelial) were isolated from ex vivo cornea tissue, and the transcriptome profile for each cell type was obtained (data not shown). The genes specific to evHCEnC were determined by 1) filtering out genes with an RPKM value below 1; 2) filtering out genes expressed (> 1 RPKM) in evHCEpC and/or evHCFC); and 3) performing differential gene expression analysis under the criteria described above. One hundred thirty-eight genes were identified as specific to evHCEnC, of which 77% (106/138) were protein coding (Table 5).
Expression of 138 evHCEnC-Specific Genes in Cultured HCEnC

Genes (26) expressed in all HCEnC groups are shown in bold.
Genes with a mean RPKM value of ≥ 1 (< 1 in evHCEpC and evHCFC) and a fold change ≥ 5 compared with evHCEpC and evHCFC were considered to be specific to evHCEnC.
Genes (34) not expressed in any of the cultured HCEnC groups.
Analysis of evHCEnC-Specific Gene Expression in Cultured HCEnC
The percentage of the evHCEnC-specific genes expressed in each of the cultured HCEnC groups was determined by gene list comparison and hierarchical clustering analysis (Fig. 4). Comparison of the 138 evHCEnC-specific genes with the expressed genes (> 1 RPKM) in each of the cultured cells demonstrated that 67% (93) of the 138 evHCEnC-specific genes were expressed in pHCEnC, 38% (53/138) were expressed in HCEnC-21T, 30% (41/138) were expressed in HCEC-12, and 28% (39/138) were expressed in HCEC-B4G12 (Fig. 4A and Table 5). Nineteen percent (26/138) of the evHCEnC-specific genes were expressed in all of the cultured HCEnC groups, while 25% (34/138) were not expressed in any of the cultured HCEnC groups (Fig. 4A and Table 5).

Expression of the 138 evHCEnC-specific genes in cultured HCEnC. (A) Comparison of the genes specific to evHCEnC with the expressed genes in four different cultured HCEnC groups. Twenty-six genes (large bold font, center) were common to all five HCEnC groups, and 34 (large bold font, lower right) genes were only expressed in the evHCEnC group (Table 5). The numbers that are of medium bolded font represent those expressed in evHCEnC and at least one of the cultured HCEnC groups. The numbers that are small and not bold are those that are expressed in the corresponding cultured HCEnC group(s) but are otherwise not a focus of the current study. (B) Hierarchical clustering of the HCEnC groups using the 138 evHCEnC-specific genes demonstrated distinct expression profiles in cultured HCEnC.
HC analysis of the expression profile of the 138 evHCEnC-specific genes compared to the expression profile of these genes in primary and immortalized cells was performed as well (Fig. 4B). pHCEnC demonstrated an expression profile that was more closely related to evHCEnC than those of the cell lines, reflecting the results obtained by gene list comparison (Fig. 4B). Of the immortalized cells, HCEnC-21T demonstrated an expression profile that was more closely related to evHCEnC than the HCEC-12 and HCEC-B4G12 (Fig. 4B).
Evaluation of the Expression of Genes Associated with HCEnC Function or Disease
Genes Associated with Corneal Endothelial Cell Function
The transcription of six genes that are considered to be functional markers of HCEnC (AQP1, ATP1A1, CD200, CDH2, GPC4, and ZO1) was initially assessed by RNA-seq (Fig. 5), and subsequently validated by qPCR (Fig. 5) and Western blotting (Fig. 6A). In evHCEnC, the expression of AQP1, ATP1A1, CDH2, GPC4, and ZO1 was detected above the threshold of 1 RPKM by RNA-seq, with CD200 being detected below this threshold. While the expression of all six genes was detected by qPCR, CD200 was detectable only at relatively high cycles (~33 cycles), suggesting weak or no expression. Western blotting demonstrated detectable levels of AQP1, ATP1A1, CDH2, GPC4, and ZO1 but failed to detect CD200. In pHCEnC, transcripts for all of the functional marker genes were detected by RNA-seq, with expression levels of CD200, CDH2, and GPC4 significantly greater and ATP1A1 significantly less than that in evHCEnC. Quantitative PCR confirmed statistically significant differential expression for ATP1A1, CD200, and GPC4, but not for CDH2. Western blotting demonstrated detectable levels of all six encoded proteins. In HCEnC-21T, the expression of ATP1A1, CDH2, GPC4, and ZO1 was detected above the threshold of 1 RPKM by RNA-seq, with CD200 and AQP1 being detected below this threshold. Only ATP1A1 showed a significant difference in expression compared with that in evHCEnC, which was confirmed by qPCR. Although the expression of AQP1 was approximately 1,000-fold less than in evHCEnC, the difference was not statistically significant (although it was by qPCR). In HCEC-12 and HCEC-B4G12, the expression of ATP1A1, CDH2, and ZO1 was detected by RNA-seq, while GPC4 demonstrated detectable levels (> 1 RPKM) only in HCEC-B4G12, and AQP1 and CD200 were not detected in either cell line. The expression levels of ATP1A1 were significantly lower and ZO1 significantly greater than in evHCEnC for both HCEC-12 and HCEC-B4G12, while the expression level for CDH2 was significantly lower in HCEC-B4G12 only. Quantitative PCR confirmed significant differential expression for ATP1A1 in both HCEC-12 and HCEC-B4G12 and CDH2 in HCEC-B4G12 but not ZO1 in either cell line. Western blotting demonstrated detectable levels of ATP1A1, CDH2, and ZO1 in each cell line, but no detection of AQP1, CD200, or GPC4 in any of the three cell lines.

Transcript abundance of genes associated with HCEnC function was measured using RNA-seq and validated by qPCR. The dashed line in the RNA-seq graph for CD200 denotes the RPKM threshold (RPKM≥ 1) above which a gene is considered expressed. The evHCEnC are represented as black bars (n = 4), the pHCEnC are represented as white bars (n = 3), and the three cell lines are represented as gray bars (n = 3). Error bars represent mean ± SEM of RPKM (RNA-seq) or 2–ΔCt (qPCR) values; *p≤0.05, **p≤0.01, ***p≤0.001.

Proteins encoded by the genes associated with HCEnC function and corneal endothelial dystrophies were assessed by Western blotting. (A) Proteins from 5/6 (AQP1, ATP1A1, CDH2, and ZO1), 6/6 (AQP1, ATP1A1, CDH2, GPC4, and ZO1), and 3/6 (ATP1A1, CDH2, and ZO1) genes associated with HCEnC function were detected in evHCEnC, pHCEnC, and the three HCEnC lines, respectively. (B) Proteins from 4/4 (COL8A2, SLC4A11, TCF4, and ZEB1), 3/4 (COL8A2, SLC4A11, and ZEB1), 1/4 (ZEB1), and 2/4 (COL8A2 and ZEB1) genes associated with corneal endothelial dystrophies were detected in evHCEnC, pHCEnC, HCEnC-21T, and the two (HCEC-12 and HCEC-B4G12) related cell lines, respectively. These are representative blots from three independent samples for each HCEnC group (Table 1). The detection of the RAB7 protein was used as a loading control.
Genes Associated with Corneal Endothelial Dystrophies
The transcription of genes associated with corneal endothelial dystrophies (AGBL1, COL8A2, LOXHD1, SLC4A11, TCF4, and ZEB1) was assessed by RNA-seq (Fig. 7) and the levels validated by qPCR (Fig. 7) and Western blotting (Fig. 6B). In evHCEnC, the expression of four of the genes (COL8A2, SLC4A11, TCF4, and ZEB1) was detected by RNA-seq above the 1-RPKM threshold. Expression of each of the four genes was confirmed with qPCR and Western blotting. The AGBL1 transcript was not detected by either RNA-seq or qPCR, while transcript levels for LOXHD1 were only detected at an average cycle of ~38 in two of the three samples. As neither gene was detected by qPCR, Western blotting for the encoded proteins was not performed. In pHCEnC, transcripts for COL8A2, SLC4A11, TCF4, and ZEB1 were detected by RNA-seq, with expression levels of TCF4 being significantly greater and SLC4A11 significantly less than in evHCEnC. While these results were confirmed with qPCR, Western blotting failed to detect TCF4. In HCEnC-21T, HCEC-12, and HCEC-B4G12, RNA-seq demonstrated expression for SLC4A11 and ZEB1 in all three cell lines, COL8A2 in HCEC-12 and HCEC-B4G12, and TCF4 expression in HCEnC-21T and HCEC-12. AGBL1 and LOXHD1 were not expressed in any of the three cell lines. The expression levels of COL8A2, SLC4A11, and TCF4 were significantly lower and ZEB1 significantly greater in all three cell lines compared with evHCEnC, which was confirmed by qPCR. Western blotting demonstrated detectable levels of COL8A2 in HCEC-12 and HCEC-B4G12 and ZEB1 in all three cell lines.
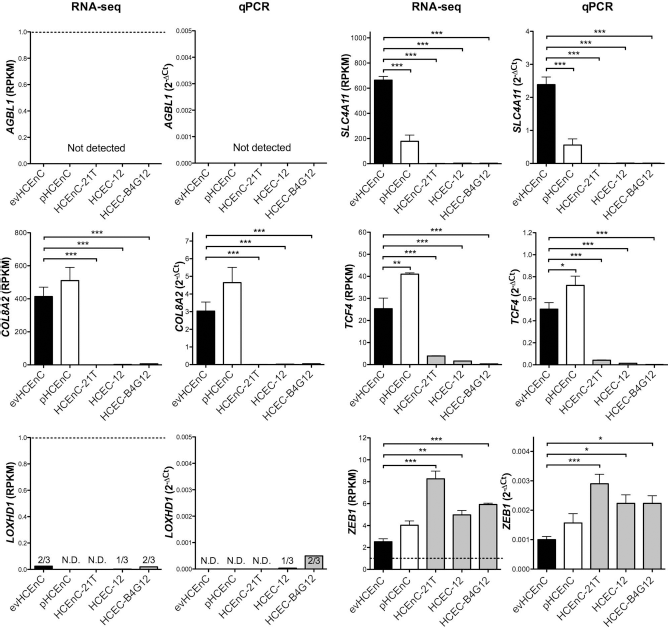
The transcript abundance of genes associated with corneal endothelial dystrophies was measured using RNA-seq and validated by qPCR. The dashed line in the RNA-seq graph for AGBL1, LOXHD1, and ZEB1 denotes the RPKM threshold (RPKM≥1) above which a gene is considered expressed. Statistical testing was performed using one-way ANOVA followed by a post hoc Dunnett's multiple comparison test. The evHCEnC are shown as black bars (n = 4), the pHCEnC are represented as white bars (n = 3), and the three cell lines are represented as gray bars (n = 3). Error bars represent mean ± SEM of RPKM (RNA-seq) or 2–ΔCt (qPCR) values; *p≤0.05, **p≤0.01, ***p≤0.001.
Discussion
The investigation of the functional mechanisms responsible for normal and pathological corneal endothelial cell function remains hampered by the lack of available robust techniques in culturing corneal endothelial cells. The recent establishment of corneal endothelial cell lines using the SV40 TAg (HCEC-12 and HCEC-B4G12) and telomerase expression (HCEnC-21T) for immortalization has presented a unique opportunity for investigators to perform biologically significant experiments in easy-to-maintain cell lines (2,46,52). The initial characterization of these cell lines was performed by assessing the expression of genes considered markers of endothelial cell function, such as AQP1, ATP1A1, CDH2, and ZO1. However, we demonstrate significant differences in the expression of these genes and the proteins they encode in pHCEnC and HCEnC lines compared to their expression in evHCEnC. Thus, while cell lines remain a valuable tool in the absence of robust primary cell culturing techniques (7), investigators should be aware of these differences and plan experiments using these cell lines accordingly.
More recently, GPC4 and CD200 were reported as distinctly expressed only in the corneal endothelium (5), leading to interest in their use as corneal endothelial cell markers. However, we found that CD200 and its encoded protein were not detected in evHCEnC or any of the cell lines but was detected in pHCEnC. In addition, GPC4 expression in evHCEnC was significantly lower than in pHCEnC by both RNA-seq and qPCR, with no GPC4 detected by Western blot in the cell lines. There are myriad reasons for these differences, but they may be due to differing experimental protocols, including the age of the cornea donor, tissue processing techniques, and the method utilized to detect expression. Because of these conflicting results, further investigation is warranted to determine whether CD200 is in fact expressed in the corneal endothelium. Similarly, the genes implicated as playing a pathogenic role in the corneal endothelial dystrophies demonstrated significant differences in expression between the cultured and evHCEnC. Subsequent characterization of pHCEnC and endothelial cell lines will involve determining whether these cells possess any aberrant characteristics that could complicate elucidation of the molecular basis of HCEnC function and dysfunction. For example, an investigator interested in the role of AQP1 in corneal endothelial cell function would be unable to utilize HCEC-12, HCEC-B4G12, and HCEnC-21T given the absence of AQP1. Thus, it is not always possible to extrapolate from what is observed in cultured endothelial cells what would be expected in vivo, which has important implications in terms of the research utility and therapeutic potential of cultured HCEnC.
Our results indicate that the transcriptome of pHCEnC is more similar to that of evHCEnC (and thus presumably to the transcriptome of in vivo HCEnC) than are the transcriptomes of the endothelial cell lines. However, use of pHCEnC for research and for potential clinical applications is restrained by phenotypic alterations and limited growth using commonly employed cell culturing techniques. Identifying the growth conditions that support the growth of cells with a transcriptome profile similar to evHCEnC will provide researchers with a more accurate model of in vivo HCEnC and a potential source of endothelial cells for management of endothelial dysfunction. Optimization of HCEnC culturing techniques should take into consideration several anatomic and physiological features of in vivo HCEnC (60), such as 1) adherence to a complex milieu of extracellular matrix proteins (13,18,22,38,40,51,57), 2) contact with physiological proteins and other factors present in aqueous humor (25,33,36,42,53), 3) exposure to appropriate biomechanical forces (35,40,57), and 4) maintenance of a confluent semipermeable layer of cells with strong apicobasal polarity. Replication of each of these features in a single culturing method would be challenging but would represent a significant advance in the development of cultured HCEnC that closely resemble in vivo HCEnC.
In addition, our findings caution researchers against reaching the conclusion that the expression of a few functional marker genes may be relied upon to characterize cultured HCEnC. This point is particularly salient given the recent report by Chng et al. suggesting that a panel of three genes (COL8A2, SLC4A11, and CYYR1) is sufficient to ascertain the clinical viability of stem cell-derived HCEnC (6). They identified CYYR1 as the most robust marker for ascertaining the HCEnC type, but our analysis did not confirm this since we observed CYYR1 expression in evHCFC at an average level of 2.4 RPKM (above our 1 RPKM expression threshold) as well as evHCEnC (13.6 RPKM). A more sound expression-based assessment may include each of the 106 protein-coding genes specific to evHCEnC (Table 5) or the 22 protein-coding genes specific to evHCEnC that are expressed in pHCEnC and each of the three endothelial cells lines tested. A more recent study identified five genes (CLRN1, MRGPRX3, HTR1D, GRIP1, and ZP4) that demonstrated high HCEnC specificity, but our analyses identified only MRGPRX3 and GRIP1 as expressed only in evHCEnC (58).
We have identified a set of evHCEnC-specific genes that can be utilized in a panel for ascertaining the nature of cultured HCEnC. We expect that some of these genes may be removed from the panel due to inconsistent results being obtained in future studies. However, we believe that the use of such a panel is essential to more thoroughly characterize cultured HCEnC than is possible using only a few functional markers of HCEnC. An expression panel including the 106 protein-coding genes specific to evHCEnC represents only about 0.5% of known protein-coding genes and thus represents a reasonable balance between being both comprehensive and specific. Although a single (or several) biomarker is informative and valuable in, for example, targeted gene therapy or antibody-mediated purification of HCEnC from a mixed population of cells (i.e., positive selection), we do not believe that this number of biomarkers is sufficient to accurately characterize cultured HCEnC for use in cell transplantation therapy. Thus, the identification of these HCEnC-specific genes is an important step in the characterization of cultured HCEnC and validation of their experimental and potential clinical utility.
Footnotes
Acknowledgments
We acknowledge Dr. Ula V. Jurkunas for kindly providing us with the HCEnC-21T. Support provided by National Eye Institute grants R01 EY022082 (A.J.A.) and P30 EY000331 (core grant), the Walton Li Chair in Cornea and Uveitis and an unrestricted grant from Research to Prevent Blindness. The authors declare no conflicts of interest.