
Abstract
Skin diseases, including hair-related diseases and neoplasia, are a major public health problem. While their prevalence is increasing, their treatment options are limited. Researchers have tried to investigate the genes and signal pathways underlying hair follicles (HFs) to develop genetically targeted therapies through microarrays, which represent an appropriate modality for the analysis of small genomes. To enable the comprehensive transcriptome analysis of large and/or complex transcriptomes, we performed RNA-seq using next-generation sequencing (NGS). We isolated interfollicular keratinocytes (IFKs), HFs, and dermal fibroblasts including dermal papilla cells (DFs-DPCs) from normal C57BL/6 murine skin, transplanted combinations of these samples into nude mice, and followed the mice over time. Sustained hair growth was supported by HFs and DFs-DPCs. We then investigated the pathways and the relevant gene ontology associated with any identified differentially expressed genes (DEGs). In addition, in the culture and flow cytometry (FCM), the HFs had a more quiescent cell cycle pattern than did the IFKs and DFs-DPCs. Therefore, the representative cell cycle-related gene expression of IFKs, HFs, and DFs-DPCs was analyzed by NGS. Our study will allow researchers to further investigate the potential interactions and signaling pathways that are active in HF-related diseases and cancer and may aid in future bioengineering applications.
Keywords
Introduction
Hair follicles (HFs) are a self-renewing reservoir of multipotent stem cells within a bulge structure. However, HFs are also a source of neoplasia formation. The genes and signaling pathways that contribute to alopecia and skin cancer have been investigated for many years (20,33, 39,41).
Microarrays are generally used for transcriptome analysis, but they have several shortcomings, including cross-hybridization and the incomplete mapping of the large and complex mouse and human transcriptomes (6,14). Therefore, we utilized an Illumina HiSeq 2000 to perform next-generation sequencing (NGS) for the comprehensive transcriptome analysis of poly(A)-selected RNA from C57BL/6 tissue. This was accomplished by RNA-seq with a tac count comparison (TCC)-DESeq based on the differentially expressed gene (DEG) elimination strategy (DEGES) for accurate normalization and to remove any potentially biased DEGs prior to data normalization in the two-group data set (60).
Here we investigated the DEGs in HFs compared with interfollicular keratinocytes (IFKs) in the keratinocyte lineage [and in HFs compared to dermal fibroblast including dermal papilla cells (DFs-DPCs) as the dermal substructure] using NGS. We considered pathways for these genes simultaneously and confirmed the long-term synergistic combination of these cell samples in vivo. Importantly, IFKs, HFs, and DFs-DPCs form the major skin-substructure. Incidentally, we observed that the overall appearance of cultured IFK and HF keratinocytes grew differently over time. Therefore, our study has identified informative genes among the representative cell cycle-related genes using NGS. To enable a parallel comparison of the IFK and HF keratinocyte lineages, we used anagen phase HFs, in which there are enough transient amplifying (TA) cells that are evenly distributed along the HF bud (transient cells progressing from precursors to differentiated cells). In addition, a highly prevalent HF-related skin disease has been studied with anagen phase HFs, and they are considered to play a major role in the disease's pathogenesis (7,13,19,21,23,34,43,45,46,49,56).
It is our hope that this work provides valuable information, investigation of transcriptional gene profiling in normal murine hair follicular substructures using NGS to provide potential insights into skin disease, that will allow researchers to distinguish gene profiling more accurately between IFKs and HFs of skin keratinocytes and to better understand neoplastic skin diseases, including basal cell carcinoma (BCC).
Materials and Methods
Cell Isolation and Transplantation
To isolate IFKs, HFs, and DFs-DPCs, we followed the protocol of Lichti et al. (35). We organized and arranged these protocols as follows: we used full-thickness dorsal skin (2 cm × 1.5 cm) pooled from postnatal day (PND) 2 C57BL/6 mice (Koatech, Pyeongtaek, Korea) (eight mice from each three different mothers).
The suspension medium consisted of base medium with antibiotic–antimycotic (Gibco, Gaithersburg, MD, USA) supplements, but not growth factor supplements (which were used only for cell culture); defined keratinocyte-SFM medium (K-medium) (Gibco) was used as the base medium for IFKs and HFs, and high glucose DMEM (D-medium) (Gibco) was used as the base medium for DFs-DPCs.
The Separation of the Epidermis and the Dermis
We observed no keratin formation in the hair root sheath in full-thickness skin from C57BL/6 mice on PND 2. C57BL/6 mice were sacrificed on PND 2 using a CO2 euthanizing chamber. The mice were immersed twice in Betadine solution (Korea Pharma, Seoul, Korea) for 2 min each, followed by 70% ethanol for 2 min each, and then placed on ice. The whole skin from the body was gently pulled away using sterile forceps (Hebu Medical GmBH, Tuttlingen, Germany) in a continuous motion. We spread the skin completely flat without curling and placed the stretched skin on a dish (BD Biosciences, San Jose, CA, USA). This dish was incubated in a refrigerator for 2 h. The stretched flat skin was lifted and transferred to the freshly thawed, cold 0.25% trypsin without EDTA (Cellgro; Mediatech, Manassas, VA, USA) in a new dish, and the dermis side of the hanging skin touched the trypsin and floated flat. The skin was then incubated at 4°C overnight. In a laminar-flow hood, the trypsin-incubated skin was transferred to the inner surface of the dish lid, with the epidermis side down. Then the dermis was lifted straight up from the epidermis, while the epidermis was held down. Thus, the epidermis and the dermis were separated, and each layer was transferred to cold suspension defined keratinocyte-SFM medium (K-medium) (Gibco) or high-glucose DMEM (D-medium) (Gibco), respectively.
The Isolation of IFKs From the Separated Epidermis
The collected epidermis was minced with scissors (Fine Science Tools, North Vancouver, Canada) until the pieces were small enough to enter the tip of a 10-ml pipette. The resulting suspension was triturated by pipetting up and down more than 10 times. This suspension was transferred to a conical tube (BD Biosciences), leaving most of the stratum corneum sheets behind. The suspension was then centrifuged at 150 × g for 5 min at 4°C. The supernatant, including the floating stratum corneum, was carefully aspirated. The pellet was then resuspended and filtered through a 100-μm cell strainer (BD Falcon, BD Biosciences, San Jose, CA, USA). The filtered suspension was centrifuged at 20 × g for 3 min at 4°C to pellet the epidermal HF buds. The pellet was resuspended and centrifuged again at 20 × g for 3 min. The combined supernatants represented IFKs, which were primary keratinocytes from which the epidermal HF buds were removed.
The Isolation of DFs-DPCs From the Separated Dermis
The rinsed dermis was transferred to 0.35% collagenase (Worthington Biochemical Corp., Lakewood, NJ, USA), 2 ml for each mouse, and then incubated for 30 min at 37°C with agitation. The dermis was then treated with 20,000 U/ml DNase (Worthington Biochemical Corp.), 12.5 μl for each mouse, for 10 min. The dermal digest was diluted with D-medium, 20 ml for each mouse, and filtered through a 100-μm cell strainer (BD Falcon). The filtrate was centrifuged at 150 × g for 5 min at 4°C, and both the supernatant and the pellet were saved. The supernatant from the 150 × g spin was then centrifuged at 450 × g for 5 min; the resulting supernatant was discarded, but the pellet was saved. The pellet from the 150 × g spin was then centrifuged at 20 × g for 3 min. The resulting pellet was saved for dermal HF isolation, and the supernatant was also saved for next step. The supernatant of the 20 × g spin was then centrifuged at 230 × g for 5 min; the resulting supernatant was discarded, but the pellet was saved. The pellets from the 450 × g spin and the 230 × g spin were combined and were centrifuged three times at 230 × g for 5 min each. The final pellet was resuspended in D-medium, 10 ml for each mouse, and then filtered through a 20-μm mesh (Sefar, Buffalo, NY, USA).
The Isolation of HFs From the Separated Dermis
The pellet from the 20 × g spin of DF-DPC isolation was resupended in K-medium, 4 ml per five mice, and the resulting solution was mixed with an equal volume of 9% Ficoll (GE Healthcare, Uppsala, Sweden) in 15-ml conical tube, resulting in 4.5% Ficoll. A total of 8 ml of the resulting suspension of the dermal HFs in 4.5% Ficoll was layered over 5 ml of 9% Ficoll in a 15-ml conical tube. This tube was centrifuged at 40 × g for 3 min, and the supernatant was discarded. The pellet was centrifuged with medium three times at 20 × g for 3 min each to remove the Ficoll. The integrity of HF buds (i.e., whether they remained intact and not broken) was confirmed by microscopy.
In Vivo Cell Transplantation
Grafting chamber (2.2 cm3/vehicle for 2 × 10⁶ cells) with IFKs, a combination of IFKs and DFs-DPCs, HFs, a combination of HFs and DFs-DPCs, DFs-DPCs, or grafting chamber without cells (as a negative control) was grafted onto the backs of athymic 7-week-old BALB/c-nude mice, 15 male mice per group (Orient Bio, Seongnam, Korea) (2 × 10⁶ cells/mouse). Grafting chambers were removed 7 days after grafting.
Study Approval
All animal experiments were approved by the CHA University Institutional Animal Care and Use Committee.
Sample Preparation for Quantitative Real-Time RT (qRT)-PCR and NGS Analysis
IFKs, HFs, or DFs-DPCs were lysed in TRIzol reagent (Invitrogen, Carlsbad, CA, USA), and total RNA was extracted from each sample. Then each RNA sample was purified, treated with DNAse I (Qiagen, Valencia, CA, USA) and cleaned up using an RNeasy Mini Kit (Qiagen) to remove contaminating genomic DNA according to the manufacturer's RNA cleanup protocol (5). To minimize the effect of biological variation on the differential expression results, RNA was pooled from 24 PND2 C57BL/6 mice (Koatech) (eight mice from each three different mothers) for each cell type. RNA concentration was quantified using a NanoDrop ND-1000 spectrophotometer (NanoDrop Technologies, Wilmington, DE, USA) and a Qubit fluorometer (Invitrogen).
Only high-quality RNA was used; RNA integrity number (RIN) ≥7 with the Agilent 2100 Bioanalyzer (Agilent Technologies, Santa Clara CA, USA) and a 28S/18s ratio ≥1.0 with the Infinite F200 Pro (Tecan, Männedorf, Switzerland).
RNA-seq Transcriptome Analysis with NGS, Illumina HiSeq™
The total RNA extracted from the samples was enriched for mRNA using oligo(dT) magnetic beads (Invitrogen). The mRNA was then cleaved into short fragments (approximately 200 bp) by incubation with a fragmentation buffer (Ambion, Foster City, CA, USA); then, first-strand cDNA was synthesized using the mRNA fragments as templates. RNase H (New England BioLabs, Ontario, Canada), DNA polymerase I (New England BioLabs), and dNTPs (New England BioLabs) were added to synthesize second-strand cDNA. The resulting double-stranded cDNA was purified using the QIAquick PCR extraction kit (Qiagen) and washed with EB buffer (Qiagen) prior to end repair and single nucleotide A (adenine) (Illumina, San Diego, CA, USA) addition. Finally, sequencing adaptors were ligated to the fragments. The fragments were purified by agarose gel (Lonza, Allendale, NJ, USA) electrophoresis (Takara, Shiga, Japan) and enriched by PCR amplification. The library products were then sequenced using an Illumina HiSeq™ 2000 instrument (Illumina). The dirty raw reads were removed prior to data analysis. The filtering step removed the adaptor sequence reads. The following analyses were based on the remaining clean reads. To obtain the clean reads, the dirty raw reads were removed prior to data analysis using following criteria: 1) remove reads with adaptors; 2) reads with more than 10% unknown bases were removed; and 3) low-quality reads, where the percentage of bases with a quality value ≤5 was more than 50% in a read, were removed.
After removing the low-quality reads, clean reads were mapped to the reference genome Mus musculus Ensemble release 72 (www.ensembl.org, Cambridge, UK). The NGS data were processed, and an analysis was conducted with statistical evaluation and normalization using STAR (http://code.google.com/p/rna-star/, CA, USA) + Tac Count Comparison (TCC) based on DEG elimination strategy (DEGES)/R and Bioconductor DESeq (version 2.13) (http://www.iu.a.u-tokyo.ac.jp/~kadota/TCC, Tokyo, Japan, http://bioconductor.org) (60). The differential expressed genes (DEGs) were filtered out using the detection q-value (<0.05) and fold change difference (>2.0); these genes were then subjected to Gene Ontology (GO) function analysis (http://www.geneontolgy.org/) with DAVID (http://david.abcc.ncifcrf.gov/home.jsp) and KEGG pathway analysis (http://www.kegg.jp/kegg/pathway.html). The GO and KEGG pathway analyses of the DEGs were performed using the in-house Theragen software (Theragen Etex, Suwon, Korea). Statistical analysis was performed with DESeq and normalization of two-group count data using DEGES with q-value, which was corrected with Benjamini–Hochberg procedure.
Hierarchical cluster analysis was performed using the complete linkage and Euclidean distance as a measure of similarity. All values (IFKs vs. HFs, DFs-DPCs vs. HFs) were used with the DESeq-normalized value.
Raw data from our NGS experiments are available at the NCBI-SRA (http://www.ncbi.nlm.nih.gov/Traces/sra/) under alias No. PRJNA223212 and accession No. SRP031608.
Quantitative Real-time RT-PCR (qRT-PCR)
The 2-ΔΔCt method was used to validate the identified genes (37). After purification, 1.5 μg of RNA from each sample was reverse transcribed into cDNA using the SuperScript™III First-Strand Synthesis System (Invitrogen) according to the manufacturer's instructions. cDNA samples were subjected to qRT-PCR with the gene-specific primers, described below. All samples were run at least in triplicate (independent biological replication). qRT-PCR was performed in a Bio-Rad Opticon 2 cycler (Bio-Rad Laboratories, Hercules, CA, USA) with Exicycler 96 (Bioneer, Daejun, Korea) using Green Star qPCR premixed reagents (Bioneer). The 2-ΔCt and 2-ΔΔCt methods were used to calculate the relative expression levels of the target genes. For the 2-ΔCt method, the mean Ct values of the target genes in each sample were normalized to those of Gapdh. ΔCt was determined by ΔCtt = Ctt (target) – Ct (Gapdh). This relative value of the target compared with the endogenous reference was described as the 2-ΔCt. The 2-ΔΔCt method was then used to analyze any gene expression changes between samples, where the ΔCt value in one sample was normalized to the ΔCt value in the other sample to calculate the ΔΔCt value of one specific sample. For example, the ΔΔCt value of HFs compared to IFKs (the ΔCt values of the HFs were normalized to the ΔCt values in IFKs) was ΔΔCtHF = ΔCtt (HF) – ΔCt (IFK). Statistical significance was defined as p < 0.05 using a Student's t-test.
The primers used were Gapdh: 5′-TTGTCTCCTGCG ACTTCAACA-3′ (forward) and 5′-TTACTCCTTGGAG GCCATGTA-3′ (reverse), Cldn3: 5′-ATGGGAGCTGGG TTGTACGT-3′ (forward) and 5′-TAGTCCTTGCGGTCG TAGG-3′ (reverse), Kcne1: 5′-ACTCCCACGACCCTTT CAA-3′ (forward) and 5′-ACAATGGCTTCAGTTCAGG AA-3′ (reverse), C1qb: 5′-AGCATGCAGAAAGTAGTC ACCT-3′ (forward) and 5′-GAAAAGCAGAAAGCCAG TGAAG-3′ (reverse), C1qc: 5′-TGAACCTCAACCTTG CCAG-3′ (forward) and 5′-TCGGGAAACAGTAGGAA ACCA-3′ (reverse), and Rgs1: 5′-CTTCCATACTCGAGA# ATCGACA-3′ (forward) and 5′-TGCCTGAAGGTCATT TAGAAGA-3′ (reverse).
Cell Cycle Analysis with Flow Cytometry (FCM)
To assess the cell cycle distribution of the whole cell population, each harvested cell type was fixed in cold 70% ethanol for 1 h at 4°C. After treatment with 20 U/ml RNase A (Intron Biotechnology, Gyeonggi, Korea) for 10 min at room temperature, the cells were resuspended in 0.1 mg/ml propidium iodide (PI) solution (Sigma-Aldrich, St. Louis, MO, USA) and incubated for 30 min at 37°C. PBS (Sigma-Aldrich) was used as the washing and buffer solution in all steps. The DNA profiles of the PI-stained cells were measured with a FACSCalibur FCM (BD Biosciences), collecting 150 to 200 events per channel. DNA patterns and cell cycle positions were determined using ModiFit LT™ software (Verity Software House, Inc., Turramurra, Australia).
Cell Culture
IFKs and HFs were cultured in defined keratinocyte-SFM medium (Gibco) with S7 supplement (Gibco) in tissue culture dishes (BD Falcon). DFs-DPCs were cultured in DMEM high glucose (Gibco) supplemented with 10% FBS (Gibco). All media contained antibiotics and antimycotics (Gibco). The medium was changed 60 h after plating the cells and every 2 days thereafter. To evaluate senescence or confluence, all cells were cultured for 5 days with two medium changes and maintained in a humidified incubator at 37°C with 5% CO2.
Immunohistochemistry
The isolated cell samples were incubated with the primary antibody (rabbit host), Cd71 (1:200; ab61021; Abcam, Cambridge, UK), integirn-β1 (1:200; ab52971; Abcam), CK15 (1:100; bs1201; Bioworld Technology, Inc., Minneapolis, MN, USA), Sox2 (1:200; ab97959; Abcam), and connexin 43 (1:200; ab1137; Abcam) for 12 h at 4°C or fibronectin (1:100; ab2413; Abcam) for 30 min at room temperature, washed three times with TBS (Sigma-Aldrich), and incubated with the secondary antibody, goat Alexa 594-conjugated anti-mouse IgG (Molecular Probes, Eugene, OR, USA) for 2 h at room temperature. After being washed with PBS, cells were stained with 4,6-diamidino-2 phenylindole (DAPI) (Sigma-Aldrich) for 5 min.
The isolated IFKs, HFs, and DFs-DPCs were deposited using Shandon cytospin (Thermo Fisher Scientific, Waltham, MA, USA) and Histobond slide (Marienfeld, Lauda, Germany), fixed in 4% formaldehyde (Sigma-Aldrich)-PBS (pH 7.4) at room temperature for 20 min, rinsed in distilled water, and then performed with Harris hematoxylin (Sigma-Aldrich) and alkaline phosphate (AP) staining (Sigma-Aldrich). All images were acquired using a Ti-E microscope (Nikon, Chiyoda-ku, Japan).
Results
IFKs, HFs, and DFs-DPCs were isolated and investigated for their gene ontology enrichment and pathways with DEGs for HF/IFK and HF/DF-DPC using NGS-DEGES/DESeq analysis. We tried to inspect meaningful genes by assessing the overlapping patterns of GO, pathways, the DEGs of skin disease for researchers. We confirmed the roles of these types of cells in long-term hair growth via in vivo transplantation and observation. Additionally, because we discovered that the characters of IFKs and HF keratinocyte cultures were different, the cell cycle distribution was analyzed with FCM. Using NGS, we identified several meaningful cell cycle-related genes.
DEGs, GO, and Pathway Analysis with NGS-DEGES/DESeq
We first evaluated the sequencing quality of the DEG libraries using NGS; the proportions of clean reads for all samples ranged from 97.4% to 97.5% (11,463,176 to 11,908,478 reads), were saturated, and showed an even distribution in all samples (Fig. 1A). Using STAR + TCC with DEGES/DESeq, 297 and 413 DEGs (q-value <0.05) were detected in the IFK versus HF and the DF-DPC versus HF assessments, respectively (Fig. 1B). For the GO categories “biological process,” “molecular function,” and “cellular component” (p < 0.001), 200 (6.3%), 17 (3.1%), and 29 (10.3%) DEGs, respectively, were detected in IFK versus HF, and 313 (8.5%), 42 (7.1%), and 25 (8.8%) DEGs, respectively, were detected in DF-DPC versus HF.
NGS analysis of differentially expressed genes in IFK versus HF and in HF versus DF-DPC using the STAR + TCC DEGES/DESeq bioconductor, version 2.13, with a q-value <0.05 and a |log2ratio| ≥1. (A) Evaluation of the sequencing quality of the differentially expressed gene (DEG) libraries of all samples. (B) The MA plot and histogram of DEGs. In the 297 DEGs in IFK versus HF for the keratinocyte lineage, 158 were upregulated in HF, and 139 DEGs were upregulated in IFK. The minimum fold change |log2ratio| of these DEGs was 2.3. In the 413 DEGs in DF-DPC versus HF for the dermal substructures, 92 were upregulated in HF, and 321 were upregulated in DF-DPC. The minimum fold change |log2ratio| in these DEGs was 3.5. (C) The hierarchical clustering of DEGs. (D) A histogram of the GO biological processes in IFK versus HF.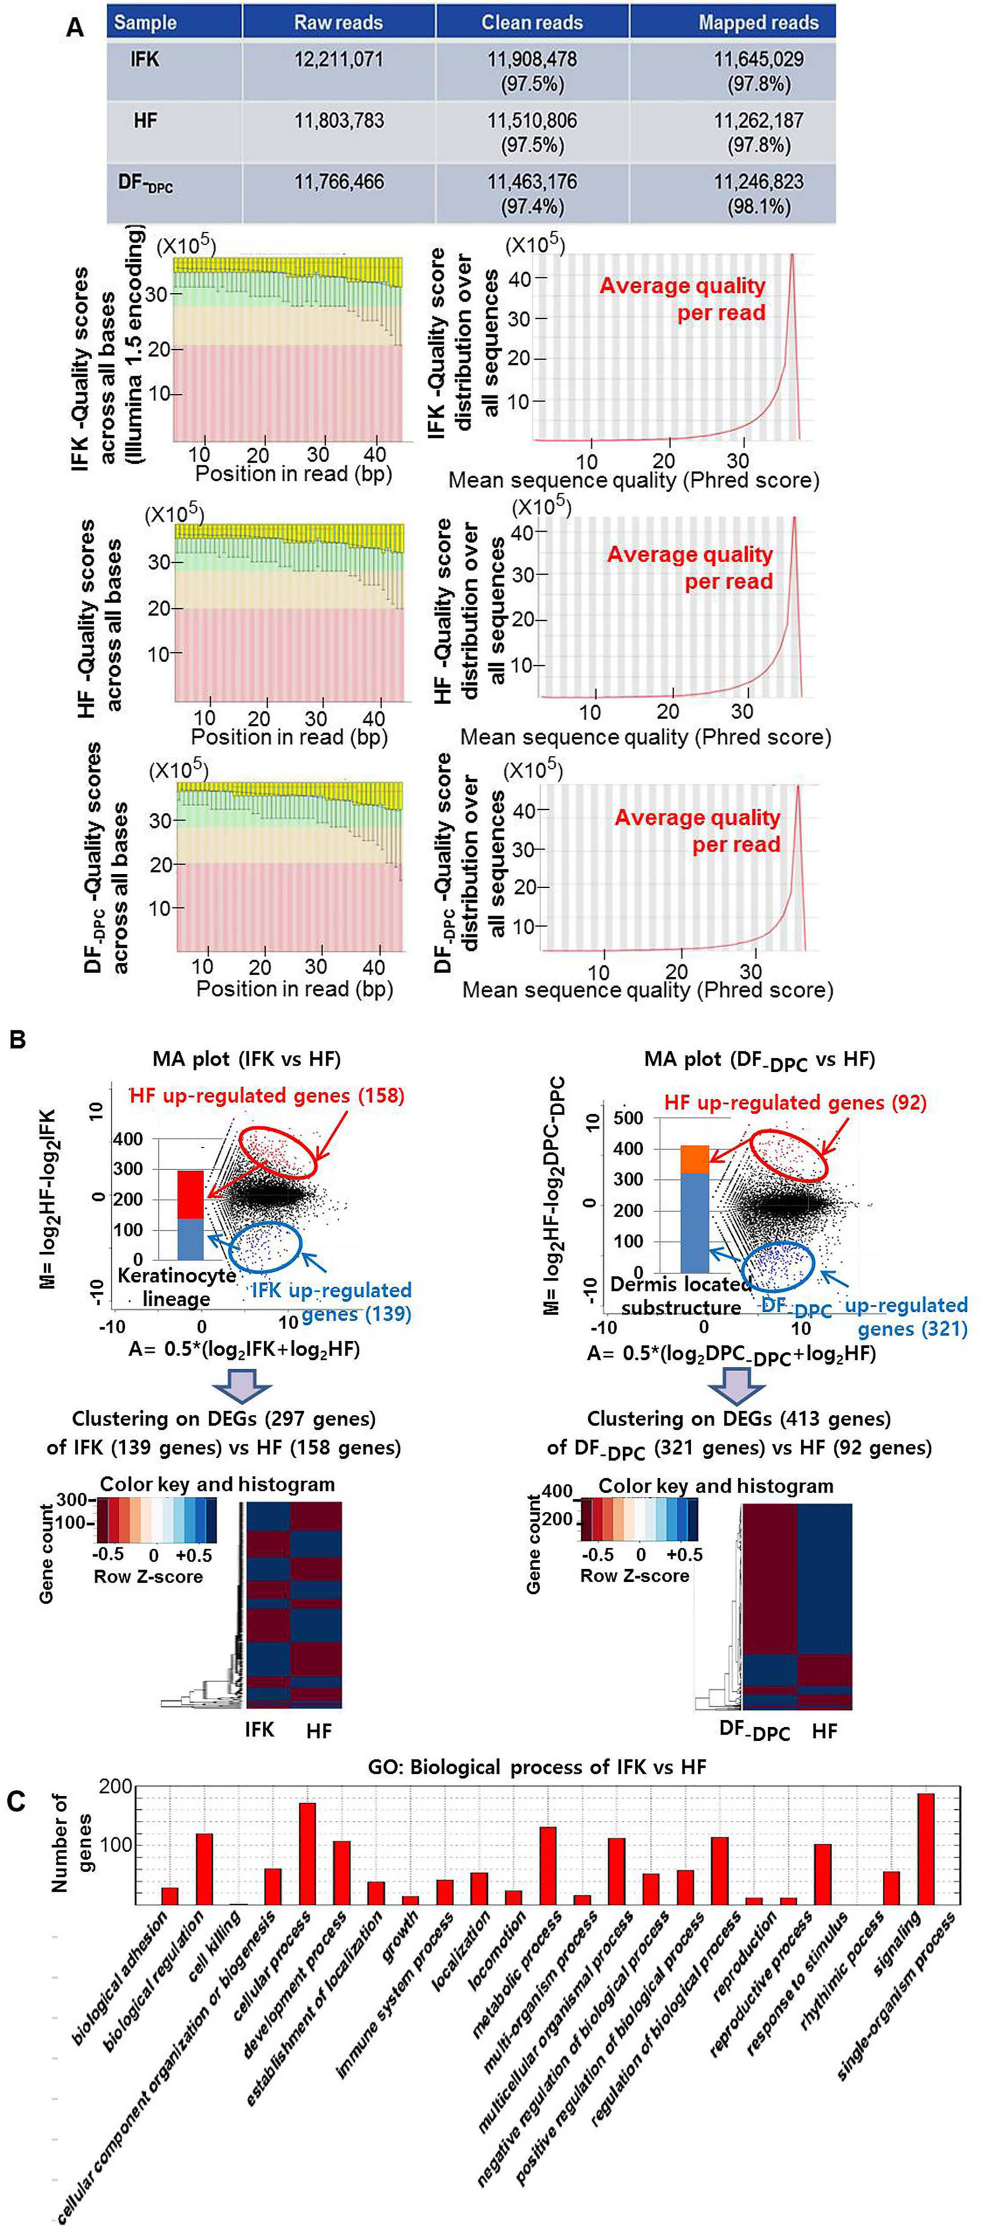
Overall, we searched within the GO enrichment category “biological process” for each hair-related name in IFK versus HF. We then inspected the common GO enrichment “molecular function” between the IFK versus HF and the DF-DPC versus HF. We also evaluated the pathway of IFK versus HF, focusing on skin disease. We then inspected the common pathways between the IFK versus HF and the DF-DPC versus HF. All investigations were connected with DEGs.
GO Enrichment Biological Processes Selection in IFK Versus HF With DEGs That Have HF-Related Terms of GO

GO Id: 0001837 (p value: 4.39 E−05), Ontology: biological_process, Name: epithelial-to-mesenchymal transition, Description: a transition where an epithelial cell loses apical/basolateral polarity, severs intercellular adhesive junctions, degrades basement membrane components, and becomes a migratory mesenchymal cell.
GO Id: 0001942 (p value: 4.1E−04), Ontology: biological_process, Name: hair follicle morphogenesis, Description: the process in which the anatomical structures of the hair follicle are generated and organized.
GO Id: 0031069 (p value: 1.0E−04), Ontology: biological_process, Name: hair follicle development, Description: the process whose specific outcome is the progression of the hair follicle over time, from its formation to the mature structure. A hair follicle is a tube-like opening in the epidermis where the hair shaft develops and into which the sebaceous glands open.
GO Id: 0042633 (p value: 2.26 E−05), Ontology: biological_process, Name: hair cycle, Description: the cyclical phases of growth (anagen), regression (catagen), quiescence (telogen), and shedding (exogen) in the life of a hair; one of the collection or mass of filaments growing from the skin of an animal and forming a covering for a part of the head or for any part or the whole of the body.
The Four Common “Molecular Function” GO Categories (p < 0.001) Between the IFK Versus HF and the DF-DPC Versus HF (the DEGs Were Arranged)

Combining with a signal and transmitting the signal from one side of the membrane to the other to initiate a change in cell activity by catalysis of the reaction: a protein + ATP = a phosphoprotein + ADP.
Combining with a signal and transmitting the signal from one side of the membrane to the other to initiate a change in cell activity by catalysis of the reaction: ATP + a protein-L-tyrosine = ADP + a protein-L-tyrosine phosphate.
We also evaluated the Kegg pathway (http://www.kegg.jp/kegg/pathway.html) of IFK versus HF and inspected the DEGs detected in each pathway (Table 3). We schematized the circle graph for clinical skin disease-related pathways with overlapped DEGs, including BCC (Fig. 2A, Table 4). A diagram depicting the pathway of cancer neoplasia with overlapping DEGs, though not specific to skin cancer, is also shown. The melanogenesis (p < 0.0001) and Wnt signaling (p = 0.0088) pathways included all of the DEGs identified in BCC (p = 0.0001) and the HH signaling (p = 0.0067) pathway in HF/IFK (Fig. 2A), such as Fzd1 and -5, Wnt4, −5a, 7b, and -18. The Fzd1 and -5, Wnt5a, and Tyrp1 were upregulated in HF/IFK (Table 4, lower part). The melanogenesis and BCC pathways were shown (Fig. 2B, C).
Schematization of the overlapping DEGs (A) involved in clinical skin disease pathway and the pathway of cancer neoplasia that are not specific to skin cancer, in the IFK versus HF (Tables 3 and 4). (B) The basal cell carcinoma (BCC) pathway (p = 0.0001) and (C) the melanogenesis pathway (p<0.0001) in IFK versus HF. DEGs are written and marked in red. Evaluation of the Pathways (p < 0.05) (http://www.kegg.jp/kegg/pathway.html) of IFK Versus HF and of DF-DPC Versus HF (the DEGs Were Arranged) The Pathway Enrichment, Associated With Clinical Skin Disease, for IFK Versus HF With DEGs (http://www.kegg.jp/kegg/pathway.html)


As another way to investigate the pathways connected with DEGs, we investigated common pathways between HF/IFK and HF/DF-DPC (Tables 3 and 5). Interestingly, six such pathways were discovered and were involved in pathway in cancer, SLE, cell adhesion molecules (CAMs), complement and coagulation cascades, Staphylococcus aureus infection, and amebiasis (p < 0.05) (Table 5). We also wondered which DEGs could be simultaneously detected in these six common pathways because any common DEGs might serve as a bidirectional linkage in the interaction of HF and IFK or HF and DF-DPC (Table 5, underlined). We inspected these pathways in detail to determine whether any might directly or indirectly affect clinical skin disease, with the exception of amebiasis. Common DEGs were from the Tgfa and Csf1r in pathways in cancer, the C1qa, -b, and -c, and H2-Aa in SLE, the Itgam, Ptprc, and H2-Aa in CAMs, and the C1qa, -b, and -c in complement and coagulation cascades. We investigated how these common DEGs overlapped between these pathways, and this is schematized in a circle graph (Fig. 3). Thus, we hope that our data (the detection of several disease pathways and genes, which overlap) will provide clues for researchers studying a specific pathologic mouse model, who can then use these data to study a specific pathologic mouse model. We expect that the overlapping DEGs will provide a promising clue about the interrelation between these clinical diseases in the near future.
A schematization of overlapping DEGs in the common Kegg pathway enrichment between the IFK versus HF and the DF-DPC versus HF data from Table 3 (p < 0.05), with the exception of amebiasis. These DEGs suggest a bidirectional linkage between the interaction of HF and IFK and the interaction of HF and DF-DPC. The Six Common Kegg Pathway Enrichments Between IFK Versus HF and DF-DPC Versus HF From Table 3 (p < 0.05); Overlapping DEGs Between These Common Pathways Are Underlined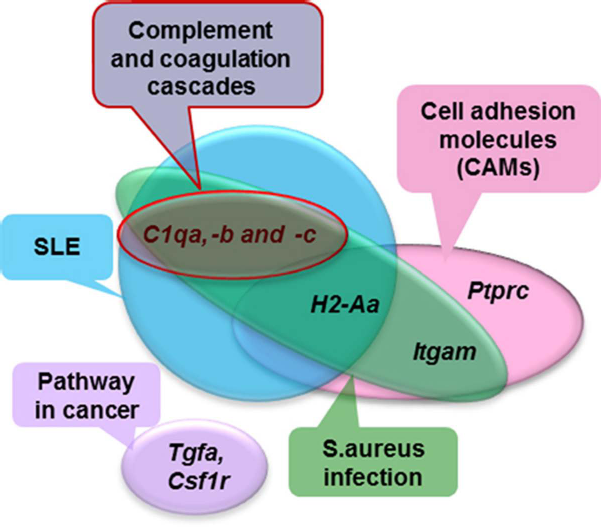

The Uniquely HF-Expressed or Uniquely IFK-Expressed Genes in HF Versus IFK
We inspected the 10 uniquely HF-expressed and 14 uniquely IFK-expressed genes in HF versus IFK and then scatterplotted their gene expression values of DF-DPC in the rest of the cell sample (y-axis), comparing the HF or IFK values for the uniquely expressed cell sample (x-axis) (Fig. 4).
The 10 uniquely HF-expressed (A, B) and 14 uniquely IFK-expressed (C, D) genes in HF versus IFK, with a simultaneous inspection of the gene expression values of DF-DPC in the rest of the cell sample. (A, C) The gene expression values of DF-DPC (y-axis) were scatterplotted and compared with the values of HF (A) or IFK (C) as the only cell sample (x-axis). Most gene expression patterns of DF-DPC were similar to those of HF. Only a few genes showed a different pattern, and these are marked with a square violet line. (A) Cldn3 and Kcne1 showed downregulation in DF-DPC but upregulation in HF, while (C) C1qb and -c and Rgs1 showed upregulation in DF-DPC but downregulation in HF. (B, D) These genes (Cldn3, Kcne1, C1qb and -c, and Rgs1) were validated using quantitative real-time RT-PCR.
Notably, we discovered that the gene expression patterns observed in DF-DPC mostly followed those of the HF pattern, suggesting that there might be a synergistic interaction of these genes within the dermal substructure. Among the 10 genes expressed uniquely in the HFs, most (80%, eight genes) were also upregulated in the DFs-DPCs (Fig. 4A). In contrast, a different pattern (downregulation in DFs-DPCs) was observed for Cldn3 and Kcne1, and we validated these two genes with qRT-PCR analysis (n = 3, independent biological replications) (Fig. 4B). Additionally, among the 14 genes expressed uniquely in the IFKs, most (79%, 11 genes) were downregulated in the DFs-DPCs (Fig. 4C). In contrast, a different pattern (upregulation in the DFs-DPCs) was observed for C1qb, C1qc, and Rgs1, and we validated these three genes with qRT-PCR (Fig. 4D). These few genes that were found to have opposing patterns between the HFs and DFs-DPCs in either the HF-only or IFK-only detected genes could offer another important perspective into skin diseases.
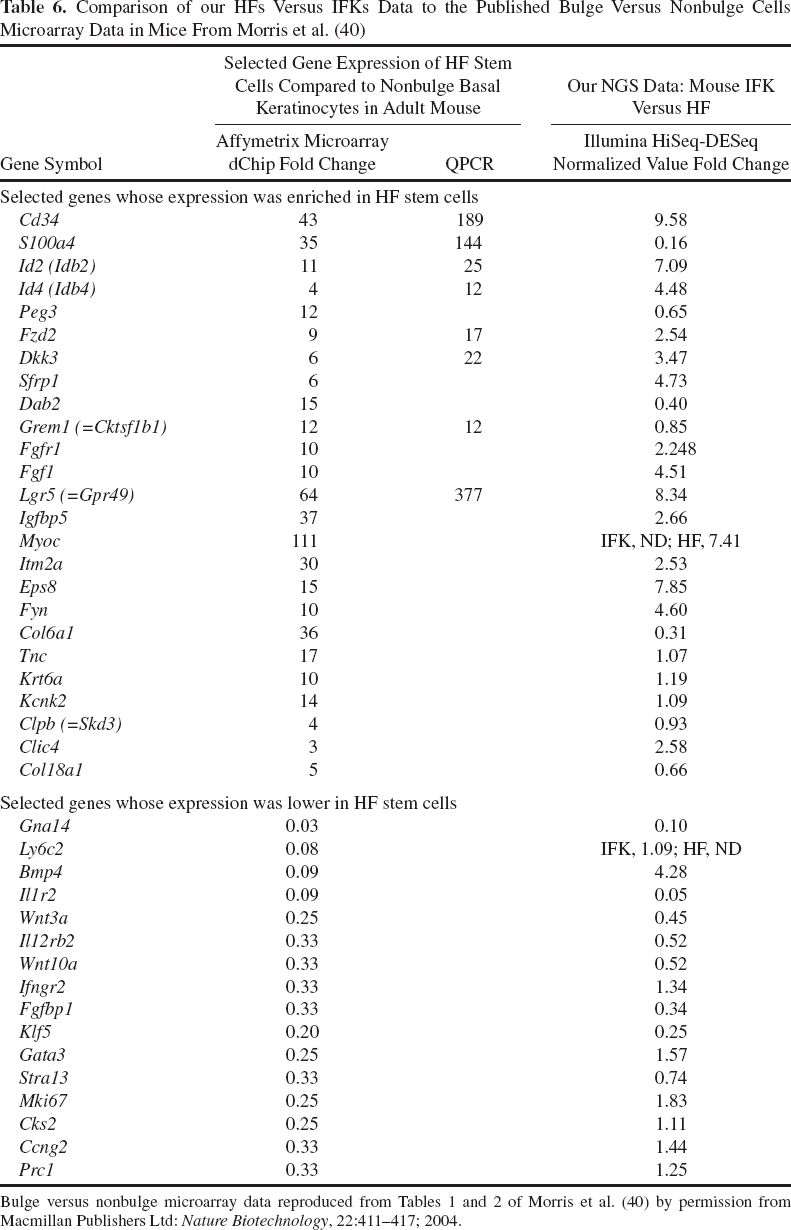
Comparison of our HFs Versus IFKs Data to the Published Bulge Versus Nonbulge Cells Microarray Data in Mice From Morris et al. (40)
Comparison of our HFs Versus IFKs Data to the Published Bulge Versus Nonbulge Cells Microarray Data in Humans From Ohyama et al. (44)
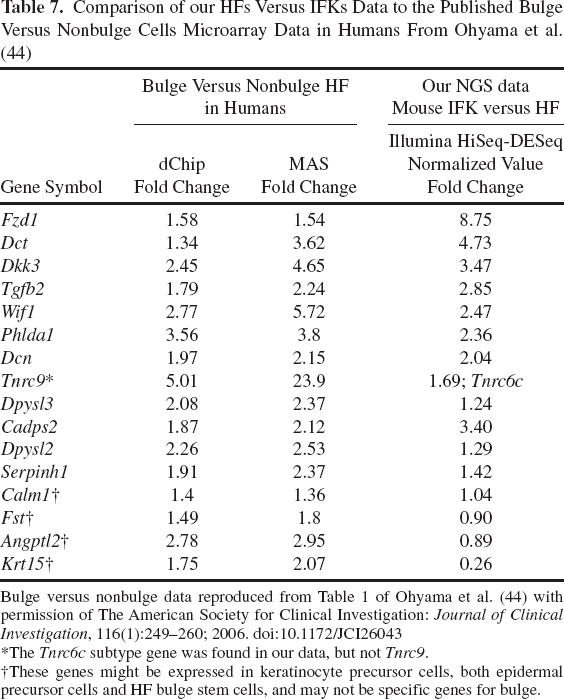
Bulge versus nonbulge data reproduced from Table 1 of Ohyama et al. (44) with permission of The American Society for Clinical Investigation: Journal of Clinical Investigation, 116(1):249-260; 2006. doi:10.1172/JCI26043
The Tnrc6c subtype gene was found in our data, but not Tnrc9.
These genes might be expressed in keratinocyte precursor cells, both epidermal precursor cells and HF bulge stem cells, and may not be specific genes for bulge.
Characterization of the Isolated Cell Population
To confirm that the cell populations are not contaminated with each other, we characterized HF buds using CD71 [a HF marker (66)] and DFs-DPCs using fibronectin [a DPC and skin-derived precursor marker (17,32)] in all three kinds of cell samples and their cultured cells (Fig. 5A). Additionally, staining of CK15 and integrin-β1 [the known epidermal stem cell/precursor marker (38)] was performed for the keratinocyte lineage, both of IFKs and HFs, to confirm that they included epidermal precursor cells as the protocol (35) (Fig. 5B); we also observed these antibodies-immunoreactivities (IRs) in their cultured cells. Both of these antibodies showed different patterns of IR, as CK15 expression was decreased, and integrin-β1 expression was increased in the cultured cells. Sox2 (12) and AP [a well-known DPC marker that histologically resembles the wick of a candle (42)] were assessed in DFs-DPCs and cultured DFs-DPCs (Fig. 5C); these markers were very rapidly decreased in our culture condition (10% FBS). Last, we observed how the IR of connexin 43, which has homogenous IR in the outer root sheath (ORS) of HFs (32), differentiated from the IR of CK15 in our HF bud (Fig. 5D, left). We confirmed that our HF buds were not contaminated with DPCs using AP staining (Fig. 5D, right).
Characterization of IFKs, HFs, and DFs-DPCs samples (A–D) and follow-up of in vivo transplantation using a combination of cell samples (E, F). (A) IFKs, HFs, and DFs-DPCs and their cultured cells were stained with CD71 (HF marker) and fibronectin (DPC and skin-derived precursor marker); IFKs were not contaminated with HFs, and HFs were not contaminated with DFs-DPCs. (B) CK15 and integrin-β1 (bulge marker and epidermal stem cell marker) were used to stain IFKs and HFs from the keratinocyte lineage. (C) Positive IRs for Sox2 and AP in isolated DFs-DPCs but not in cultured cells. (D) The immunoreactivity (IR) of connexin 43 in the outer root sheath was separate from the IR of CK15 in the inner root sheath of HFs. Isolated HFs were not contaminated with DFs-DPCs, as confirmed by AP staining. (E) C57BL/6 postnatal day 2 mouse skin with Harris hematoxylin (blue) showing the locations of substructures such as epidermis and hair follicles and AP (red) showing dermal papillar cells. Scale bar: 100 μm. (F) Hair growth at 2 months and 8 months after transplantation. Mice with DFs-DPCs alone or a combination of IFKs and DFs-DPCs showed thin hair at 2 months. The hair density of mice grafted only HFs did not increase after 2 months, whereas that of a combination of HFs and DFs-DPCs was maintained up to 8 months with bushy hair (15 mice/group). (G) Long-term follow-up of mice grafted with a combination of HFs and DFs-DPCs.
In Vivo Cell Transplantation
Nude mice received transplants consisting of either one or two types of cells, IFKs, HFs, and DFs-DPCs, which were samples of NGS analysis described above. All groups were observed for 8 months (15 mice per group). Grafting IFKs alone yielded the same results as were observed in the negative control. Mice grafted with DFs-DPCs alone or a combination of IFKs and DFs-DPCs showed thin and sparse hair at 2 months, whereas mice grafted with a combination of HFs and DFs-DPCs showed consistent bushy and thick hair growth at 2 months and maintenance of abundant hair until 8 months (Fig. 5F). Grafting only HFs showed intermediate grade between grafting DFs-DPCs alone or a combination of IFKs and DFs-DPCs and grafting a combination of HFs and DFs-DPCs.
We followed up closely the group of a combination of HFs and DFs-DPCs over 1 year (Fig. 5G); the hair density increased even until 4 months and was either maintained or decreased slowly until 14 months.
Characteristics of Cultured Cell Samples
We cultured IFKs and HFs of the keratinocyte lineage in the same condition and observed some characteristic differences; IFKs showed senescence earlier than HFs and began floating before reaching 70% confluence, whereas HFs rarely float until day 5 (Fig. 6A). After day 7, we had difficulty in maintaining IFKs, whereas HFs were maintained (data not shown). DFs-DPCs exhibit fibroblast cell-like morphology (senescence at days 5-7).
Characteristics of the cultured cell samples and their cell cycle analysis (A–C) and analysis of the representative cell cycle-related genes in the IFK, HF, and DF-DPC samples (D–F). (A) Morphology of cultured IFKs, HFs, and DFs-DPCs. HFs rarely showed evidence of senescence. Scale bar: 100 μm. (B) Line graph of cell cycle distribution with FCM in cultured cells. Between the cell isolation time (day 0) and culture day 2.5 (in dotted quadrangle), IFKs and DFs-DPCs exhibited the same changes, whereas HFs tended to remain stable. Mean ± SD (n = 3, independent biological replicates). (C) Cell cycle analysis of the cultured IFKs, HFs, and DFs-DPCs with PI staining and FCM. These results are representative of one of three independent experiments. Between the cell isolation time (day 0) and culture day 2.5, the S phase population increased more than twofold in IFKs and DFs-DPCs accompanied by a decrease in the G0/G1 phase population, whereas the S phase population decreased in HFs accompanied by maintenance of the high G0/G1 phase population with a slight increase. For the quiescence genes, the normalized values of HFs were hierarchically clustered and compared with (D) IFKs as the keratinocyte lineage and (E) DFs-DPCs, regardless of the cell lineage. The Cdk2, Cdkn2aip, and Foxo1, −3, and -4 (marked with an asterisk) are the quiescence genes of HF, regardless of the cell type lineage (they are upregulated in both HF/IFK and HF/DF-DPC). In contrast, Cdkn2c and Cdc42 (underlined in the figure) are quiescence genes of HF in only the keratinocyte lineage (they are upregulated in HF/IFK but downregulated in HF/DF-DPC). (F) The normalized values of IFK versus HF and DF-DPC versus HF were scatterplotted. The five genes (Cdk2, Cdkn2aip, and Foxo1, −3, and -4) involved in the quiescence of HF regardless of cell type lineage are marked with circles (left side above the y = x line).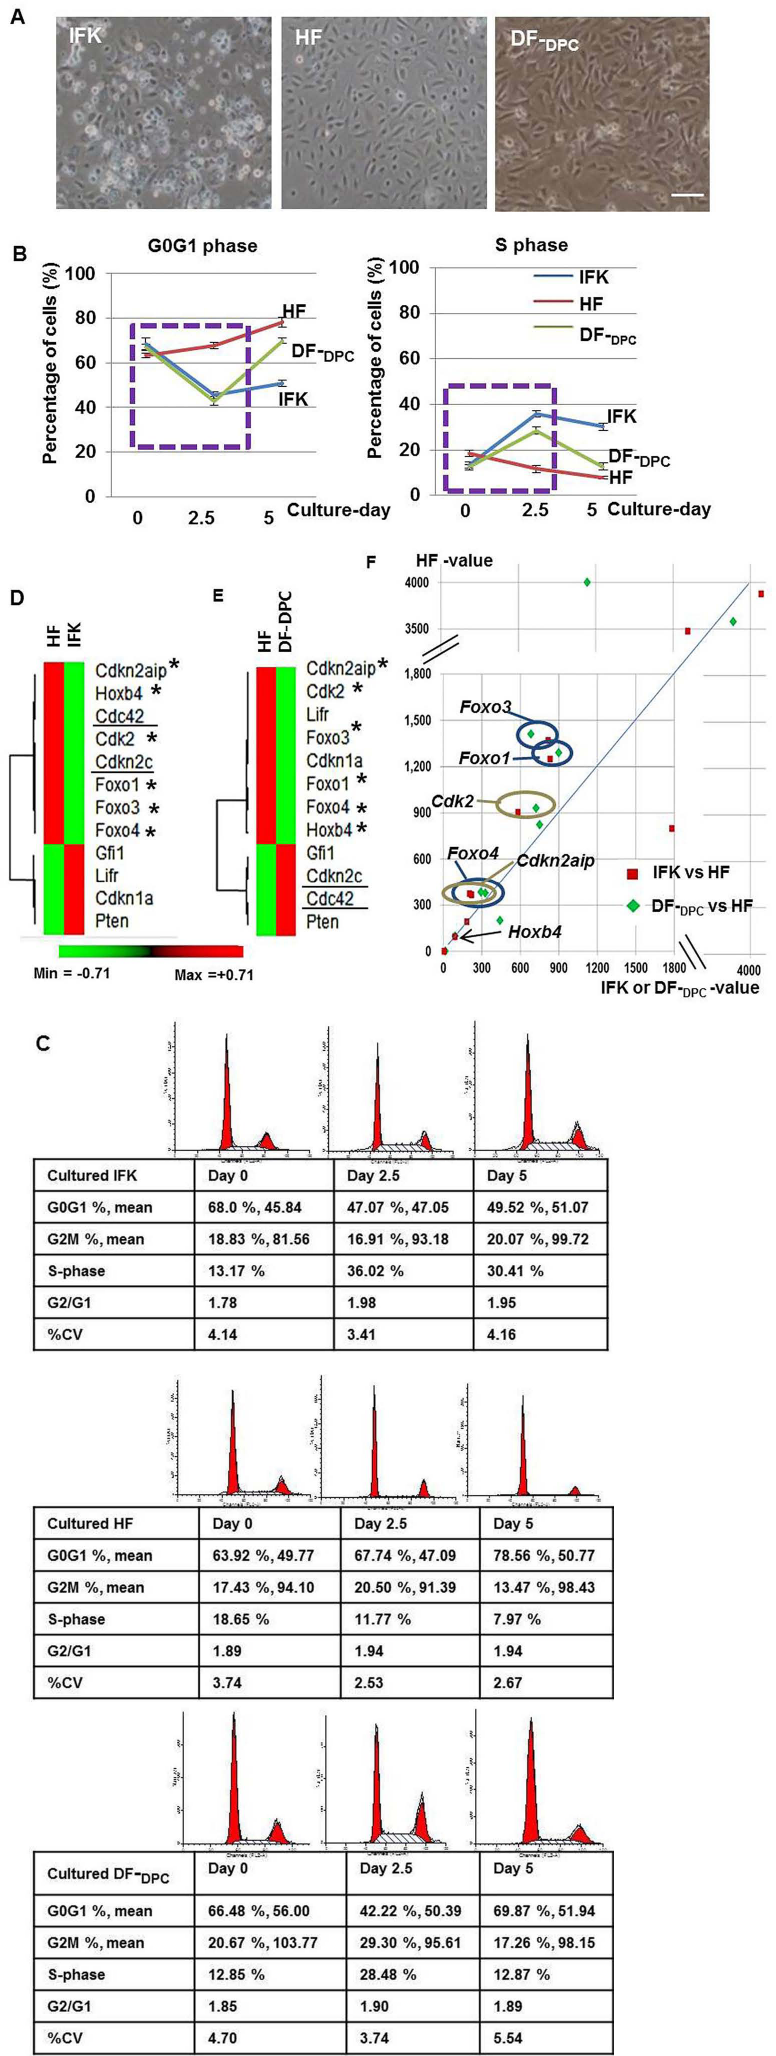
To examine the objective pattern of cell growth, we analyzed the cell cycle using FCM (Fig. 6B, n = 3, independent biological replication; Fig. 6C). To avoid a biased interpretation that could be caused by an inhibition of cell growth occurring through cell-to-cell contact in highly confluent conditions, we focused on the changes between the cell isolation time (day 0) and the culture day 2.5 (the dotted quadrangle, Fig. 6B); IFKs and DFs-DPCs showed that the G0/G1 phase population markedly decreased (IFKs, mean 68.5% to 45.6%; DFs-DPCs, mean 67.0% to 42.8%) and the S-phase population markedly increased (IFKs, mean 13.3% to 35.8%; DFs-DPCs, mean 12.6% to 28.5%); however, interestingly, the cell cycle distribution of HFs tended to remain stable, with a very slight increase in the G0/G1 phase population (mean 63.3% to 67.6%) and a decrease in the S phase population (mean 18.6% to 11.6%).
Representative Cell Cycle Related Genes in the IFK, HF, and DF-DPC Samples
We were interested in the patterns of the cell cycle-related genes in our samples. Therefore, we assessed 12 previously identified representative genes that are involved in cell self-renewal and quiescence (47).
For the quiescence genes, we first observed the normalized values of the HFs compared with the IFKs using hierarchical clustering because the HFs and IFKs are both derived from the keratinocyte lineage and would therefore be the most informative (Fig. 6D). We found that eight of the genes (Cdk2, Cdkn2c, and -2aip, Hoxb4, Cdc42, and Foxo1, −3, and -4) were upregulated in HF. We next wondered which of these eight genes were also upregulated in HF compared with DF-DPC (Fig. 6D, E, marked with an asterisk) and which were excluded (Fig. 6D, E, underlined). Some of the genes (Cdk2, Cdkn2aip, and Foxo1, −3, and -4, which are marked with an asterisk) are quiescence genes in HF regardless of their cell type lineage; simultaneous upregulation in HF/IFK and HF/DF-DPC. In contrast, others (Cdkn2c and Cdc42, which are underlined) are the quiescence genes of HF only within the keratinocyte lineage; these are upregulated in HF/IFK but downregulated in HF/DF-DPC (Fig. 6D, E). The Hoxb4 was insufficiently upregulated in the HFs (HF/IFK = 1.071, HF/DF-DPC = 1.051). We graphed the expression of all genes using a scatterplot (HF-value, y-axis; IFK- and DF-DPC-value, x-axis, in the IFK versus HF and the DF-DPC versus HF, respectively) (Fig. 6F). The 5 genes, Cdk2, Cdkn2aip, and Foxo1, −3, and - 4 (the HF quiescence genes for all cell type lineages) are marked with circles (on the left side above the y = x line).
Discussion
GO and Pathway Analysis in IFK Versus HF and in DF-DPC Versus HF
As one of four common GO-enrichment molecular functions between the IFK versus HF and the DF-DPC versus HF (Table 2), we were interested in the calcium ion-binding GO category. For a further investigation of this GO enrichment, we selected the same DEGs from both (Table 2, bold font); S100a3 and -7a, Tchhl1, Dsg4, Crnn, and Padi3 were upregulated, while Lcp1 was downregulated in HF compared with both IFK and DF-DPC. Interestingly, two subtypes of S100a (S100a3 and -7a) were detected. S100a is involved in sensing and transforming calcium signals for downstream cellular responses. Many human disorders, including the development and progression of cancer, are related to defects in calcium-binding proteins and the deregulation of cellular calcium homeostasis. The roles of S100a in intracellular and extracellular calcium signaling and homeostasis have been studied (9,11). An association between S100a3 and the developing HF has been studied (28-31). Recently, it has been suggested that S100a3 tumorigenesis is involved in colorectal cancer, and one adjuvant anticancer therapy involves the inhibition of the S100a3 gene and protein (36). In contrast, S100a7 was also discovered in our data and has rarely been studied in relation to HF. However, the roles of S100a7 in epidermal tumorigenesis, cytoplasmic expression (the prevention of oncogenic activity) and nuclear translocation and extracellular secretion (tumor progression) are now being studied (16). S100a7 is upregulated in HF compared with both IFK and DF-DPC in the common GO enrichment category “molecular function” between IFK versus HF and DF-DPC versus HF. Further research should thus focus not only on calcium ion binding but also on oncogenesis prevention because the role of HF in the tumor progression of skin neoplasia may be exemplified by the results of the dysregulation of S100a7 on the developing HF.
The Kegg pathway of HF/IFK, the Wnt signaling pathway, and the melanogenesis pathway are all involved in BCC pathway (BCC is of a trichogenic origin and is thus derived from HFs), which includes the common Fzd and Wnt gene subtypes (Fig. 2, Table 4). The relationships between these genes have been well studied (10,50,54). Interestingly, the combination of BCC and melanoma in the same specimen as the collision tumor or in the same anatomical lesion as the primary tumor have been case reported. Although this clinical scenario is rare, it has recently gained the attention of pathologists and clinicians (24,25,48,51,58). We hope that our data on overlapping DEGs could provide a clue to better understand the mechanism of these diseases, the combination of BCC and melanoma, and their ability to induce pathological epithelial and stromal changes.
Few Genes That Were Found to Have Opposing Patterns Between the HFs and DFs-DPCs in Either the HF-Only or IFK-Only Detected Genes
Among the uniquely HF-expressed or uniquely IFK-expressed genes in HF versus IFK, those gene expression patterns observed in DF-DPC mostly followed those of the HF pattern. However, we discovered that the Cldn3 and Kcne1 genes were highly expressed only in HFs and were rarely detected in the IFKs and DFs-DPCs (Fig. 4A, B). In different epithelial types, claudins exhibit specific expression patterns and permeability by regulating the tight junctions (15). Cldn3 is expressed in the tight junctions of endocrine epithelial ducts (53,65). Furthermore, Cldn3 upregulation is observed frequently in ovarian tumors (3), and a promising result of claudin gene-targeted therapy has been reported in a mouse model (18,55). The Kcne gene has a role in voltage-gated potassium channel (Kv) regulation in the heart and skeletal muscle (1,2,57). Kcne1 is known to be an important regulator of Kv12.2 current and thus contributes to neuronal resting membrane potential (8). Although little is known about the relationship between the HF and Cldn3 (61) and because Kcne1 has not been reported to play a role in the HF, we inferred that Cldn3 might contribute to regulating the tight junctions and permeability of HFs. Furthermore, the K+ current of HF would be another clue that the HF cell character is related to Kcne1.
We then inspected the opposite pattern of genes among uniquely IFK-expressed genes in HF versus IFK (Fig. 4C, D). Interestingly, in addition to Rgs1, two subtype genes, C1qb and C1qc, were concurrently discovered. C1q plays a key role in connecting innate immunity, driven by the classical complement pathway, and acquired immunity (26,27). C1qb and C1qc are immune and inflammatory response genes; they have been researched in immunology fields in the context of SLE (52,59) and rheumatoid arthritis (63) and have recently been studied in cerebral vasculopathy and vascular calcification (62,64). The role of the contrasting patterns observed in the HFs (down-regulation) and the IFKs and DFs-DPCs (upregulation) of C1qb and C1qc is worthy of research because there may be a link between immunity and inflammation in the skin and neoplasia in the context of immune modulation.
Representative Cell Cycle Genes, Foxo Subtypes
Notably, all subtypes of Foxo1, −3, and -4 showed similar expression patterns in all three cell types (Fig. 6D–F), consistent with their cell cycle distribution patterns (Fig. 6A, B). Foxo1, - 3, and -4, are well known to protect quiescent cells from oxidative stress. Additionally, in our data, we discovered that Foxo6 (with a fold change for HF/IFK of 1.63 and for HF/DF-DPC of 1.23) (Foxo6, located in the nucleus after growth factor stimulation) exhibited a gene expression pattern similar to that of Foxo1, −3, and -4 (located in the cytoplasm). Indeed, Foxo6 was first described as having shuttling properties distinct from those of Foxo1 and -3 (22). We suggest that the Foxo6 expression observed in the HFs may facilitate the nuclear import of certain signals involved in quiescence with rare apoptosis in coordination with Foxo1, −3 and -4; those interactions are worthy of study in the near future.
In conclusion, we hope that the data presented in this study could provide important new potential insights into the synergistic substructures of the IFK, HF, and DF-DPC and the role that their DEGs may play in clinical skin disease. We used a NGS analysis in normal murine hair follicular substructures and long-term synergistic combination of the major skin substructures in vivo to generate the data presented here. Additionally, based on the different patterns of the cultured cell cycle, we investigated cell cycle-related genes. Continuing these investigations with increasingly advanced transcriptome analysis will lead to new opportunities for understanding the known genes involved in skin diseases, particularly those that are associated with the HFs.
Footnotes
Acknowledgments
DESeq analysis of this research was supported by grant (2011-0019487) from the Bio and Medical Technology Development Program of the National Research Foundation (NRF) funded by the Korean government (MEST), and the remainder of this research was supported by a grant (10033642) from the Industry Sources Development Project, the Ministry of Knowledge Economy, Republic of Korea. J.L. and H.C. designed the study; J.L. and K.L. performed qRT-PCR experiments; J.L. analyzed NGS data, performed histopathological experiments, performed the literature search; and J.L. generated figures and conceived the first manuscript draft. All authors were involved in writing the article and had final approval of the submitted and published versions. The authors declare no conflicts of interest.